. 2020 Nov:191:104274.
doi: 10.1016/j.jpubeco.2020.104274. Epub 2020 Sep 9.

Economic uncertainty before and during the COVID-19 pandemic

Affiliations

Economic uncertainty before and during the COVID-19 pandemic

Dave Altig et al. J Public Econ. 2020 Nov.

Abstract

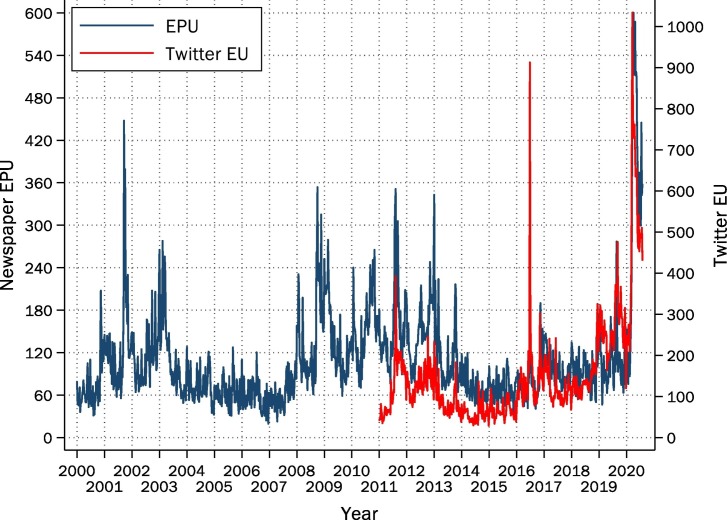
We consider several economic uncertainty indicators for the US and UK before and during the COVID-19 pandemic: implied stock market volatility, newspaper-based policy uncertainty, Twitter chatter about economic uncertainty, subjective uncertainty about business growth, forecaster disagreement about future GDP growth, and a model-based measure of macro uncertainty. Four results emerge. First, all indicators show huge uncertainty jumps in reaction to the pandemic and its economic fallout. Indeed, most indicators reach their highest values on record. Second, peak amplitudes differ greatly - from a 35% rise for the model-based measure of US economic uncertainty (relative to January 2020) to a 20-fold rise in forecaster disagreement about UK growth. Third, time paths also differ: Implied volatility rose rapidly from late February, peaked in mid-March, and fell back by late March as stock prices began to recover. In contrast, broader measures of uncertainty peaked later and then plateaued, as job losses mounted, highlighting differences between Wall Street and Main Street uncertainty measures. Fourth, in Cholesky-identified VAR models fit to monthly U.S. data, a COVID-size uncertainty shock foreshadows peak drops in industrial production of 12-19%.

Keywords: COVID-19; Coronavirus; Forward-looking uncertainty measures; Volatility.


Figures

Fig. 1
Fig. 1
VIX, implied stock returns volatility, Weekly Since 2000. Notes: Weekly implied volatility over the next month on the S&P500 index from the Chicago Board of Options Exchange, expressed in annualized units. We plot data from 3 January 2000 to 4 August 2020 (18 May 2020 for VIX 24 M). Values downloaded from https://fred.stlouisfed.org/series/VIXCLS. Weekly implied volatility over the next 24 months downloaded from Wharton Research Data Services. Latest data kindly provided by Ian L. Dew-Backer.
Fig. 2
Fig. 2
U.S. Economic Policy Uncertainty Index and Twitter Economic Uncertainty Index, Weekly Since 2000. Notes: Weekly values for EPU and Twitter EU using data downloaded from www.policyuncertainty.com/. See Baker et al. (2016) and Baker, Bloom et al. (2020) for details of index construction. We plot data from 1 January 2000 to 4 August 2020 (2 August for Twitter EU).
Fig. 3
Fig. 3
Firm-Level Subjective Sales Uncertainty, Monthly from 2017. Notes: Subjective uncertainty about the growth rate of sales at a four-quarter look-ahead horizon. US data form the Survey of Business Uncertainty at www.frbatlanta.org/research/surveys/business-uncertainty (Altig et al., 2020c). UK data from the Decision Maker Panel Survey at www.decisionmakerpanel.com.
Fig. 4
Fig. 4
COVID-Induced Uncertainty Rose Rapidly in March 2020% firms reporting Covid-19 as their top source of uncertainty. Notes: Decision Maker Panel Survey (www.decisionmakerpanel.com) conducted by the Bank of England, Nottingham University and Stanford University and described in Baker et al. (2019). (For interpretation of the references to colour in this figure legend, the reader is referred to the web version of this article.)
Fig. 5
Fig. 5
Cross-sectional dispersion of GDP growth forecasts. Notes: Chart shows standard deviation of one-year-ahead annual real GDP growth forecasts. US data are from the Survey of Professional Forecasters conducted by the Philadelphia Fed (www.philadelphiafed.org/research-and-data/real-time-center/survey-of-professional-forecasters). The deadline for submitting responses to the SPF survey is usually in the first half of February, May, August, and November (see www.philadelphiafed.org/-/media/research-and-data/real-time-center/survey-of-professional-forecasters/spf-release-dates.txt). The submission deadline for the latest survey was 12 May 2020. UK data are from the Survey of External Forecasters conducted by the Bank of England (www.bankofengland.co.uk/monetary-policy-report/2020/january-2020/other-forecasters-expectations). The SEF is in the field for two weeks one month ahead of the Bank of England's publication of the Monetary Policy Report. This is usually the second half of January, April, July, and October. The latest SEF survey ended on 24 April 2020.
Fig. 6
Fig. 6
Model-based macro uncertainty. Notes: One-month-ahead macro uncertainty for 1960:07–2020:04, as computed by Jurado et al. (2015) and available at www.sydneyludvigson.com/macro-and-financial-uncertainty-indexes.
Fig. 7
Fig. 7
High frequency measures of uncertainty during 2020. Notes: Decision Maker Panel Survey conducted by the Bank of England, Nottingham University and Stanford University and Baker et al. (2019) and www.decisionmakerpanel.com. Values linearly interpolated when the DMP survey was not in the field. Values of the Likert Uncertainty measure were extrapolated using information about firms' sales expectations and uncertainty for the first five weeks. VIX-24 M, Likert Uncertainty, and Sales Subjective Uncertainty's axes are hidden.
Fig. 8
Fig. 8
Impact of uncertainty on US output. Note: The charts show VAR-estimated impulse response functions for industrial production to four uncertainty innovations equal to the increase from January 2020 to their 2020 peaks (red lines), with 90% confidence bands, or to their 2008/09 peak (blue lines). We detrend following Hamilton (with p = 36, h = 12) and include three lags of each variable. We identify innovations using a Cholesky ordering as follows: uncertainty, log(S&P 500 index), effective federal reserve funds rate, log(manufacturing employment), and log(industrial production). We fit models to monthly data from October 1966 to June 2020 (VIX), October 1966 to April 2020 (macro uncertainty), August 1974 to May 2020 (forecaster disagreement), and April 1989 to June 2020 (economic policy uncertainty). (For interpretation of the references to colour in this figure legend, the reader is referred to the web version of this article.)
Fig. A1
Fig. A1
Subjective sales growth rate uncertainty by firm size. Notes: Subjective uncertainty measured for the growth rate of 4 quarters ahead firm level sales expectations (details in Altig et al., 2020c). US data form the Survey of Business Uncertainty conducted by the Federal Reserve Bank of Atlanta, Stanford University, and the University of Chicago Booth School of Business (https://www.frbatlanta.org/research/surveys/business-uncertainty). UK data from the Decision Maker Panel Survey conducted by the Bank of England, Nottingham University and Stanford University (see Baker et al. (2019) and www.decisionmakerpanel.com).
Fig. A2
Fig. A2
Subjective sales growth rate uncertainty by industry. Notes: Subjective uncertainty measured for the growth rate of 4 quarters ahead firm level sales expectations (details in Altig et al., 2020b, Altig et al., 2020c). US data form the Survey of Business Uncertainty conducted by the Federal Reserve Bank of Atlanta, Stanford University, and the University of Chicago Booth School of Business (https://www.frbatlanta.org/research/surveys/business-uncertainty). UK data from the Decision Maker Panel Survey conducted by the Bank of England, Nottingham University and Stanford University (see Baker et al. (2019) and www.decisionmakerpanel.com).
Fig. A3
Fig. A3
Impact of uncertainty shocks on employment. Note: The charts show VAR-estimated impulse response functions for employment to four uncertainty innovations equal to the increase from January 2020 to their 2020 peaks (red lines), with 90% confidence bands, or to their 2008/09 peak (blue lines). We detrend following Hamilton (with p = 36, h = 12) and include three lags of each variable. We identify innovations using a Cholesky ordering as follows: uncertainty, log(S&P 500 index), effective federal reserve funds rate, log(manufacturing employment), and log(industrial production). We fit models to monthly data from October 1966 to June 2020 (VIX), October 1966 to April 2020 (macro uncertainty), August1974 to May 2020 (forecaster disagreement), and April 1989 to June 2020 (economic policy uncertainty). (For interpretation of the references to colour in this figure legend, the reader is referred to the web version of this article.)
Fig. A4
Fig. A4
Impact of uncertainty on output using pre-COVID data. Note: The charts show VAR-estimated impulse response functions for industrial production to four uncertainty innovations equal to the increase from January 2020 to their 2020 peaks (red lines), with 90% confidence bands, or to their 2008/09 peak (blue lines). We use the same detrending method, specification, identification assumptions, and data as in Fig. 8 in the main text, except for ending the sample period in December 2019. (For interpretation of the references to colour in this figure legend, the reader is referred to the web version of this article.)
Fig. A5
Fig. A5
Impact of uncertainty on output – reversed ordering. Note: The charts show VAR-estimated impulse response functions for industrial production to four uncertainty innovations equal to the increase from January 2020 to their 2020 peaks (red lines), with 90% confidence bands, or to their 2008/09 peak (blue lines). We use the same detrending method, specification, and data as in Fig. 8 in the main text, except for a different identification assumptions, with variables ordered as follows: log(industrial production), log(manufacturing employment), effective federal reserve funds rate, log(S&P 500 index), and uncertainty. (For interpretation of the references to colour in this figure legend, the reader is referred to the web version of this article.)

References

    1. Abel Andrew, Eberly Janice. Optimal investment with costly reversibility. Review of Economic Studies. 1996;63(4):581–593.
    1. Ahir, Hites, Nicholas Bloom and Davide Furceri, 2019. “The World Uncertainty Index,” Stanford mimeo.
    1. Alfaro Laura, Chari Anusha, Greenland Andrew, Shott Peter K. 2020. Aggregate and Firm-Level Stock Returns during Pandemics, in Real Time. (working paper, 2 April)
    1. Altig David E., Barrero Jose M., Nicholas Bloom, Davis Steven J., Brent Meyer, Emil Mihaylov, Parker Nicholas B. Federal Reserve Bank of Atlanta; 2020. Firms Expect Working from Home to Triple.
    1. Altig David, Barrero Jose Maria, Bloom Nick, Davis Steven J., Meyer Brent, Mihaylov Emil, Parker Nick. 2020. “Firms Expect Working from Home to Triple,” Technical Report, Federal Reserve Bank of Atlanta. (28 May)

LinkOut - more resources