

Mixture Analyses of Air-sampled Pollen Extracts Can Accurately Differentiate Pollen Taxa
- PMID: 32922147
- PMCID: PMC7485930
- DOI: 10.1016/j.atmosenv.2020.117746
Mixture Analyses of Air-sampled Pollen Extracts Can Accurately Differentiate Pollen Taxa
Abstract
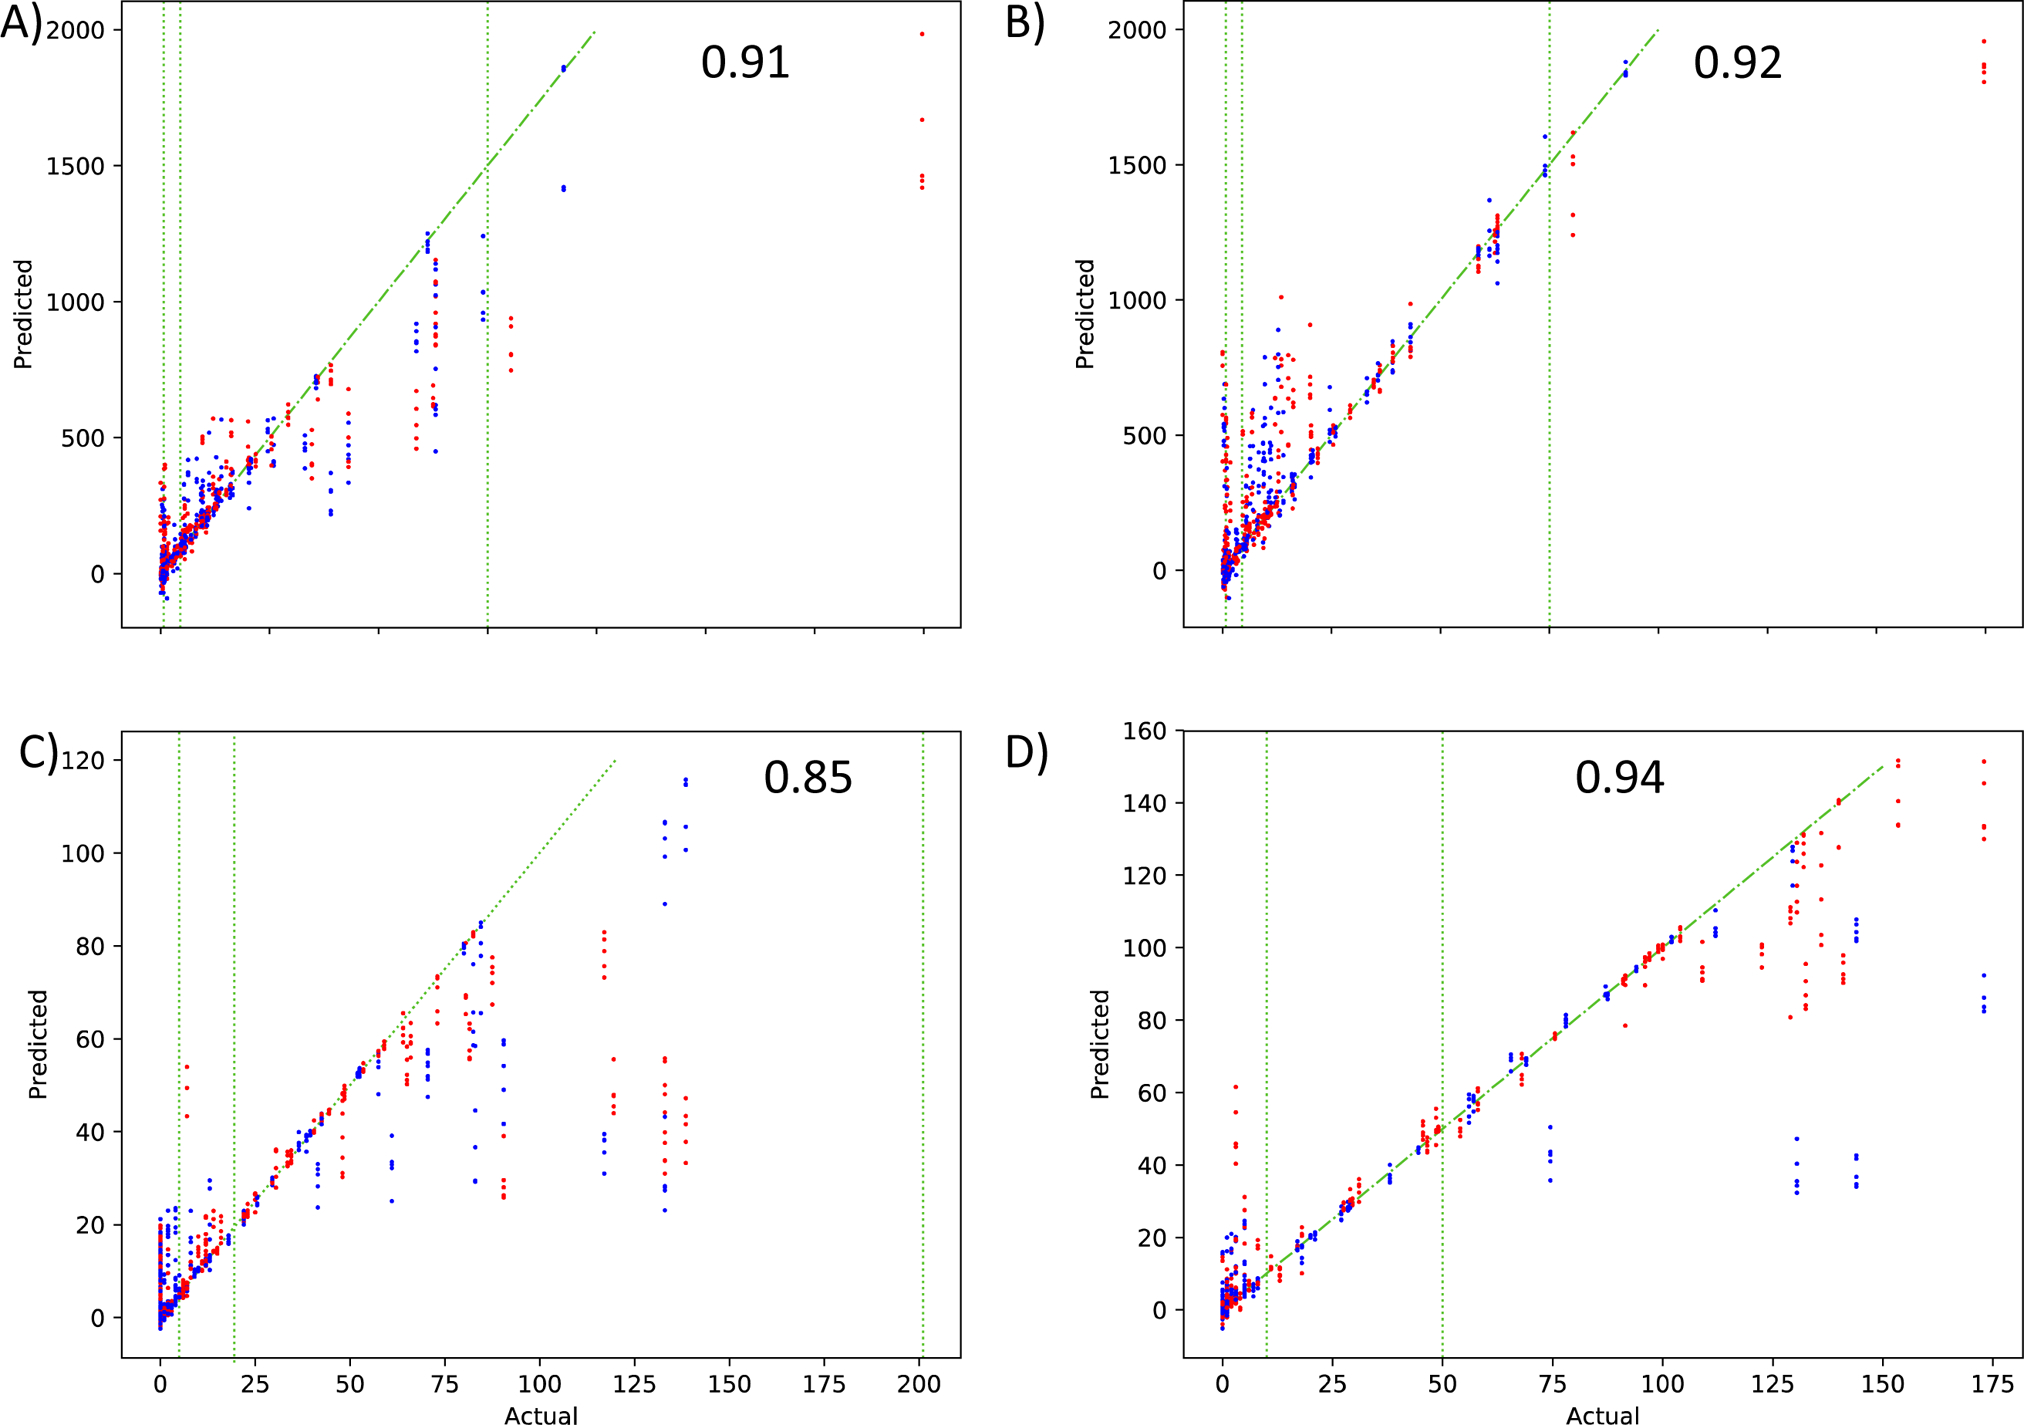
The daily pollen forecast provides crucial information for allergic patients to avoid exposure to specific pollen. Pollen counts are typically measured with air samplers and analyzed with microscopy by trained experts. In contrast, this study evaluated the effectiveness of identifying the component pollens using the metabolites extracted from an air-sampled pollen mixture. Ambient air-sampled pollen from Munich in 2016 and 2017 was visually identified from reference pollens and extracts were prepared. The extracts were lyophilized, rehydrated in optimal NMR buffers, and filtered to remove large proteins. NMR spectra were analyzed for pollen associated metabolites. Regression and decision-tree based algorithms using the concentration of metabolites, calculated from the NMR spectra outperformed algorithms using the NMR spectra themselves as input data for pollen identification. Categorical prediction algorithms trained for low, medium, high, and very high pollen count groups had accuracies of 74% for the tree, 82% for the grass, and 93% for the weed pollen count. Deep learning models using convolutional neural networks performed better than regression models using NMR spectral input, and were the overall best method in terms of relative error and classification accuracy (86% for tree, 89% for grass, and 93% for weed pollen count). This study demonstrates that NMR spectra of air-sampled pollen extracts can be used in an automated fashion to provide taxa and type-specific measures of the daily pollen count.
Keywords: NMR; aerobiology; exposure; metabolomics; mixtures; pollen.
Conflict of interest statement
Declaration of competing interests The authors declare that they have no known competing financial interests or personal relationships that could have appeared to influence the work reported in this paper.
Figures


Similar articles
-
A metabolomic, geographic, and seasonal analysis of the contribution of pollen-derived adenosine to allergic sensitization.Metabolomics. 2016 Dec;12(12):187. doi: 10.1007/s11306-016-1130-6. Epub 2016 Nov 2. Metabolomics. 2016. PMID: 28798556 Free PMC article.
-
Short term physician visits and medication prescriptions for allergic disease associated with seasonal tree, grass, and weed pollen exposure across the United States.Environ Health. 2021 Jul 21;20(1):85. doi: 10.1186/s12940-021-00766-3. Environ Health. 2021. PMID: 34289856 Free PMC article.
-
Associations among air pollutants, grass pollens, and daily number of grass pollen allergen-positive patients: a longitudinal study from 2012 to 2016.Int Forum Allergy Rhinol. 2019 Nov;9(11):1297-1303. doi: 10.1002/alr.22389. Epub 2019 Sep 12. Int Forum Allergy Rhinol. 2019. PMID: 31513736
-
Grass pollen allergens globally: the contribution of subtropical grasses to burden of allergic respiratory diseases.Clin Exp Allergy. 2014 Jun;44(6):790-801. doi: 10.1111/cea.12317. Clin Exp Allergy. 2014. PMID: 24684550 Review.
-
[Allergy, pollen and the environment].Gac Med Mex. 2009 May-Jun;145(3):215-22. Gac Med Mex. 2009. PMID: 19685827 Review. Spanish.
Cited by
-
Omics Data and Data Representations for Deep Learning-Based Predictive Modeling.Int J Mol Sci. 2022 Oct 14;23(20):12272. doi: 10.3390/ijms232012272. Int J Mol Sci. 2022. PMID: 36293133 Free PMC article. Review.
-
Development and application of a method to classify airborne pollen taxa concentration using light scattering data.Sci Rep. 2021 Nov 16;11(1):22371. doi: 10.1038/s41598-021-01919-7. Sci Rep. 2021. PMID: 34785742 Free PMC article.
References
-
- BACHMANN R, KLOCKMANN S, HAERDTER J, FISCHER M & HACKL T 2018. (1)H NMR Spectroscopy for Determination of the Geographical Origin of Hazelnuts. J Agric Food Chem, 66, 11873–11879. - PubMed
-
- BRENNAN GL, POTTER C, DE VERE N, GRIFFITH GW, SKJOTH CA, OSBORNE NJ, WHEELER BW, MCINNES RN, CLEWLOW Y, BARBER A, HANLON HM, HEGARTY M, JONES L, KURGANSKIY A, ROWNEY FM, ARMITAGE C, ADAMS-GROOM B, FORD CR, PETCH GM, POLLER GENC & CREER S 2019. Temperate airborne grass pollen defined by spatio-temporal shifts in community composition. Nat Ecol Evol, 3, 750–754. - PubMed
-
- BURBACH GJ, HEINZERLING LM, EDENHARTER G, BACHERT C, BINDSLEV-JENSEN C, BONINI S, BOUSQUET J, BOUSQUET-ROUANET L, BOUSQUET PJ, BRESCIANI M, BRUNO A, CANONICA GW, DARSOW U, DEMOLY P, DURHAM S, FOKKENS WJ, GIAVI S, GJOMARKAJ M, GRAMICCIONI C, HAAHTELA T, KOWALSKI ML, MAGYAR P, MURAKOZI G, OROSZ M, PAPADOPOULOS NG, ROHNELT C, STINGL G, TODO-BOM A, VON MUTIUS E, WIESNER A, WOHRL S & ZUBERBIER T 2009. GA(2)LEN skin test study II: clinical relevance of inhalant allergen sensitizations in Europe. Allergy, 64, 1507–15. - PubMed
-
- BUTERS J, PRANK M, SOFIEV M, PUSCH G, ALBERTINI R, ANNESI-MAESANO I, ANTUNES C, BEHRENDT H, BERGER U, BRANDAO R, CELENK S, GALAN C, GREWLING L, JACKOWIAK B, KENNEDY R, RANTIO-LEHTIMAKI A, REESE G, SAULIENE I, SMITH M, THIBAUDON M, WEBER B & CECCHI L 2015. Variation of the group 5 grass pollen allergen content of airborne pollen in relation to geographic location and time in season. J Allergy Clin Immunol, 136, 87–95 e6. - PubMed
LinkOut - more resources
Full Text Sources