

Identification of Key Genes and Pathways in Myeloma side population cells by Bioinformatics Analysis
- PMID: 32922167
- PMCID: PMC7484674
- DOI: 10.7150/ijms.48244
Identification of Key Genes and Pathways in Myeloma side population cells by Bioinformatics Analysis
Abstract
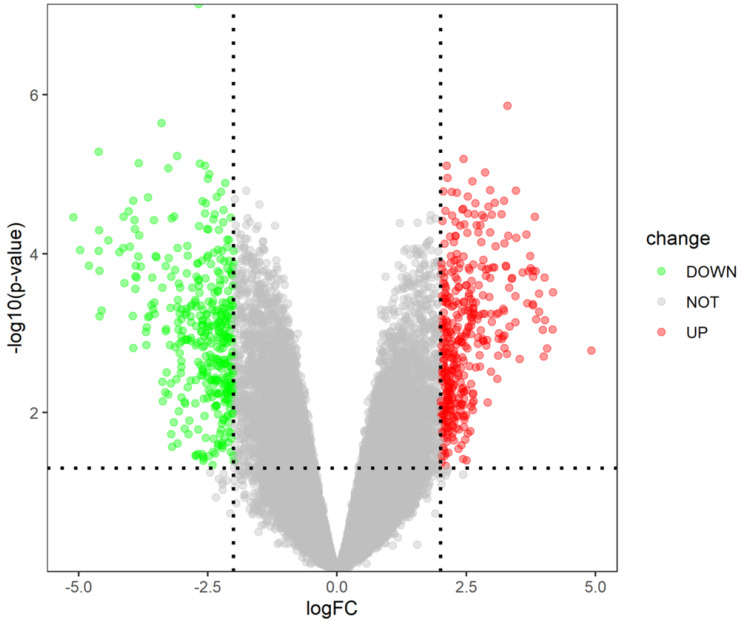
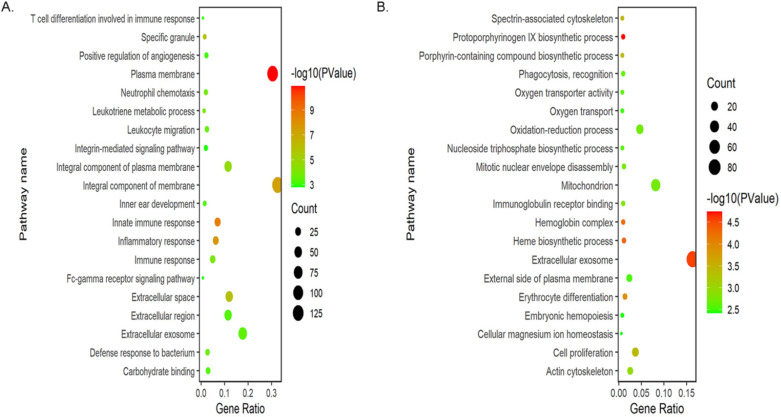
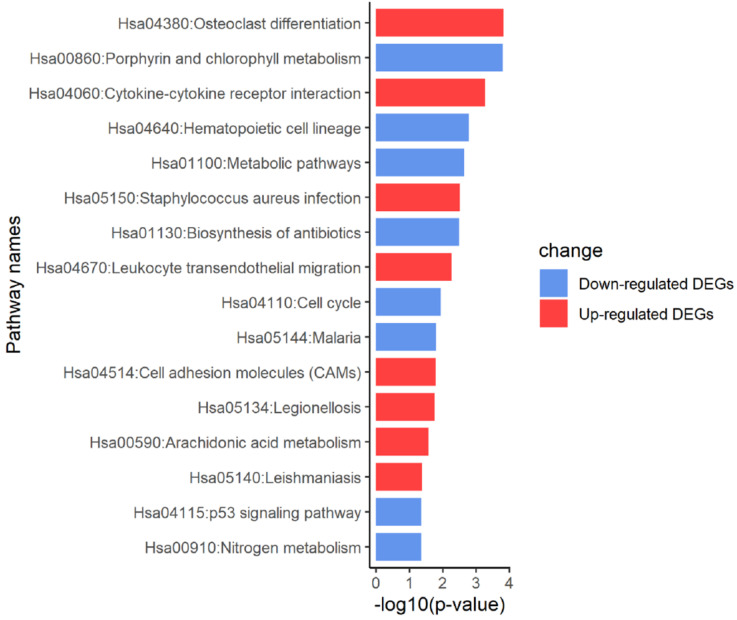
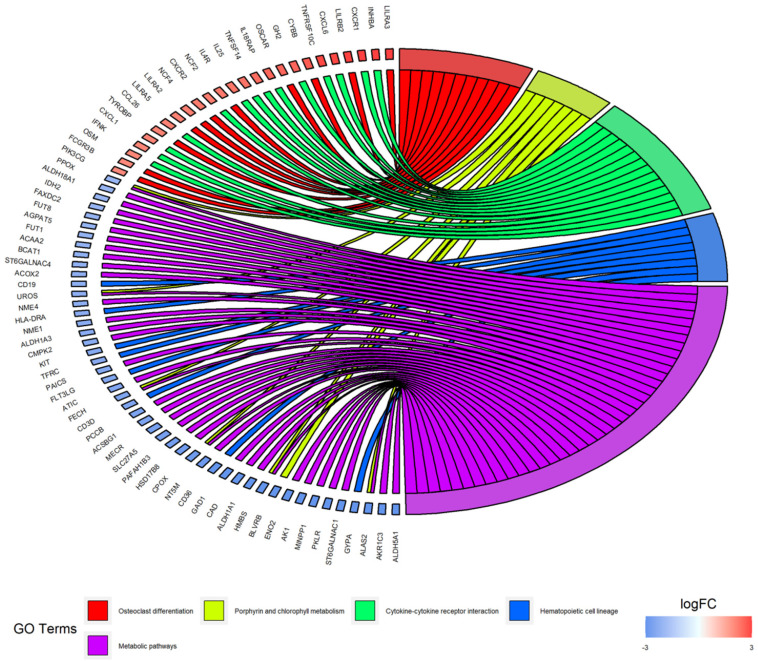
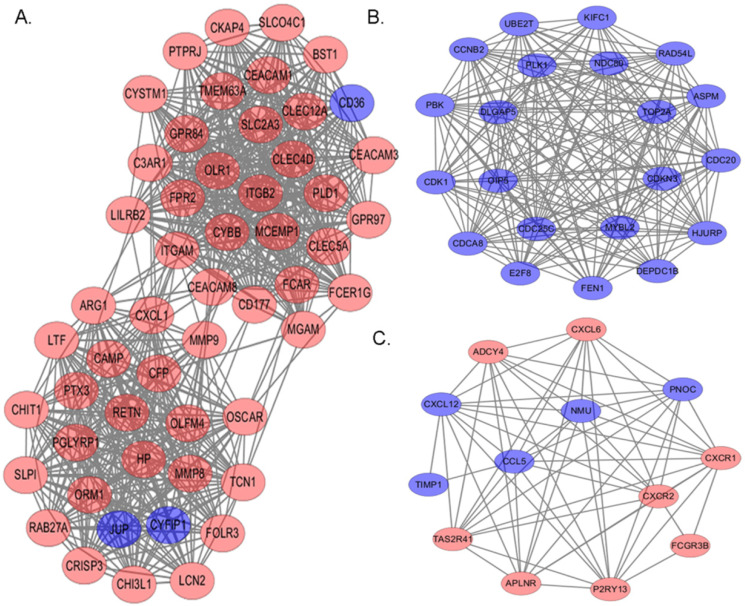
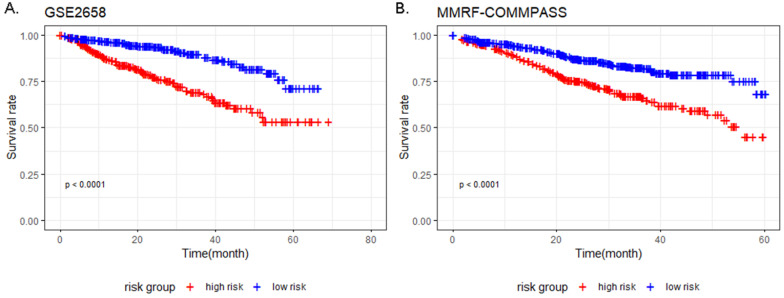
Background: Multiple myeloma (MM) is the second most common hematological malignancy, which is still incurable and relapses inevitably, highlighting further understanding of the possible mechanisms. Side population (SP) cells are a group of enriched progenitor cells showing stem-like phenotypes with a distinct low-staining pattern with Hoechst 33342. Compared to main population (MP) cells, the underlying molecular characteristics of SP cells remain largely unclear. This bioinformatics analysis aimed to identify key genes and pathways in myeloma SP cells to provide novel biomarkers, predict MM prognosis and advance potential therapeutic targets. Methods: The gene expression profile GSE109651 was obtained from Gene Expression Omnibus database, and then differentially expressed genes (DEGs) with P-value <0.05 and |log2 fold-change (FC)| > 2 were selected by the comparison of myeloma light-chain (LC) restricted SP (LC/SP) cells and MP CD138+ cells. Subsequently, gene ontology (GO) and Kyoto encyclopedia of genes and genomes (KEGG) pathway enrichment analysis, protein-protein interaction (PPI) network analysis were performed to identify the functional enrichment analysis of the DEGs and screen hub genes. Cox proportional hazards regression was used to select the potential prognostic DEGs in training dataset (GSE2658). The prognostic value of the potential prognostic genes was evaluated by Kaplan-Meier curve and validated in another external dataset (MMRF-CoMMpass cohort from TCGA). Results: Altogether, 403 up-regulated and 393 down-regulated DEGs were identified. GO analysis showed that the up-regulated DEGs were significantly enriched in innate immune response, inflammatory response, plasma membrane and integral component of membrane, while the down-regulated DEGs were mainly involved in protoporphyrinogen IX and heme biosynthetic process, hemoglobin complex and erythrocyte differentiation. KEGG pathway analysis suggested that the DEGs were significantly enriched in osteoclast differentiation, porphyrin and chlorophyll metabolism and cytokine-cytokine receptor interaction. The top 10 hub genes, identified by the plug-in cytoHubba of the Cytoscape software using maximal clique centrality (MCC) algorithm, were ITGAM, MMP9, ITGB2, FPR2, C3AR1, CXCL1, CYBB, LILRB2, HP and FCER1G. Modules and corresponding GO enrichment analysis indicated that myeloma LC/SP cells were significantly associated with immune system, immune response and cell cycle. The predictive value of the prognostic model including TFF3, EPDR1, MACROD1, ARHGEF12, AMMECR1, NFATC2, HES6, PLEK2 and SNCA was identified, and validated in another external dataset (MMRF-CoMMpass cohort from TCGA). Conclusions: In conclusion, this study provides reliable molecular biomarkers for screening, prognosis, as well as novel therapeutic targets for myeloma LC/SP cells.
Keywords: Bioinformatics analysis; Cancer stem cell; Multiple myeloma; Side population cells; differentially expressed gene.
© The author(s).
Conflict of interest statement
Competing Interests: The authors have declared that no competing interest exists.
Figures

Similar articles
-
The identification of key genes and pathways in hepatocellular carcinoma by bioinformatics analysis of high-throughput data.Med Oncol. 2017 Jun;34(6):101. doi: 10.1007/s12032-017-0963-9. Epub 2017 Apr 21. Med Oncol. 2017. PMID: 28432618 Free PMC article.
-
New insights into genetic characteristics between multiple myeloma and COVID-19: An integrative bioinformatics analysis of gene expression omnibus microarray and the cancer genome atlas data.Int J Lab Hematol. 2021 Dec;43(6):1325-1333. doi: 10.1111/ijlh.13717. Epub 2021 Oct 8. Int J Lab Hematol. 2021. PMID: 34623759 Free PMC article.
-
FN1, SPARC, and SERPINE1 are highly expressed and significantly related to a poor prognosis of gastric adenocarcinoma revealed by microarray and bioinformatics.Sci Rep. 2019 May 24;9(1):7827. doi: 10.1038/s41598-019-43924-x. Sci Rep. 2019. PMID: 31127138 Free PMC article.
-
Exploring nasopharyngeal carcinoma genetics: Bioinformatics insights into pathways and gene associations.Med J Malaysia. 2024 Sep;79(5):615-625. Med J Malaysia. 2024. PMID: 39352166 Review.
-
Strong Correlation between the Expression of CHEK1 and Clinicopathological Features of Patients with Multiple Myeloma.Crit Rev Eukaryot Gene Expr. 2020;30(4):349-357. doi: 10.1615/CritRevEukaryotGeneExpr.2020027084. Crit Rev Eukaryot Gene Expr. 2020. PMID: 32894664 Review.
Cited by
-
Pleckstrin-2 as a Prognostic Factor and Mediator of Gastric Cancer Progression.Gastroenterol Res Pract. 2021 Aug 4;2021:5527387. doi: 10.1155/2021/5527387. eCollection 2021. Gastroenterol Res Pract. 2021. PMID: 34394345 Free PMC article.
-
Meta-analysis of integrated ChIP-seq and transcriptome data revealed genomic regions affected by estrogen receptor alpha in breast cancer.BMC Med Genomics. 2023 Sep 15;16(1):219. doi: 10.1186/s12920-023-01655-z. BMC Med Genomics. 2023. PMID: 37715225 Free PMC article.
-
Deep hematologic response to RD treatment in patients with multiple myeloma is associated with overexpression of IL-17R in CD138+ plasma cells.Sci Rep. 2024 Oct 9;14(1):23559. doi: 10.1038/s41598-024-74558-3. Sci Rep. 2024. PMID: 39384864 Free PMC article.
-
Key immune-related gene ITGB2 as a prognostic signature for acute myeloid leukemia.Ann Transl Med. 2021 Sep;9(17):1386. doi: 10.21037/atm-21-3641. Ann Transl Med. 2021. PMID: 34733938 Free PMC article.
-
The Transcription Factor Twist1 Has a Significant Role in Mycosis Fungoides (MF) Cell Biology: An RNA Sequencing Study of 40 MF Cases.Cancers (Basel). 2023 Feb 28;15(5):1527. doi: 10.3390/cancers15051527. Cancers (Basel). 2023. PMID: 36900319 Free PMC article.
References
-
- Siegel RL, Miller KD, Jemal A. Cancer statistics, 2019. CA Cancer J Clin. 2019;69:7–34. - PubMed
-
- Hideshima T, Mitsiades C, Tonon G, Richardson PG, Anderson KC. Understanding multiple myeloma pathogenesis in the bone marrow to identify new therapeutic targets. Nat Rev Cancer. 2007;7:585–98. - PubMed
-
- Tan D, Chng WJ, Chou T, Nawarawong W, Hwang SY, Chim CS. et al. Management of multiple myeloma in Asia: resource-stratified guidelines. Lancet Oncol. 2013;14:e571–81. - PubMed
-
- Reya T, Morrison SJ, Clarke MF, Weissman IL. Stem cells, cancer, and cancer stem cells. Nature. 2001;414:105–11. - PubMed
-
- Jordan CT, Guzman ML, Noble M. Cancer stem cells. N Engl J Med. 2006;355:1253–61. - PubMed
MeSH terms
Substances
LinkOut - more resources
Full Text Sources
Medical
Research Materials
Miscellaneous
