

Serum transferrin predicts end-stage Renal Disease in Type 2 Diabetes Mellitus patients
- PMID: 32922172
- PMCID: PMC7484672
- DOI: 10.7150/ijms.46259
Serum transferrin predicts end-stage Renal Disease in Type 2 Diabetes Mellitus patients
Abstract
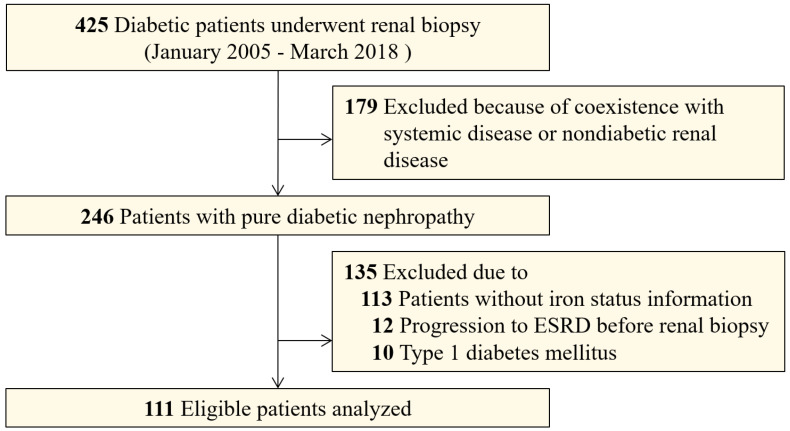
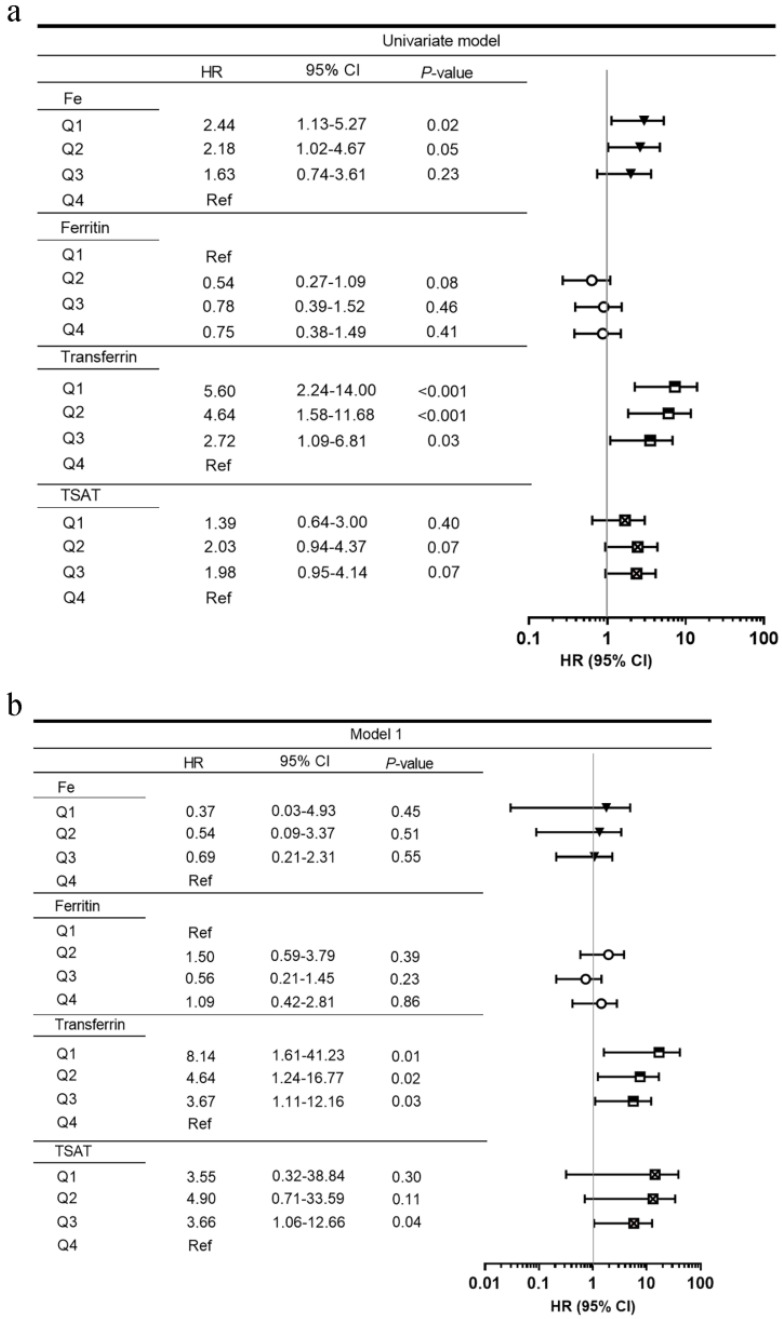
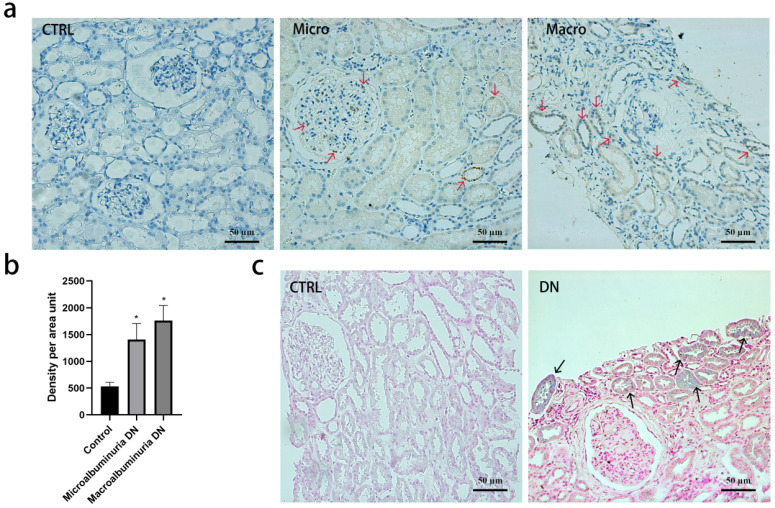
Background: To investigate the relationship between serum iron status and renal outcome in patients with type 2 diabetes mellitus (T2DM). Methods: Chinese patients (n=111) with T2DM and biopsy-proven diabetic nephropathy (DN) were surveyed in a longitudinal, retrospective study. Serum iron, total iron-binding capacity, ferritin, and transferrin were measured at the time of renal biopsy. Iron deposition and transferrin staining were performed with renal biopsy specimens of DN patients and potential kidney donors. End-stage renal disease (ESRD) was the end-point. ESRD was defined as an estimated glomerular filtration rate <15 mL/min/1.73 m2 or the need for chronic renal replacement therapy. Cox proportional hazard models were used to estimate the hazard ratios (HRs) for the influence of serum iron metabolism on ESRD. Results: During a median follow up of 30.9 months, 66 (59.5%) patients progressed to ESRD. After adjusting for age, sex, baseline systolic blood pressure, renal functions, hemoglobin, HbA1c, and pathological findings, lower serum transferrin concentrations were significantly associated with higher ESRD in multivariate models. Compared with patients in the highest transferrin quartile (≥1.65 g/L), patients in the lowest quartile (≤1.15 g/L) had multivariable-adjusted HR (95% confidence interval) of 7.36 (1.40-38.65) for ESRD. Moreover, tubular epithelial cells in DN exhibited a higher deposition of iron and transferrin expression compared with healthy controls. Conclusions: Low serum transferrin concentration was associated with diabetic ESRD in patients with T2DM. Free iron nephrotoxicity and poor nutritional status with accumulated iron or transferrin deposition might contribute to ESRD.
Keywords: diabetic nephropathy; end-stage renal disease; iron nephrotoxicity; transferrin.
© The author(s).
Conflict of interest statement
Competing Interests: The authors have declared that no competing interest exists.
Figures

Similar articles
-
Remnant cholesterol and the risk of diabetic nephropathy progression to end-stage kidney disease in patients with type 2 diabetes mellitus: a longitudinal cohort study.Endocrine. 2024 Dec;86(3):994-1002. doi: 10.1007/s12020-024-03948-4. Epub 2024 Jul 12. Endocrine. 2024. PMID: 39126619 Free PMC article.
-
Serum fibrinogen predicts diabetic ESRD in patients with type 2 diabetes mellitus.Diabetes Res Clin Pract. 2018 Jul;141:1-9. doi: 10.1016/j.diabres.2018.04.025. Epub 2018 Apr 21. Diabetes Res Clin Pract. 2018. PMID: 29684616
-
Clinicopathologic features and prognostic factors in older patients with biopsy-proven diabetic nephropathy.Int Urol Nephrol. 2021 Jun;53(6):1161-1170. doi: 10.1007/s11255-020-02710-9. Epub 2021 Jan 3. Int Urol Nephrol. 2021. PMID: 33389518
-
Lessons learned from studies of the natural history of diabetic nephropathy in young type 1 diabetic patients.Pediatr Endocrinol Rev. 2008 Aug;5 Suppl 4:958-63. Pediatr Endocrinol Rev. 2008. PMID: 18806710 Review.
-
The impact of blood lipids and statins on renal function and mortality in patients with diabetic nephropathy: A meta-analysis.Acta Pharm. 2025 Apr 10;75(1):1-22. doi: 10.2478/acph-2025-0002. Print 2025 Mar 1. Acta Pharm. 2025. PMID: 39686670
Cited by
-
Indexes of ferroptosis and iron metabolism were associated with the severity of diabetic nephropathy in patients with type 2 diabetes mellitus: a cross-sectional study.Front Endocrinol (Lausanne). 2023 Dec 22;14:1297166. doi: 10.3389/fendo.2023.1297166. eCollection 2023. Front Endocrinol (Lausanne). 2023. PMID: 38189040 Free PMC article.
-
Comprehensive analysis of ferritinophagy-related genes and immune infiltration landscape in diabetic retinopathy.Front Endocrinol (Lausanne). 2023 Jul 14;14:1177488. doi: 10.3389/fendo.2023.1177488. eCollection 2023. Front Endocrinol (Lausanne). 2023. PMID: 37522124 Free PMC article.
-
Targeting ferroptosis: a new therapeutic opportunity for kidney diseases.Front Immunol. 2024 Jul 3;15:1435139. doi: 10.3389/fimmu.2024.1435139. eCollection 2024. Front Immunol. 2024. PMID: 39021564 Free PMC article. Review.
-
Emerging Role of Ferroptosis in Diabetic Kidney Disease: Molecular Mechanisms and Therapeutic Opportunities.Int J Biol Sci. 2023 May 11;19(9):2678-2694. doi: 10.7150/ijbs.81892. eCollection 2023. Int J Biol Sci. 2023. PMID: 37324941 Free PMC article. Review.
-
Jian-Pi-Gu-Shen-Hua-Yu Decoction Alleviated Diabetic Nephropathy in Mice through Reducing Ferroptosis.J Diabetes Res. 2024 Mar 16;2024:9990304. doi: 10.1155/2024/9990304. eCollection 2024. J Diabetes Res. 2024. PMID: 38523631 Free PMC article.
References
-
- Zhang L, Long J, Jiang W. et al. Trends in Chronic Kidney Disease in China. The New England journal of medicine. 2016;375:905–6. - PubMed
-
- Hansen JB, Moen IW, Mandrup-Poulsen T. Iron: the hard player in diabetes pathophysiology. Acta Physiol (Oxf) 2014;210:717–32. - PubMed
-
- Shah S. Role of iron in progressive renal disease. American journal of kidney diseases: the official journal of the National Kidney Foundation. 2001;37:S30–3. - PubMed
-
- Cheung CL, Cheung TT, Lam KS. et al. High ferritin and low transferrin saturation are associated with pre-diabetes among a national representative sample of U.S. adults. Clinical nutrition (Edinburgh, Scotland) 2013;32:1055–60. - PubMed
MeSH terms
Substances
LinkOut - more resources
Full Text Sources
Medical
