

Neuroprotective Effects of Casein-Derived Peptide Met-Lys-Pro (MKP) in a Hypertensive Model
- PMID: 32922259
- PMCID: PMC7457086
- DOI: 10.3389/fnins.2020.00845
Neuroprotective Effects of Casein-Derived Peptide Met-Lys-Pro (MKP) in a Hypertensive Model
Abstract
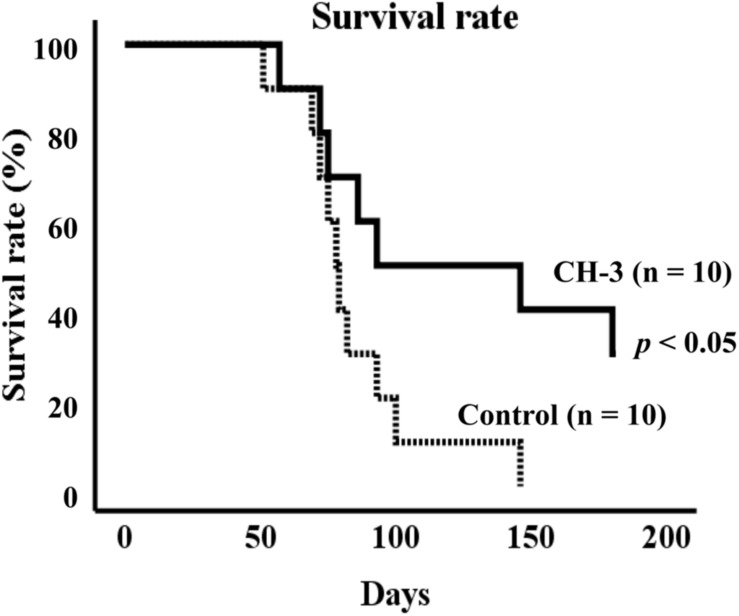
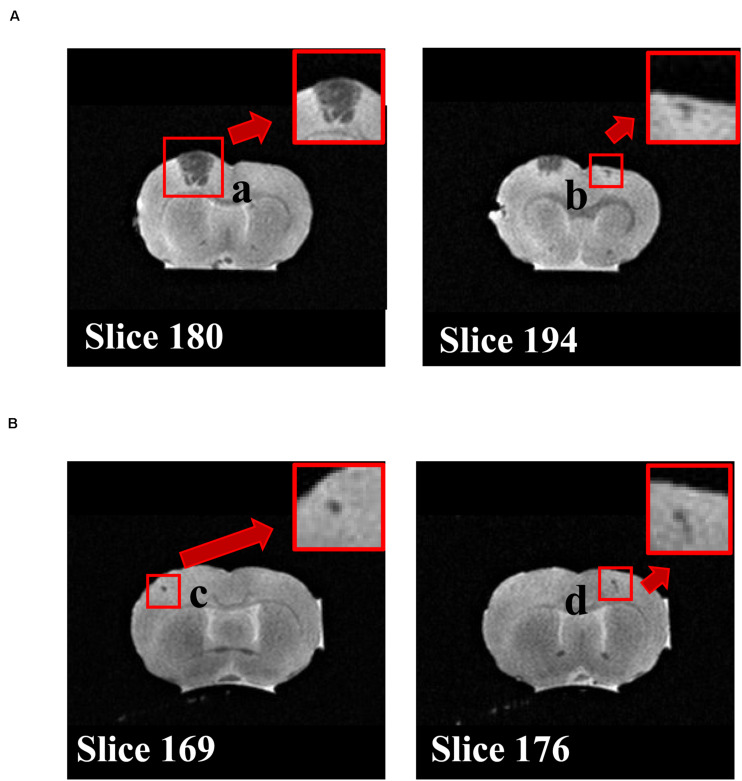
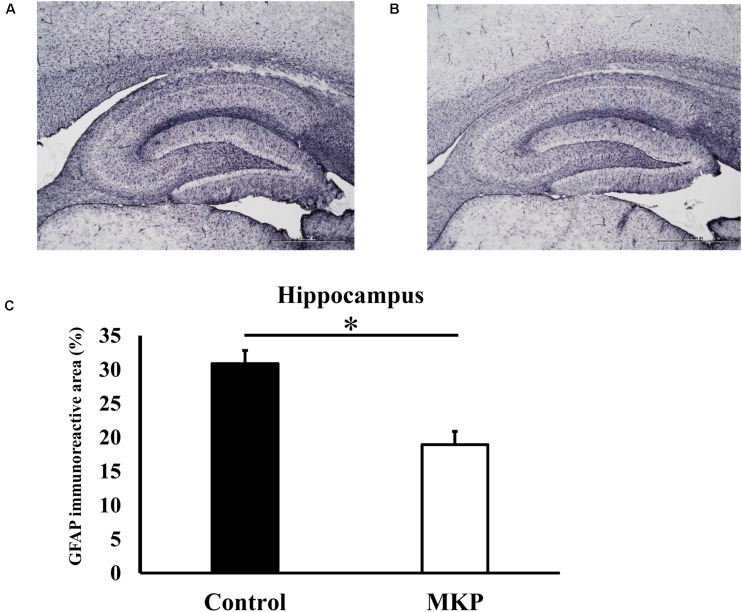
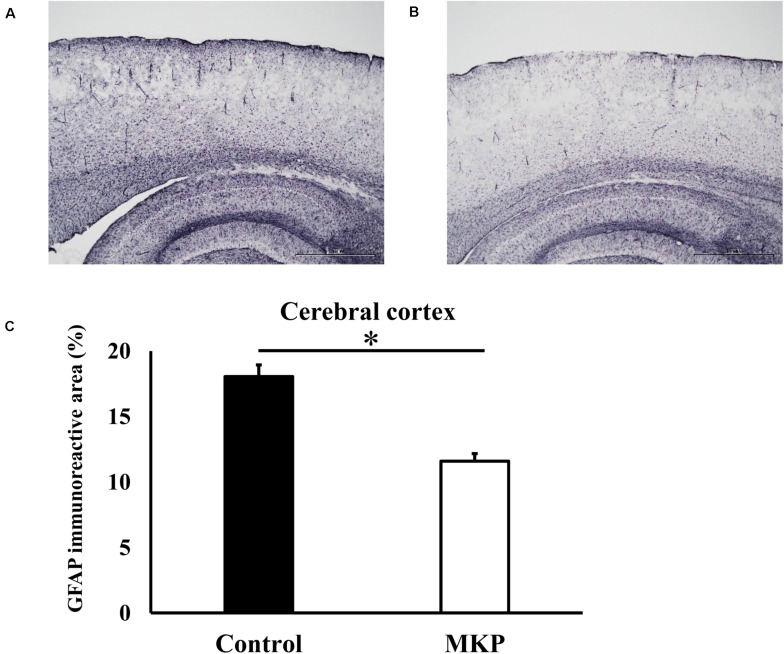
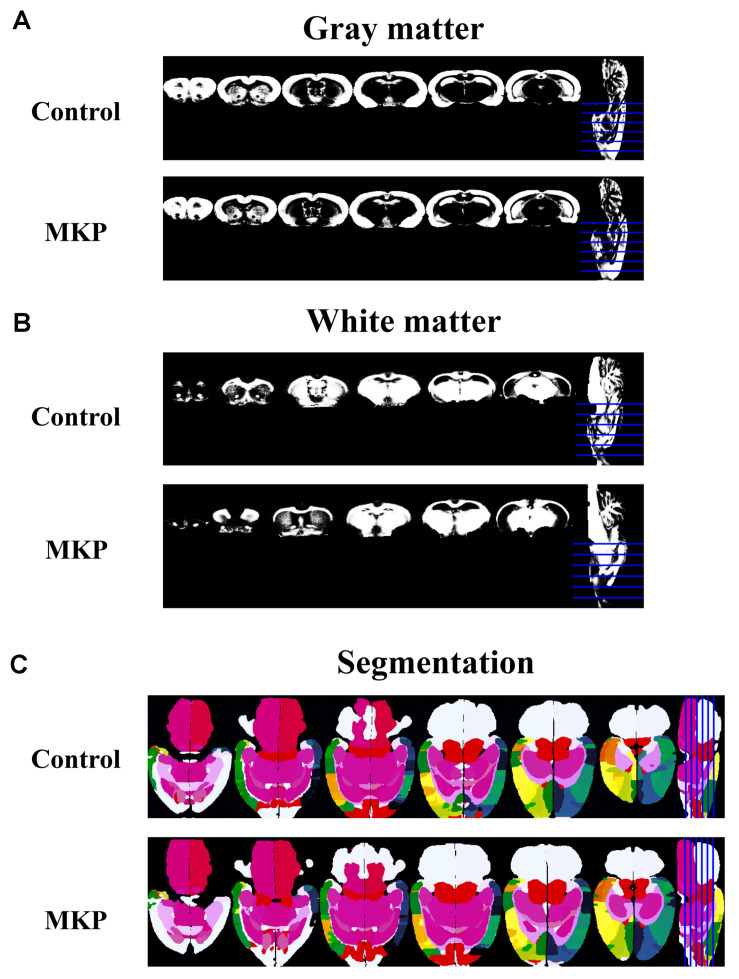
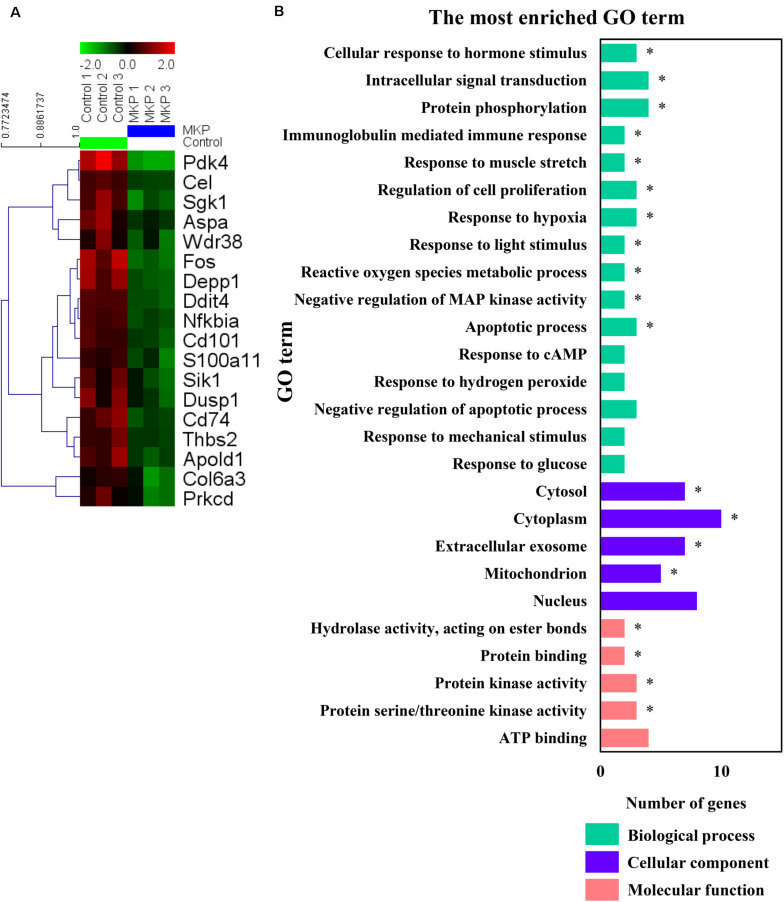
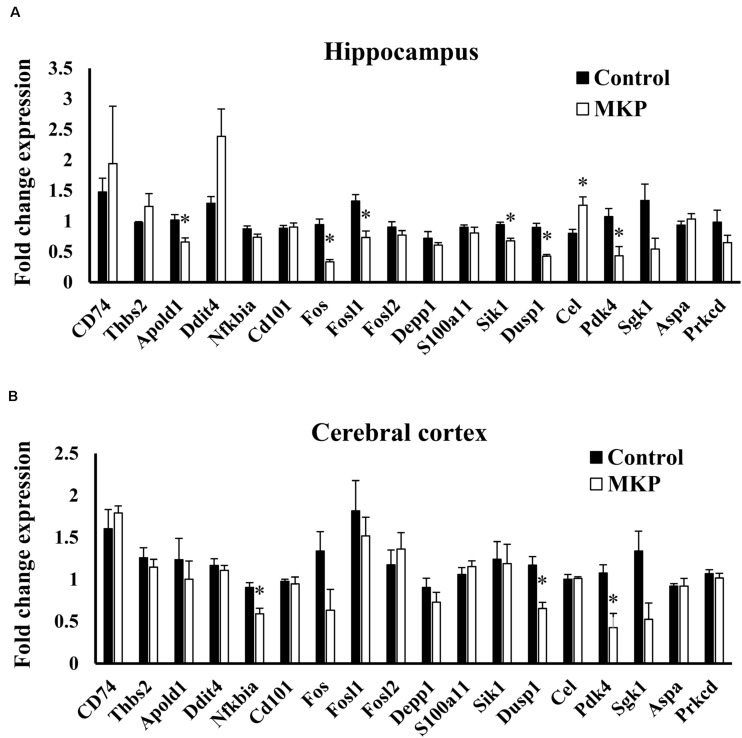
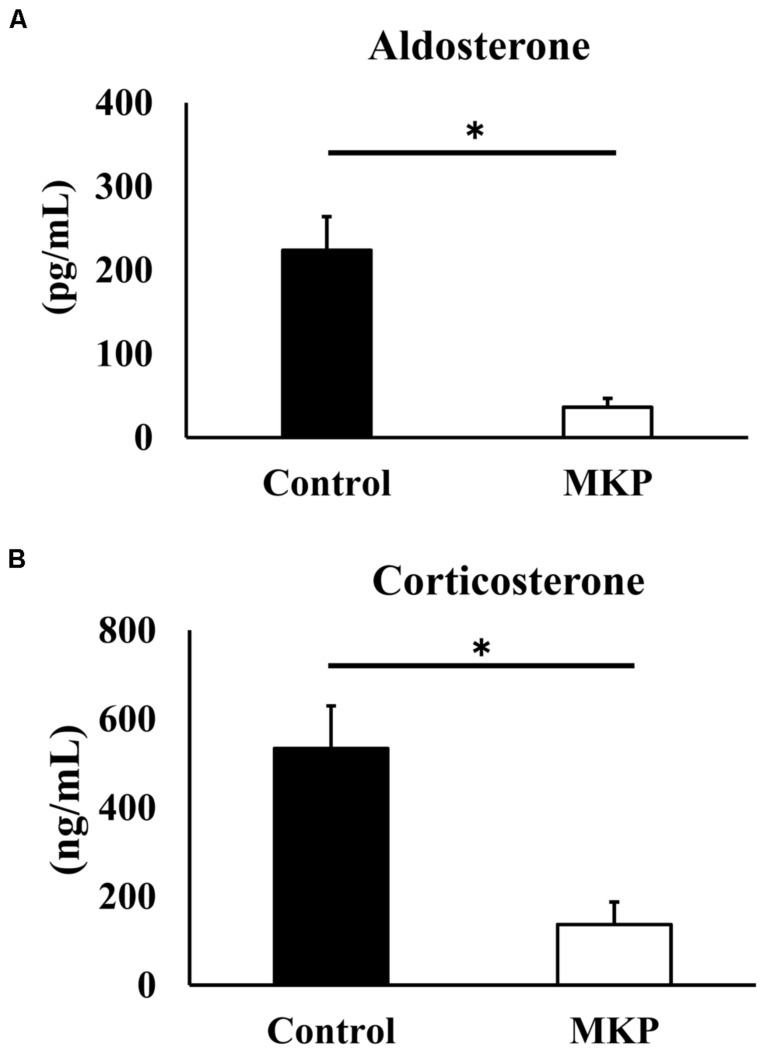
We have previously reported that casein hydrolysate, CH-3, from bovine milk and casein-derived tripeptide Met-Lys-Pro (MKP) has ACE inhibitory activity and reduces blood pressure. In this study, we investigated the therapeutic effects of MKP in a hypertensive rat model (7-week-old male SHRSP/Izm rats). For long term evaluation, rats were fed either a diet containing CH-3 or normal diet. The survival rate of SHRSP rats was significantly improved by intake of CH-3 for 181 days. For short term evaluation, rats were orally administered synthetic tripeptide MKP or distilled water for 4 weeks. MRI study demonstrated that hemorrhagic lesions were observed in two of five rats in the control group, while no hemorrhagic lesions were observed in the MKP group. Volumetric analysis using MRI revealed that MKP administration inhibited atrophy of diencephalic regions. Histological examinations revealed that hemorrhage areas and astrogliosis in the hippocampus and cerebral cortex were lower in the MKP group than in the control group. Gene expression analysis indicated that MKP administration reduced expression of genes related to cerebral circulation insufficiency such as immune responses (Cd74 and Prkcd), response to hypoxia (Ddit4, Apold1, and Prkcd), reactive oxygen species metabolic process (Ddit4 and Pdk4), and apoptotic process (Ddit4, Prkcd, and Sgk1), suggesting that MKP administration prevented cerebral ischemia associated with hypertension. In addition, some genes encoding responses to hormone stimulus (Fos, Dusp1, and Sik1) were also downregulated. Serum aldosterone and corticosterone levels were also significantly decreased following MKP administration. The present study indicates that MKP shows neuroprotective effects in SHRSP rats by regulating cerebral circulation insufficiency and corticoid levels. MKP administration may therefore be a potential therapeutic strategy for hypertensive brain diseases such as cerebrovascular disease.
Keywords: ACE inhibitor; MKP; Met-Lys-Pro; brain; hypertension; peptide.
Copyright © 2020 Tada, Hamezah, Yanagisawa, Morikawa and Tooyama.
Figures
Similar articles
-
Antihypertensive effect of the bovine casein-derived peptide Met-Lys-Pro.Food Chem. 2015 Apr 1;172:441-6. doi: 10.1016/j.foodchem.2014.09.098. Epub 2014 Sep 28. Food Chem. 2015. PMID: 25442576
-
Novel angiotensin I-converting enzyme inhibitory peptide derived from bovine casein.Food Chem. 2013 Dec 15;141(4):3781-9. doi: 10.1016/j.foodchem.2013.06.089. Epub 2013 Jun 28. Food Chem. 2013. PMID: 23993549
-
Evaluating intestinal absorption of peptide Met-Lys-Pro in casein hydrolysate using Caco-2 and human iPS cell-derived small intestinal epithelial cells.Food Res Int. 2024 Oct;193:114831. doi: 10.1016/j.foodres.2024.114831. Epub 2024 Jul 22. Food Res Int. 2024. PMID: 39160040
-
Neuronal vulnerability of stroke-prone spontaneously hypertensive rats to ischemia and its prevention with antioxidants such as vitamin E.Neuroscience. 2010 Sep 29;170(1):1-7. doi: 10.1016/j.neuroscience.2010.07.013. Epub 2010 Jul 13. Neuroscience. 2010. PMID: 20633610 Review.
-
Pathological alterations of astrocytes in stroke-prone spontaneously hypertensive rats under ischemic conditions.Neurochem Int. 2012 Jan;60(1):91-8. doi: 10.1016/j.neuint.2011.11.002. Epub 2011 Nov 15. Neurochem Int. 2012. PMID: 22100568 Review.
Cited by
-
A time-resolved multi-omics atlas of transcriptional regulation in response to high-altitude hypoxia across whole-body tissues.Nat Commun. 2024 May 10;15(1):3970. doi: 10.1038/s41467-024-48261-w. Nat Commun. 2024. PMID: 38730227 Free PMC article.
-
Integrated bioinformatics and experimental validation identify ATF3 as a key gene in secondary brain damage after intracerebral hemorrhage.PLoS One. 2025 Jul 18;20(7):e0328530. doi: 10.1371/journal.pone.0328530. eCollection 2025. PLoS One. 2025. PMID: 40680001 Free PMC article.
-
A memory-improving dipeptide, Tyr-Pro, can reach the mouse brain after oral administration.Sci Rep. 2023 Oct 7;13(1):16908. doi: 10.1038/s41598-023-44161-z. Sci Rep. 2023. PMID: 37805661 Free PMC article.
-
Pharmaceutical Potential of Casein-Derived Tripeptide Met-Lys-Pro: Improvement in Cognitive Impairments and Suppression of Inflammation in APP/PS1 Mice.J Alzheimers Dis. 2022;89(3):835-848. doi: 10.3233/JAD-220192. J Alzheimers Dis. 2022. PMID: 35964178 Free PMC article.
-
Safety evaluation of high-dose intake of casein-derived peptide Met-Lys-Pro in healthy adults: A randomized, double-blind, placebo-controlled trial.Food Sci Nutr. 2020 Nov 23;9(2):662-671. doi: 10.1002/fsn3.2028. eCollection 2021 Feb. Food Sci Nutr. 2020. PMID: 33598151 Free PMC article.
References
LinkOut - more resources
Full Text Sources
Miscellaneous