

Physical Activity Protects the Pathological Alterations of Alzheimer's Disease Kidneys via the Activation of PACAP and BMP Signaling Pathways
- PMID: 32922265
- PMCID: PMC7457084
- DOI: 10.3389/fncel.2020.00243
Physical Activity Protects the Pathological Alterations of Alzheimer's Disease Kidneys via the Activation of PACAP and BMP Signaling Pathways
Abstract
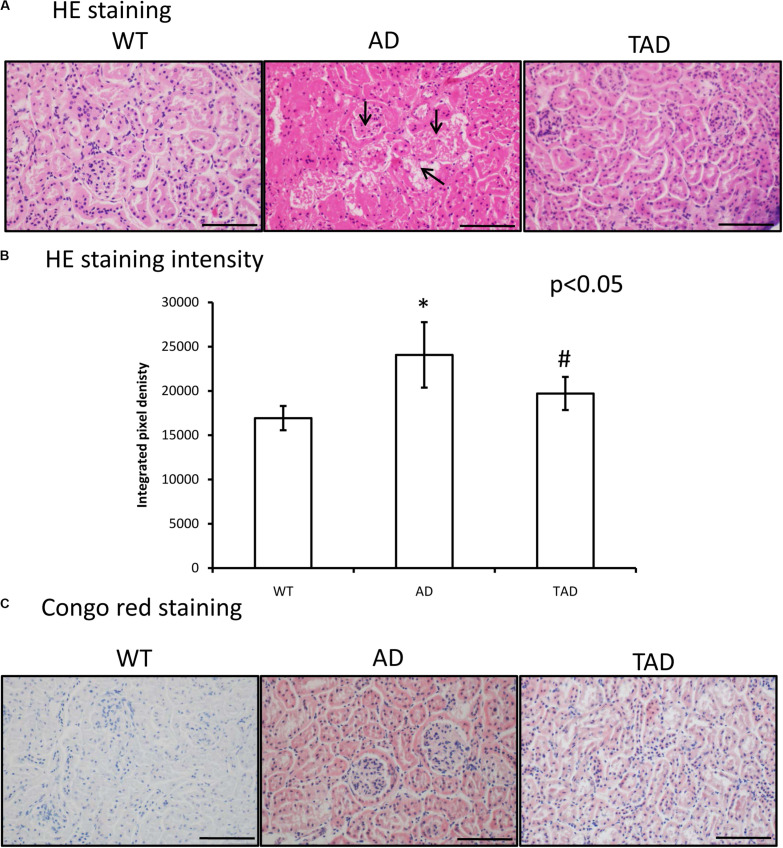
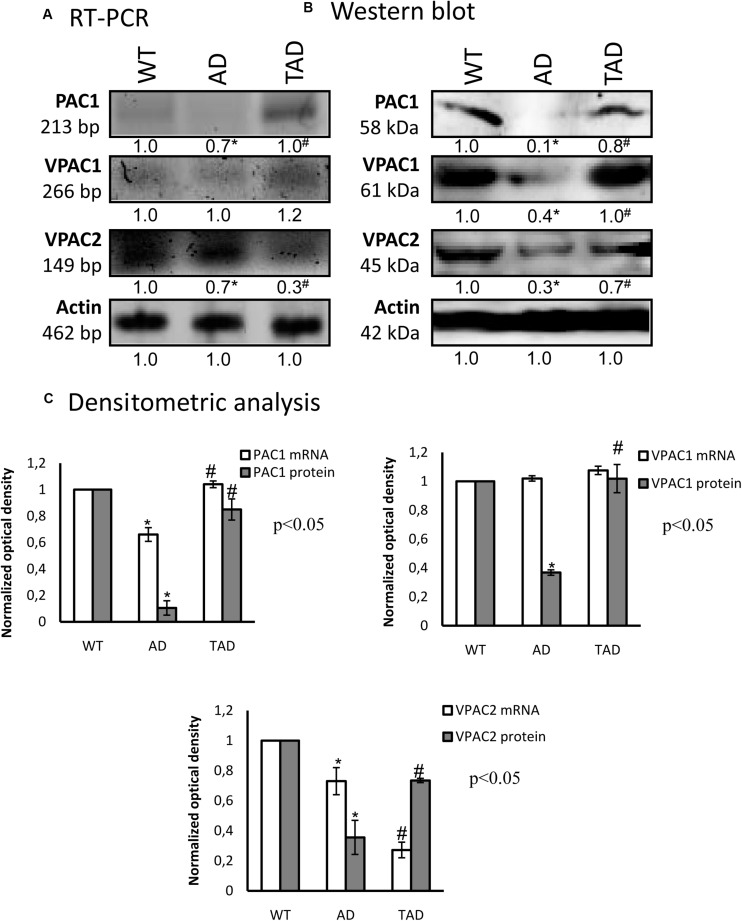
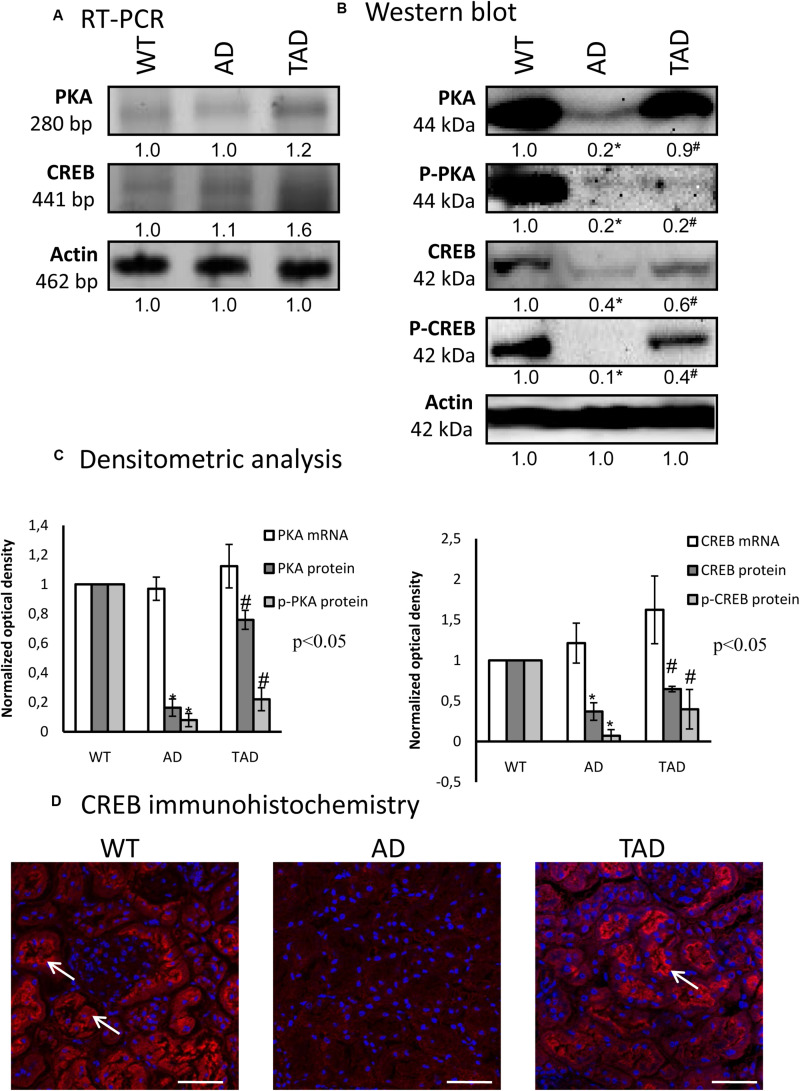
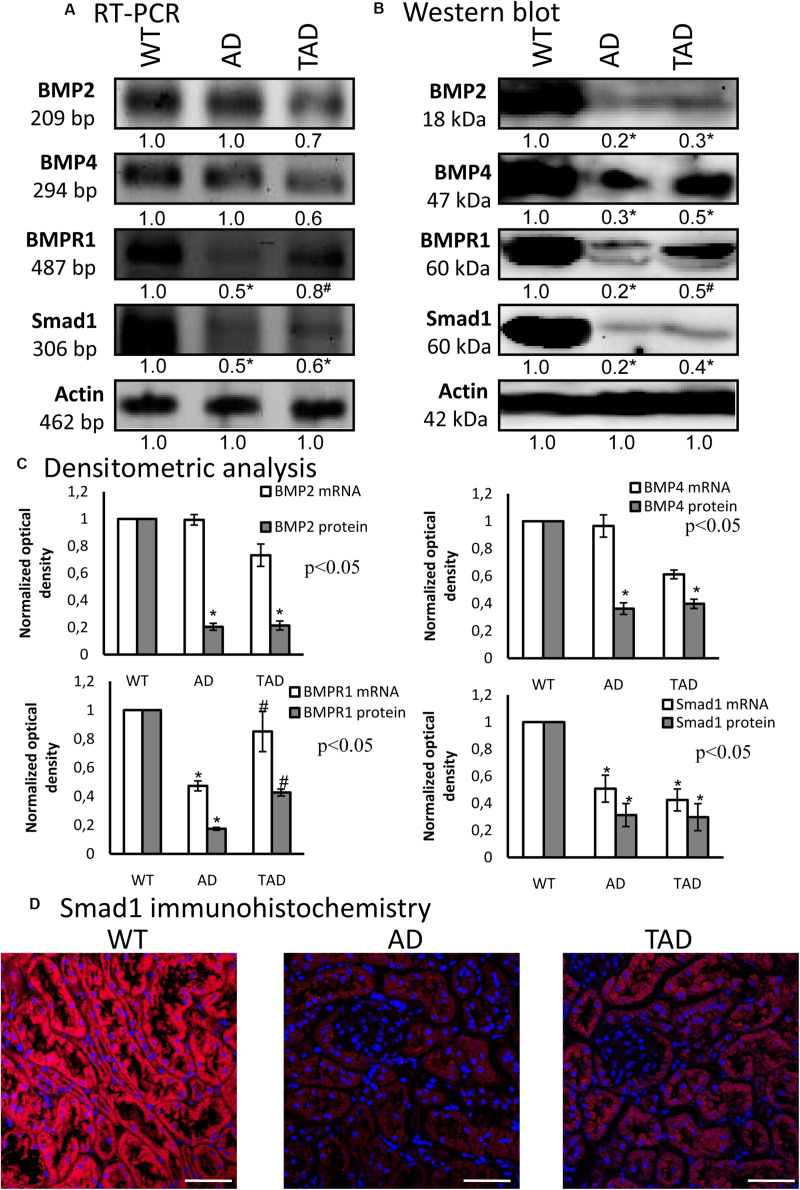
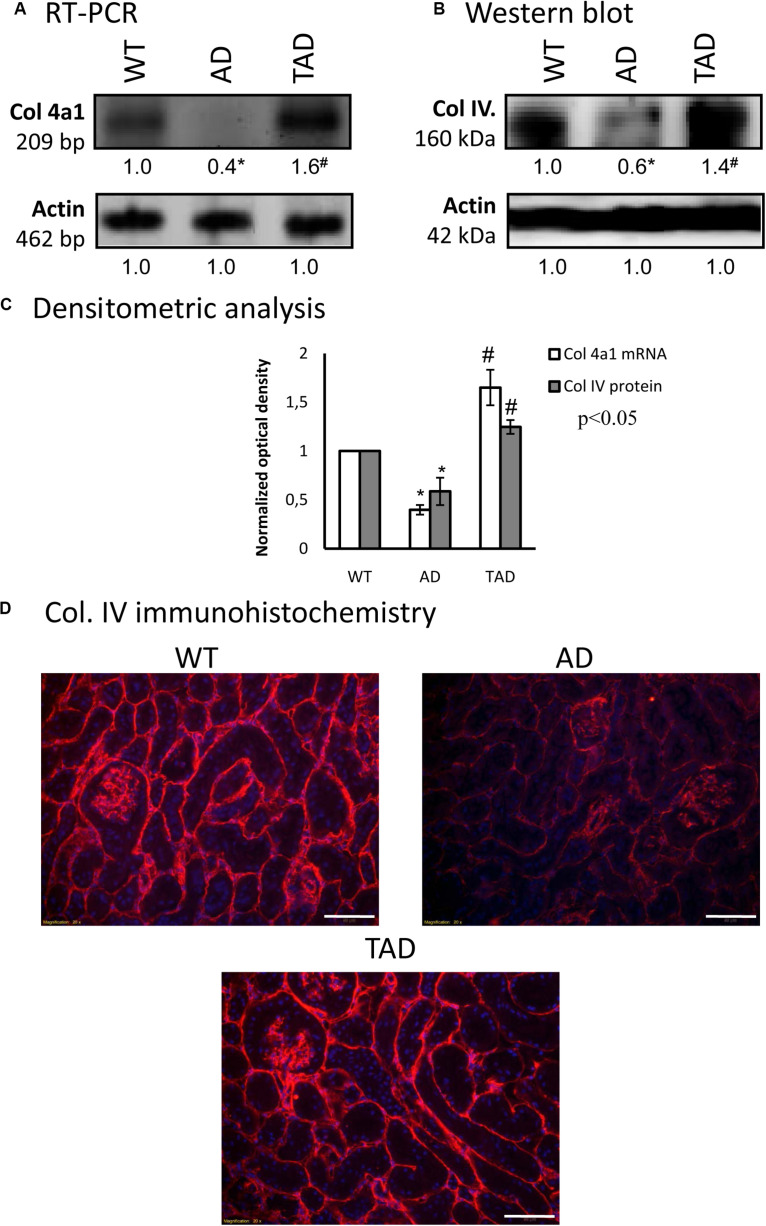
Alzheimer's disease (AD) is a neurodegenerative disorder with typical amyloid beta (Aβ) aggregations. Elimination of the Aβ precursors via the kidneys makes the organ a potential factor in the systemic degeneration leading to AD. Pituitary adenylate cyclase-activating polypeptide (PACAP) exerts neuroprotective effects in AD and plays a protective role in kidney pathologies. Increased physical activity is preventive of the formation of AD, but its detailed mechanism and possible connections with PACAP have not been clarified. In the kidneys of AD mice, the effects of physical activity were investigated by comparing wild-type and AD organs. Aβ plaque formation was reduced in AD kidneys after increased training (TAD). Mechanotransduction elevated PACAP receptor expression in TAD mice and normalized the protein kinase A (PKA)-mediated pathways. BMP4/BMPR1 elevation activated Smad1 expression and normalized collagen type IV in TAD animals. In conclusion, our data suggest that elevated physical activity can prevent the AD-induced pathological changes in the kidneys via, at least in part, the activation of PACAP-BMP signaling crosstalk.
Keywords: Alzheimer’s disease; BMP signaling; PACAP; collagen type IV; physical activity.
Copyright © 2020 Perényi, Szegeczki, Horváth, Hinnah, Tamás, Radák, Ábrahám, Zákány, Reglodi and Juhász.
Figures
Similar articles
-
Physical Training Inhibits the Fibrosis Formation in Alzheimer's Disease Kidney Influencing the TGFβ Signaling Pathways.J Alzheimers Dis. 2021;81(3):1195-1209. doi: 10.3233/JAD-201206. J Alzheimers Dis. 2021. PMID: 33896841 Free PMC article.
-
Alzheimer's Disease Mouse as a Model of Testis Degeneration.Int J Mol Sci. 2020 Aug 10;21(16):5726. doi: 10.3390/ijms21165726. Int J Mol Sci. 2020. PMID: 32785075 Free PMC article.
-
Pituitary adenylate cyclase-activating polypeptide protects against β-amyloid toxicity.Neurobiol Aging. 2014 Sep;35(9):2064-71. doi: 10.1016/j.neurobiolaging.2014.03.022. Epub 2014 Mar 22. Neurobiol Aging. 2014. PMID: 24726470
-
Therapeutic potential of PACAP for neurodegenerative diseases.Cell Mol Biol Lett. 2015 Jun;20(2):265-78. doi: 10.1515/cmble-2015-0008. Cell Mol Biol Lett. 2015. PMID: 26204407 Review.
-
[Physiological significance of pituitary adenylate cyclase-activating polypeptide (PACAP) in the nervous system].Yakugaku Zasshi. 2002 Dec;122(12):1109-21. doi: 10.1248/yakushi.122.1109. Yakugaku Zasshi. 2002. PMID: 12510388 Review. Japanese.
Cited by
-
Physical Training Inhibits the Fibrosis Formation in Alzheimer's Disease Kidney Influencing the TGFβ Signaling Pathways.J Alzheimers Dis. 2021;81(3):1195-1209. doi: 10.3233/JAD-201206. J Alzheimers Dis. 2021. PMID: 33896841 Free PMC article.
-
Protective Effects of PACAP in a Rat Model of Diabetic Neuropathy.Int J Mol Sci. 2021 Oct 2;22(19):10691. doi: 10.3390/ijms221910691. Int J Mol Sci. 2021. PMID: 34639032 Free PMC article.
-
The Systemic Effects of Exercise on the Systemic Effects of Alzheimer's Disease.Antioxidants (Basel). 2022 May 23;11(5):1028. doi: 10.3390/antiox11051028. Antioxidants (Basel). 2022. PMID: 35624892 Free PMC article. Review.
-
Neuropathology and neuroinflammation in Alzheimer's disease via bidirectional lung-brain axis.Front Aging Neurosci. 2024 Aug 30;16:1449575. doi: 10.3389/fnagi.2024.1449575. eCollection 2024. Front Aging Neurosci. 2024. PMID: 39280699 Free PMC article. Review.
-
Obesity, Osteoarthritis, and Myokines: Balancing Weight Management Strategies, Myokine Regulation, and Muscle Health.Nutrients. 2024 Dec 7;16(23):4231. doi: 10.3390/nu16234231. Nutrients. 2024. PMID: 39683624 Free PMC article. Review.
References
LinkOut - more resources
Full Text Sources
Molecular Biology Databases