. 2020 Aug 14:14:49.
doi: 10.3389/fnana.2020.00049. eCollection 2020.

Distribution of GFAP in Squamata: Extended Immunonegative Areas, Astrocytes, High Diversity, and Their Bearing on Evolution

Affiliations

Distribution of GFAP in Squamata: Extended Immunonegative Areas, Astrocytes, High Diversity, and Their Bearing on Evolution

Dávid Lõrincz et al. Front Neuroanat. .

Abstract

Squamata is one of the richest and most diverse extant groups. The present study investigates the glial fibrillary acidic protein (GFAP)-immunopositive elements of five lizard and three snake species; each represents a different family. The study continues our former studies on bird, turtle, and caiman brains. Although several studies have been published on lizards, they usually only investigated one species. Almost no data are available on snakes. The animals were transcardially perfused. Immunoperoxidase reactions were performed with a mouse monoclonal anti-GFAP (Novocastra). The original radial ependymoglia is enmeshed by secondary, non-radial processes almost beyond recognition in several brain areas like in other reptiles. Astrocytes occur but only as complementary elements like in caiman but unlike in turtles, where astrocytes are absent. In most species, extended areas are free of GFAP-a meaningful difference from other reptiles. The predominance of astrocytes and the presence of areas free of GFAP immunopositivity are characteristic of birds and mammals; therefore, they must be apomorphic features of Squamata, which appeared independently from the evolution of avian glia. However, these features show a high diversity; in some lizards, they are even absent. There was no principal difference between the glial structures of snakes and lizards. In conclusion, the glial structure of Squamata seems to be the most apomorphic one among reptiles. The high diversity suggests that its evolution is still intense. The comparison of identical brain areas with different GFAP contents in different species may promote understanding the role of GFAP in neuronal networks. Our findings are in accordance with the supposal based on our previous studies that the GFAP-free areas expand during evolution.

Keywords: brain evolution; glial fibrillary acidic protein (GFAP); lizards; snakes; turtles.


Figures

FIGURE 1
FIGURE 1
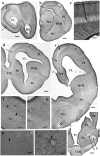
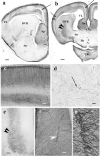
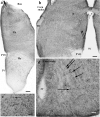
GFAP-immunopositive elements in gecko telencephalon and anterior hypothalamus—a GFAP-rich lizard brain. 3V, third ventricle; BO, olfactory bulb; ChO, optic chiasma; CPa, pallial commissure; DVR, dorsal ventricular ridge; FIV, interventricular foramen; GFAP, glial fibrillary acidic protein; Hp, hippocampus; Hy, hypothalamus; PL, lateral pallium; Sp, septum; Spa, septum, anterior nuclei; Spd, septum, dorsal nuclei; Str, striatum; Th, thalamus; VL, lateral ventricle. (a) At the frontal pole of the lateral ventricle. Note the trilaminar structure of pallium (arrow points to the middle light zone here and in the following panels). Scale bar: 240 μm. (b) Through the septum (here: its anterior nucleus, note the thickening), in front of the pallial commissure. The radial pattern is masked by processes of other orientations except the separate area around the asterisk (dorsal pallium magnocellular part). Scale bar: 250 μm. (c) The trilaminar arrangement enlarged. In the middle layer (arrow), the radial processes are relatively loose; deep and superficial layers: the processes are densely packed. Scale bar: 100 μm. (d) At the pallial commissure. The structure is similar to that seen in panels (a,b). Scale bar: 250 μm. (e) Through the interventricular foramen; double arrow: optic recess. Scale bar: 250 μm. (f) The area marked with asterisk in panels (b,d,e) (dorsal pallium, magnocellular part) contains a radial process system different from the more complex glial mesh of the surrounding areas (double asterisk). Note the bordering glial plexus (arrowheads). Scale bar: 50 μm. (g) A detail of striatum: radial ependymoglia. Scale bar: 60 μm. (h) A detail of the DVR. Complex glial system, no radial orientation is recognizable. Note the perivascular processes (arrowhead). Scale bar: 60 μm. (i) Perivascular glia (arrowhead). Scale bar: 12 μm. (j) The anterior part of the hypothalamus. The optic chiasm and the medial and lateral forebrain bundles (arrows with circles) are lighter due to the scarce glial elements. Scale bar: 250 μm.
FIGURE 2
FIGURE 2
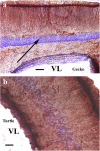
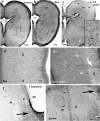
Nissl cresyl violet counterstaining on the dorsomedial pallium. (a) Gecko: the light GFAP-poor middle layer (arrow) is full of densely packed neurons. A Nissl cresyl violet counterstaining. (b) Turtle (Mauremys sinensis) pallium: the glial structure is not trilaminar, and the cell bodies are less densely packed. GFAP, glial fibrillary acidic protein; VL, lateral ventricle. Scale bar: 100 μm.
FIGURE 3
FIGURE 3
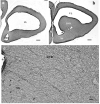
The telencephalon of the monitor lizard is also rich in GFAP immunopositivity. BO, olfactory bulb; DVR, dorsal ventricular ridge; GFAP, glial fibrillary acidic protein; Sp, septum; Str, striatum; VL, lateral ventricle. (a,b) Monitor lizard, rostral and cranial sections of the telencephalon both are rich in GFAP. Note the trilaminar pallium (arrows) and the main vessel of DVR (arrowhead). Asterisk labels sulcus ventralis. Scale bar: 800 μm. (c) Adjacent parts of DVR and striatum enlarged. The radial arrangement (arrowheads) of glial processes is recognizable in the striatum but hardly in the DVR where it is masked by non-radial processes. Asterisk labels sulcus ventralis, like in panel (b). Scale bar: 30 μm.
FIGURE 4
FIGURE 4
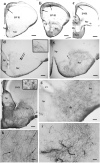
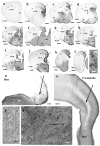
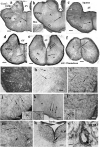
GFAP-immunopositive elements in agama telencephalon—a GFAP-poor brain. ChO, optic chiasma; CPa, pallial commissure; DVR, dorsal ventricular ridge; GFAP, glial fibrillary acidic protein; Hy, hypothalamus; Sp, septum; Str, striatum; VL, lateral ventricle. (a–c) Surveys on whole telencephalic hemispheres-in rostrocaudal order. Note the GFAP-rich areas confined but modestly increasing caudalward. The DVR and the anterior part of the hypothalamus remain almost free of GFAP. In the medial and mediodorsal pallia, a trilaminar pattern is found (arrows). In the dorsal pallium, it is not recognizable; the lateral pallium is almost devoid of GFAP. Scale bars: 300, 400, and 600 μm. (d–f) The septum and striatum enlarged as areas containing GFAP-immunopositive structures. (d) An area enlarged similar to that seen in panel (a). The septum is penetrated by radial glial processes. In the striatum, the radial processes (double arrow, see enlarged in the inset) have been curved due to the uneven thickening of the striatal brain wall. Scale bar: 100 μm. (e) An area enlarged, its position is between panels (a,b). The septum is basally penetrated by transversal processes; GFAP immunopositivity also colorizes the glia in the striatum. Scale bar: 100 μm. (f) An area enlarged similar to that seen in panel (b). The GFAP immunopositivity is quite intense in the septum and striatum, whereas in the DVR, no GFAP is visible. Inset: septal astrocytes. Scale bar: 100 μm. (g) Astrocytes and radial glial processes are intermingled around the asterisk in the nucleus accumbens. See enlarged in panel (h). Scale bar: 40 μm. (h) Astrocytes (arrows) enlarged among radial processes in the nucleus accumbens. Scale bar: 20 μm. (i) Corresponding to the amygdala “irregular” sinuous processes are found. Scale bar: 50 μm.
FIGURE 5
FIGURE 5
The telencephalon of the chameleon is also poor in GFAP immunopositivity. CPa, pallial commissure; DVR, dorsal ventricular ridge; GFAP, glial fibrillary acidic protein; Hy, hypothalamus; RO, optic recess; Sp, septum; Str, striatum; VL, lateral ventricle. (a–c) Rostrocaudal series of sections from the chameleon. The GFAP immunopositivity which visualizes a trilaminar glial pattern is only recognizable in the medial pallium (arrow). The septum is rich in GFAP immunopositivity. The striatum is penetrated by arching long processes (double arrow, see enlarged as inset). The preoptic hypothalamus is covered by GFAP-immunopositive astrocytes. Arrowheads mark the compressed lateral ventricle between DVR and the dorsal pallium. Scale bar: 500 μm. (d) Enlarged part of the medial side of the chameleon telencephalon. Note the trilaminar pattern in the medial pallium (arrow) and the GFAP-rich parts of the septum and (preoptic) hypothalamus. Scale bar: 300 μm. (e) Pallial commissure of the chameleon. Note the glial processes parallel with the axons. Scale bar: 100 μm. (f) Astrocytes from the chameleon septum. Scale bar: 20 μm. (g) Astrocytes from the chameleon hypothalamus. Scale bar: 20 μm.
FIGURE 6
FIGURE 6
Timon telencephalon represents an intermediate extension of GFAP immunopositivity. 3V, third ventricle; ChO, optic chiasma; CPa, pallial commissure; DVR, dorsal ventricular ridge; GFAP, glial fibrillary acidic protein; Hy, hypothalamus; PL, lateral pallium; Sp, septum; Str, striatum; VL, lateral ventricle. (a,b) Timon telencephalon in front of and through the pallial commissure. The GFAP-poor middle zone (arrows) also appears in the lateral pallium. The septum is rich in GFAP. The radial pattern is masked by non-radial processes. From the striatum, a GFAP-immunopositive zone (double arrowhead) extends to the middle of the DVR, which is otherwise poor of GFAP immunopositivity. The hypothalamus is almost free of GFAP. Below it, the slit is an artifact. Double arrow: arched radial glial processes at the border of the striatum. Scale bars: 200 and 300 μm. (c) A part of the pallium enlarged. Note that in this species, the glial processes are not arranged radially in the lowest layer. Scale bar: 100 μm. (d) In most of the DVR, the presence of GFAP-immunopositive processes (arrow) is only recognizable under high-power objective. Scale bar: 10 μm. (e) The GFAP-rich central zone of the DVR (double arrowhead) enlarged. Scale bar: 100 μm. (f) Timon septum. The radial process system is enmeshed by other processes and hardly recognizable. Arrowhead: vessel. Scale bar: 70 μm. (g) Perivascular end-feet around a vessel enlarged from the previous panel. Scale bar: 10 μm.
FIGURE 7
FIGURE 7
Snakes (Corn, corn snake, Pyth, python)—intermediate distribution of GFAP immunopositivity, only few interspecific differences in the telencephalon. CPa, pallial commissure; DVR, dorsal ventricular ridge; FIV, interventrivular foramen; GFAP, glial fibrillary acidic protein; Hy, hypothalamus; PL, lateral pallium; Sp, septum; Spd, septum, dorsal nuclei; Str, striatum. (a–l) Telencephalic sections in rostrocaudal order: the territory of GFAP immunopositivity gradually extends but less in boa and python than in corn snake. Scale bar: 800 μm. (a) No GFAP was found in the most rostral sections in either species (here: corn snake). Arrowheads here and in panels (b–l) point to the compressed lateral ventricle between the DVR and dorsal pallium. (b) GFAP appears first in the mediodorsal pallium and the adjacent part of the septum in either species (here: corn snake). The trilaminar pattern is hardly recognizable [arrow; it points to the similar details in (c–l)]. (c) The GFAP-immunopositive area extends into the striatum, DVR, lateral pallium, and septum in the corn snake. Arrow here and panels (d–l): the middle layer of the pallium. Asterisks emphasize the difference from boa (d). (d) The process is less extensive in boa [in (d), note asterisks] and python (not shown). (e–g) Sections at the pallial commissure from boa, corn snake, and python, respectively. Lines at the ventral sulcus of the DVR help to compare the extension of GFAP-immunopositive areas. The preoptic hypothalamus is rich in GFAP-immunopositive elements. (h,i) Sections at the interventricular foramen. The striatum is only GFAP-immunopositive in corn snake (i) but not in python (h) and boa (not shown). Lines: see legends of panels (e–g). (j) Section from python at the interventricular foramen but caudal from the levels of sections shown in panels (h,i). The preoptic hypothalamus is rich in GFAP immunopositivity but not the striatum. At this level, the trilaminar structure is visible in the medial pallium (arrow). (k,l) Sections posterior to the interventricular foramen. Arrowhead points to the artifact rupture of the brain wall where telencephalon was separated from the diencephalon. The level of panel (k) (corn snake) is a little rostral to that of panel (l) (boa). The trilaminar structure of pallium is visible (arrow). (m) Perivascular glial end-feet. Scale bar: 10 μm. (n) Enlarged part of the medial pallium (boa) has scarce GFAP-immunopositive processes, the laminar structure is hard to be recognized (arrow). The adjacent part of the septum (Sp) is richly penetrated by GFAP-immunopositive processes. Scale bar: 120 μm. (o) The trilaminar structure (arrow: the middle layer) of the medial pallium in corn snake from a caudal section like in panel (j). It ceases in the dorsal septal nuclei. Scale bar: 120 μm. (p) Complex system of processes in different directions (corn snake). Radial glia are not recognizable. Similar glial structure is found in the low-power pictures of panels (c–j). Scale bar: 10 μm. (q) Astrocytes (arrows) and long processes (arrowheads) in the root of the septum (corn snake). Scale bar: 20 μm.
FIGURE 8
FIGURE 8
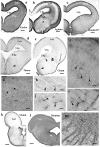
Lizards, diencephalon. 3V, third ventricle; CP, posterior commissure; EM, median eminence; FIV, interventricular foramen; GFAP, glial fibrillary acidic protein; Hb, habenula; Hy, hypothalamus; TeO, optic tectum; Th, thalamus; TO, optic tract. (a) Agama, behind the optic chiasm. The thalamus and hypothalamus are penetrated by radial processes, but the former one is relatively poor in GFAP. Arrow and arrowhead point to the lateral prosencephalic fascicle and the radial processes curved by it. Scale bar: 300 μm. (b) Timon, at a similar level. The glia formed by radial processes, GFAP-immunopositive zones alternate with GFAP-poor zones. Arrow and arrowhead point to the lateral prosencephalic fascicle and the radial processes curved by it. Scale bar: 250 μm. (c) Enlarged part of Timon diencephalon, the dense zone beside the optic tract with astrocytes (arrows). The radial glial processes penetrate the optic tract (double arrow). Scale bar: 80 μm. (d) Timon, enlarged detail of the optic tract. There are glial processes in parallel with the optic fibers (arrows) crossed by the radial glia (double arrow) Scale bar: 15 μm. (e–h) Cross sections at the posterior commissure. (e) Agama, the GFAP immunopositivity is confined to a few areas (arrowheads). Asterisk and double asterisk mark the GFAP-free areas of the thalamus and hypothalamus. The median eminence is penetrated by slightly arched glial processes (see enlarged in inset). The arrow points to the GFAP-free subcommissural organ. Scale bar: 550 μm. (f) Chameleon, almost free of GFAP except for the median eminence where astrocytes are also found. Inset: radial processes (double arrowhead) and astrocytes (arrowhead) in the median eminence. Scale bar: 400 μm. (g,h) Timon and monitor lizard had much more GFAP immunopositivity than the other two species. Scale bars: 450 and 600 μm.
FIGURE 9
FIGURE 9
Lizard, mesencephalon (Cham, chameleon). G, W, gray and white matters; GFAP, glial fibrillary acidic protein; TeO, optic tectum; TSc, torus semicircularis; VTe, tectal ventricle. (a) Gecko, densely packed GFAP-immunopositive radial processes in the optic tectum. The tegmentum and torus semicircularis display a dense GFAP immunopositivity. Scale bar: 400 μm. (b) Agama, the GFAP immunopositivity is confined to the superficial and deep layers in the tectum. The torus and tegmentum are less intensely immunopositive than those in the gecko. The tegmentum has a loose system of radial processes (arrowhead, see enlarged in panel h). Scale bar: 1,500 μm. (c) Monitor lizard, also intensely GFAP-immunopositive with a lighter middle layer. Scale bar: 1,500 μm. (d) Timon, poor GFAP immunopositivity; relatively more is visible in the outer zone of the tectum and both sides of the midline in the tegmentum, where radial fibers are recognizable (arrowhead). Scale bar: 320 μm. (e) Chameleon, very poor in GFAP-immunopositive structures. There are a few groups of astrocytes (arrow, arrowheads). Scale bar: 320 μm. (f) A detail of the Timon optic tectum seen in panel (d). The radial processes are recognizable in the superficial zone (asterisk) but less in the deep ones (double asterisk), where astrocyte-like figures are visible (arrowheads). Scale bar: 50 μm. (g) A detail of the torus semicircularis of gecko. Along the ventricle (asterisk) radial processes originate. Most of the territory (double asterisk) is occupied by irregular, sinuous processes. Arrowheads: astrocyte-like profiles. Scale bar: 50 μm. (h) Radial processes (arrowheads) enlarged from agama tegmentum. Scale bar: 10 μm. (i) Astrocytes from the chameleon; their position is pointed with a double arrowhead in panel (e). Scale bar: 20 μm. (j) Chameleon, long processes from astrocytes (arrowheads). Their area is labeled with the arrow in panel (e). Scale bar: 50 μm. (k) Chameleon, isthmus, the GFAP immunopositivity is confined (arrowhead). Scale bar: 450 μm. (l) Monitor lizard, isthmus, rich in GFAP immunopositivity. Arrowheads: the area enlarged in panel (m). Scale bar: 1,500 μm. (m) Detail of the isthmus of the monitor lizard. G, W: gray and white matters Scale bar: 100 μm.
FIGURE 10
FIGURE 10
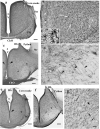
Snakes, diencephalon. 3V, third ventricle; ChO, optic chiasma; GFAP, glial fibrillary acidic protein; Hb, habenula; Str, striatum; TO, optic tract. (a) Corn snake, at the posterior edge of the optic chiasm. The whole diencephalon is GFAP-immunopositive. The striatum has been removed. Scale bar: 300 μm. (b) Enlarged part of corn snake diencephalon, the ependymal surface is to left. Arrowheads: radial glial processes, arrows: astrocytes; see enlarged in the inset. Scale bar: 80 μm. (c) Python at the optic chiasma. Ependymal origin of processes (arrowheads), complex plexus of tiny fibers (above the asterisks) and area of looser glial structure (below the asterisks). The striatum is free of GFAP immunopositivity. Scale bar: 300 μm. (d) Python diencephalon, the light area below the asterisks in panel (c) enlarged. Dense irregular (to left and up from the asterisks) and loose radially arranged processes (arrowheads). Scale bar: 50 μm. (e) Corn snake, posterior to the previous section; arrowheads: ependymal origin of radial glia, asterisk: a detail enlarged in panel (g). Scale bar: 300 μm. (f) Python, posterior to the previous section; the marks are identical to those in panel (c). Scale bar: 300 μm. (g) Corn snake, enlarged detail of panel (e); arrows: astrocytes, arrowheads: radial processes. Scale bar: 40 μm.
FIGURE 11
FIGURE 11
Snakes, pretectum. 3V, third ventricle; CP, posterior commissure; CPa, pallial commissure; DVR, dorsal ventricular ridge; GFAP, glial fibrillary acidic protein; Hy, hypothalamus; PVO, paraventricular organ; Th, thalamus. (a) Boa, the thalamus has a dense radial process system, whereas the hypothalamus has a loose one. The paraventricular organ is free of GFAP. Scale bar: 150 μm. (b) Corn snake, the dorsal part of the pretectum, asterisk marks the area with astrocytes enlarged in panel (c); double arrow: radially oriented processes. The subcommissural organ (bifurcating arrow) is free of GFAP as well as the paraventricular organ. Scale bar: 120 μm. (c) Corn snake, enlarged detail around the asterisk in panel (b), astrocytes (arrows). Scale bar: 50 μm. (d) Corn snake, radial processes (double arrow) and astrocytes (arrows) in the ventral part of the hypothalamus behind the median eminence. 3V, third ventricle. Scale bar: 30 μm.
FIGURE 12
FIGURE 12
Mesencephalon (snakes) and cerebellum (snakes and lizards). 4V, fourth ventricle; g, m, granular and molecular layers of the cerebellum; GFAP, glial fibrillary acidic protein; TeO, optic tectum; TSc, torus semicircularis; VTe, tectal ventricle. (a) Boa, radial processes are found both in the optic tectum and in the tegmentum (arrows). (b) Python, similar glial structure like in boa. (c) Corn snake, note the less intense immunostaining in the superficial zone of the optic tectum (asterisks); except for this zone, astrocytes (see also inset, arrowheads) predominate everywhere. Scale bars: 250 μm. (d–g) Cerebellum. Three types were distinguished: (d,e). Boa and corn snake. Dense Bergmann-like glial system, the molecular and granular layers are distinct mainly in the corn snake. In the corn snake, a large arrow points to the thick midline glial process system. Scale bar: 70 μm. (f) Chameleon. The cerebellum is almost free of GFAP-immunopositive processes, although the peduncle (arrow) is rich in them. The border between the molecular and granular layers is not recognizable. Scale bar: 100 μm. (g) Agama. The cerebellum is poor in GFAP-immunopositive perpendicular processes. A denser population is found only at the midline (arrow). The horizontal processes are therefore well recognizable (arrowheads). Scale bar: 70 μm.
FIGURE 13
FIGURE 13
Rhombencephalon. 4V, fourth ventricle; FLM, medial longitudinal bundle; GFAP, glial fibrillary acidic protein; NVSp, nucleus of the spinal tract of trigeminal nerve. (a–e) Cross sections of rhombencephalon: (a) corn snake; (b) boa; (c) agama; (d) chameleon; (e) chameleon, more caudalward. Even chameleon is quite rich in GFAP in this brain part. Double arrow: medial longitudinal fasciculus. The basic pattern is radial glia (arrowheads). Along the pial surface, there is denser and non-radial glia (double arrowhead). Asterisks: emerges of cranial nerves (VII, VIII), note the interfascicular glial septa; arrow: midline glial bundle, inset: enlarged radial processes pointed by the arrowheads. Scale bar: 250 μm. (f) Chameleon spinal cord. Dense, mainly radial glia (arrowhead). Arrow: central canal. Scale bar: 200 μm. (g) Detail of the nucleus of the spinal trigeminal tract. Very dense system of glial processes; the light holes (arrows) correspond to neurons. Scale bar: 50 μm. (h) Dense, less regular and loose, radial glia (arrows) populations. Enlarged detail labeled with double asterisk in panel (e). Scale bar: 50 μm. (i) Timon, astrocytes in the brain stem (arrows). Scale bar: 50 μm. (j) Python, astrocytes (arrows) with unusually long processes in the brain stem; see a cell enlarged in the inset. Scale bar: 50 μm. (k) Corn snake, astrocytes (arrows) in the ventromedial part of the brain stem; crossed arrow points to a cell enlarged in the inset. Arrowheads: processes in the midline glial bundle. Scale bar: 100 μm. (l) Corn snake, astrocytes in the ventrolateral part of the brain stem; arrow points to a cell enlarged in the inset. Scale bar: 50 μm. (m) A detail of the chameleon spinal cord. Radial glia (arrowheads) and astrocytes (arrows); double arrow: central canal. Scale bar: 100 μm. (n,o) The subtrochlear organ (arrow) in the turtle (Trachemys scripta elegans) brain stem. Scale bars: 150 and 30 μm.
FIGURE 14
FIGURE 14
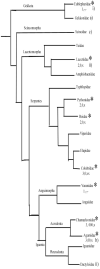
A simplified phylogenetic tree of Squamata. It has been constructed based on Wiens et al. (2012) and Pyron et al. (2013). It demonstrates the positions of groups whose representatives were studied by us (asterisks) and a few other important groups. (1–3) From our study: (1) Ancient-type plesiomorph glial structure according to our study. (2) Intermediate. (3) Most apomorphic glial structure. Astrocytes: –, none or minimal; x, in some confined areas; xx, predominant in large areas. Glial fibrillary acidic protein (GFAP)-poor or free areas: –, none; 0, medium; 00, 000, predominant. (a–c) Ancient, intermediate, and most apomorphic according to Ahboucha et al. (2003). i, ii, less and more advanced according to Lazzari and Franceschini (2001, , . (The Dactyloidae group is represented by Anolis sagrei Lazzari and Franceschini, 2005a).

Similar articles

Cited by

References

    1. Achúcarro N. (1915). De l’évulotion de la névroglie, et spécialement de ses relations avec 1′appareil vasculaire. Trab. Lab. Invest. Biol. 13 169–212.
    1. Adams R. H., Blackmon H., Reyes-Velasco J., Schield D. R., Card D. C., Andrew A. L., et al. (2016). Microsatellite landscape evolutionary dynamics across 450 million years of vertebrate genome evolution. Genome 59 295–310. 10.1139/gen-2015-0124 - DOI - PubMed
    1. Ahboucha S., Laalaqui A., Didier-Bazes M., Montange M., Cooper H. M., Gamrani H. (2003). Differential patterns of glial fibrillary acidic protein immunolabeling in the brain of adult lizards. J. Comp. Neurol. 464 159–171. 10.1002/cne.10781 - DOI - PubMed
    1. Anderova M., Benesova J., Mikesova M., Dzamba D., Honsa P., Kriska J., et al. (2014). Altered astrocytic swelling in the cortex of α-syntrophin-negative GFAP/EGFP MICE. PLoS One 9:0113444. 10.1371/journal.pone.0113444 - DOI - PMC - PubMed
    1. Appel B. (2013). “Nonmammalian vertebrate glia,” in Neuroglia, 3rd Edn, eds Kettenmann H., Ransom B. R. (New York, NY: Oxford University Press; ), 24–34. 10.1093/med/9780199794591.003.0003 - DOI