. 2020 Aug 13:11:1921.
doi: 10.3389/fmicb.2020.01921. eCollection 2020.

The Role of Testosterone and Gibberellic Acid in the Melanization of Cryptococcus neoformans

Affiliations

The Role of Testosterone and Gibberellic Acid in the Melanization of Cryptococcus neoformans

Jamila S Tucker et al. Front Microbiol. .

Abstract

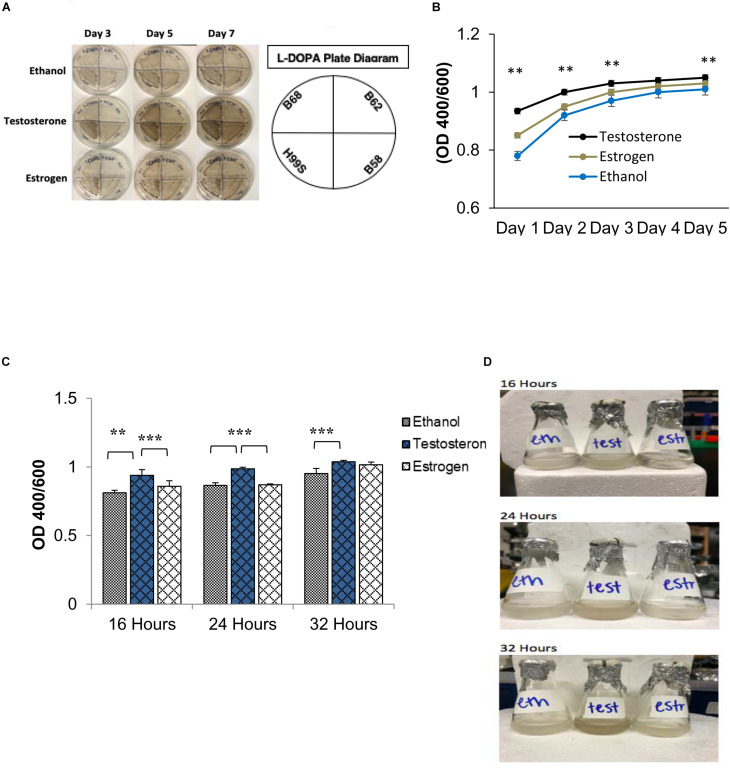
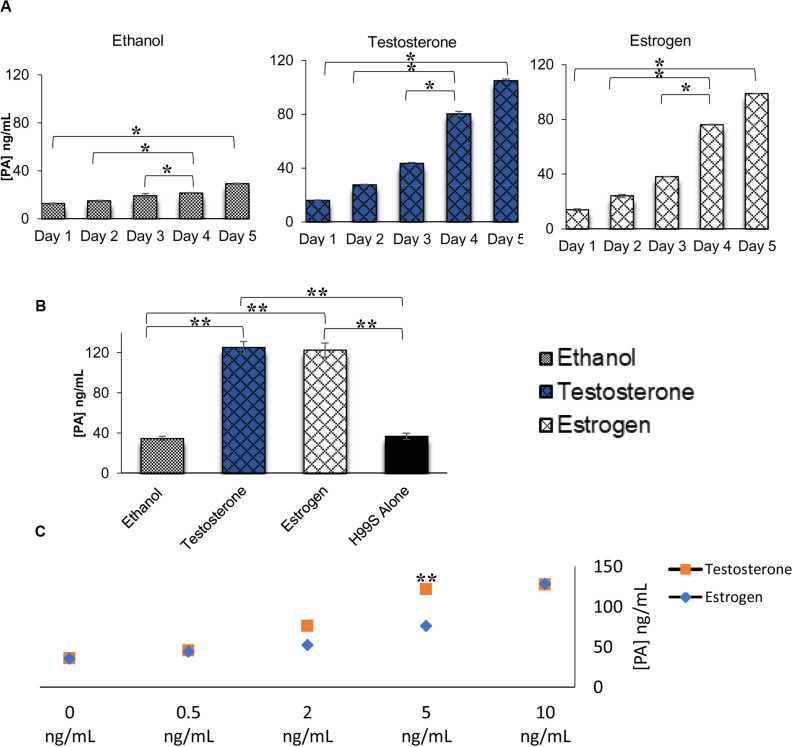
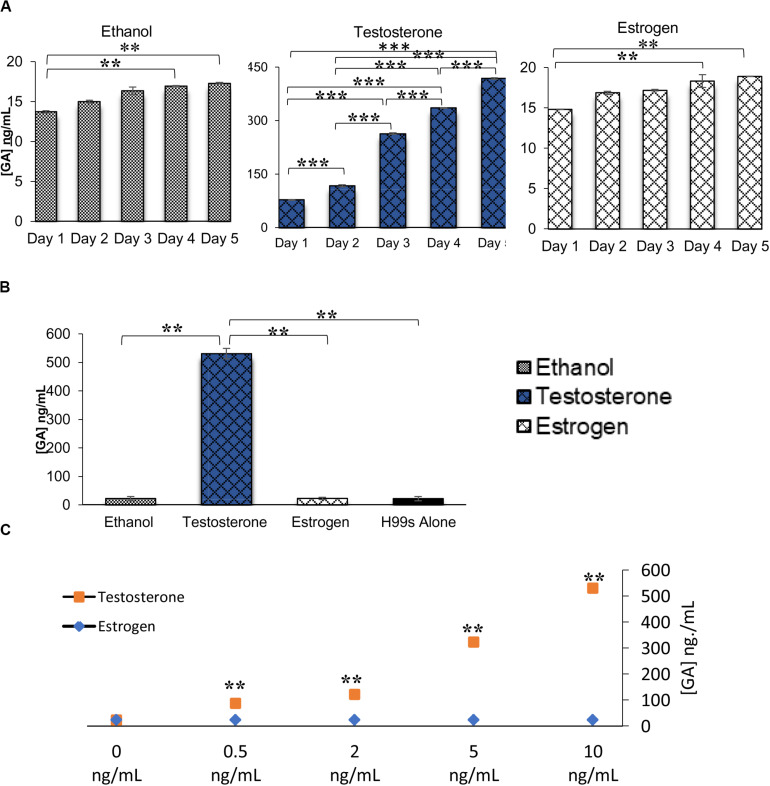
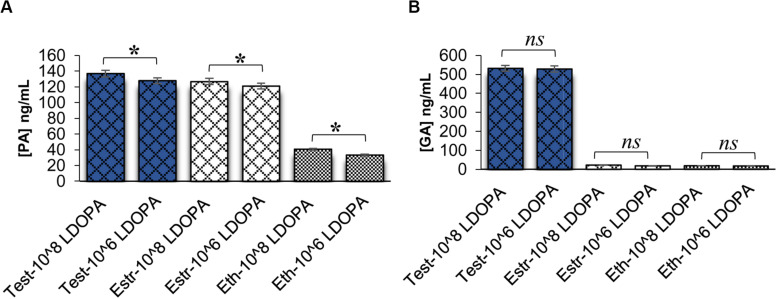
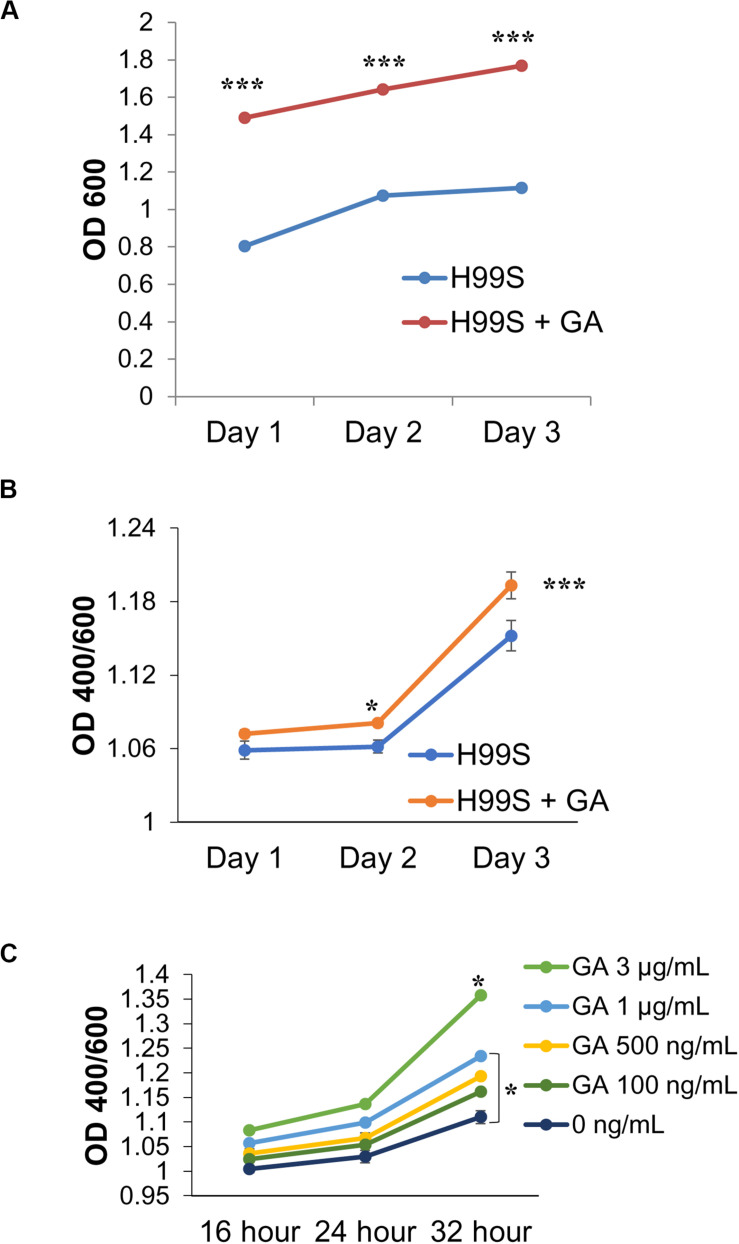
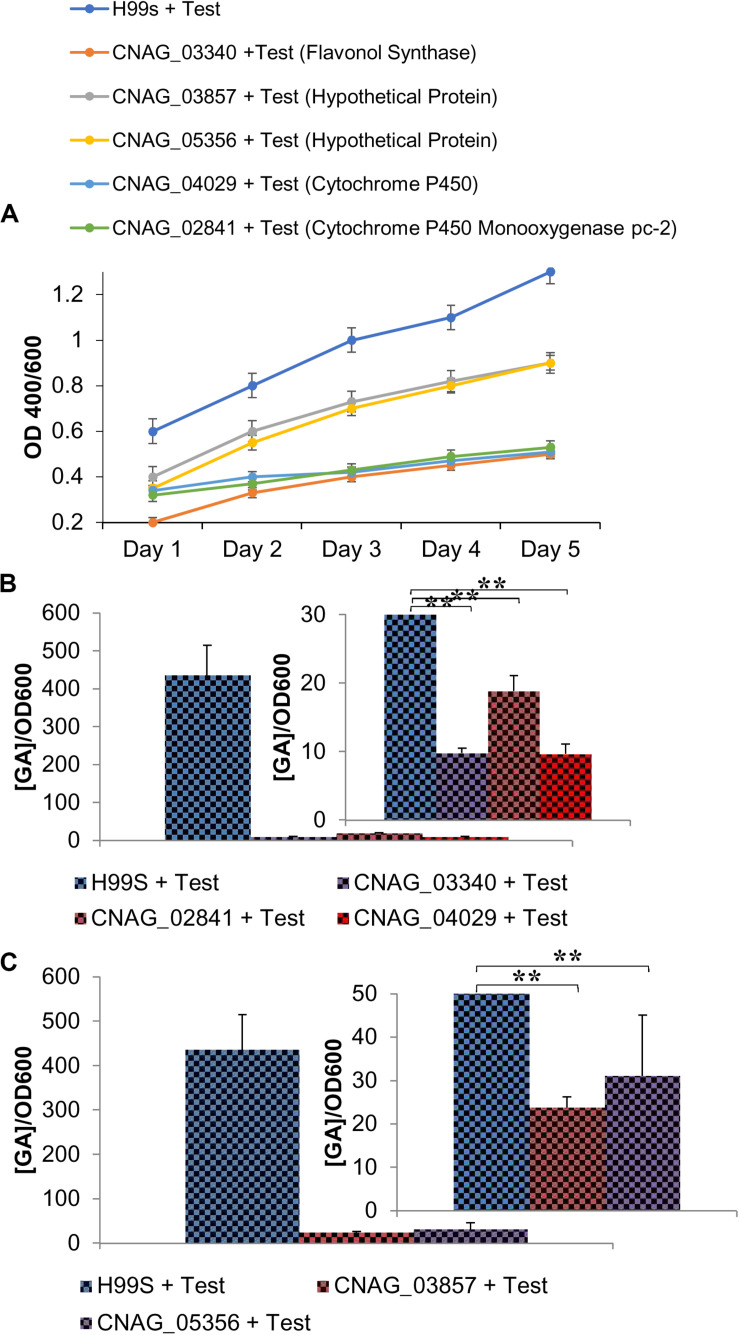
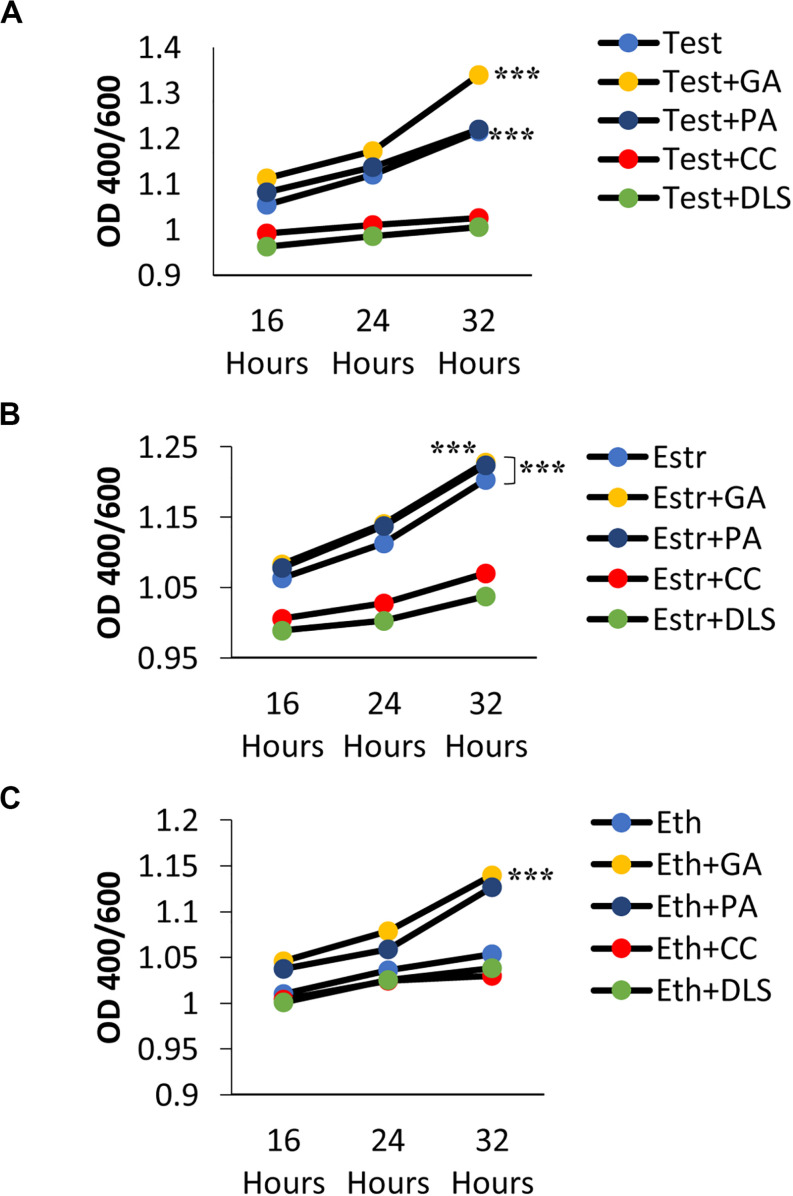
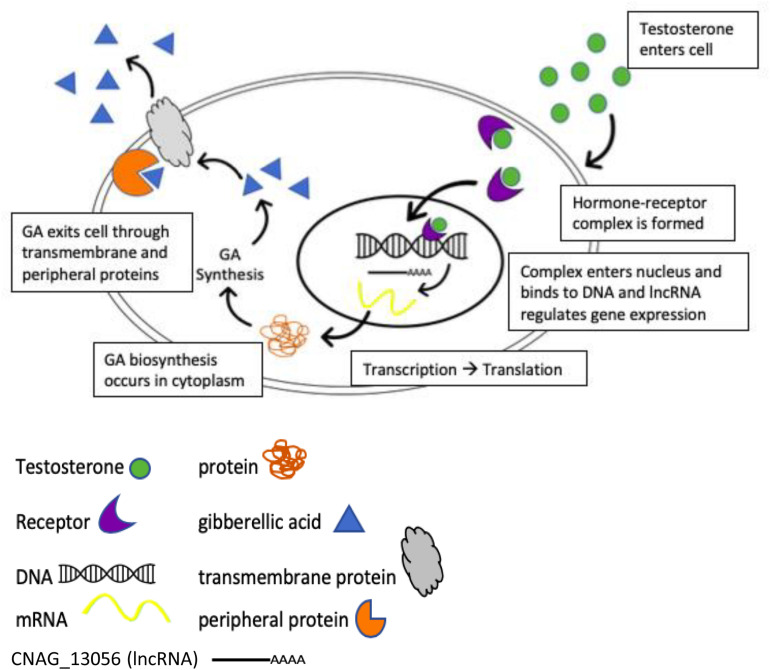
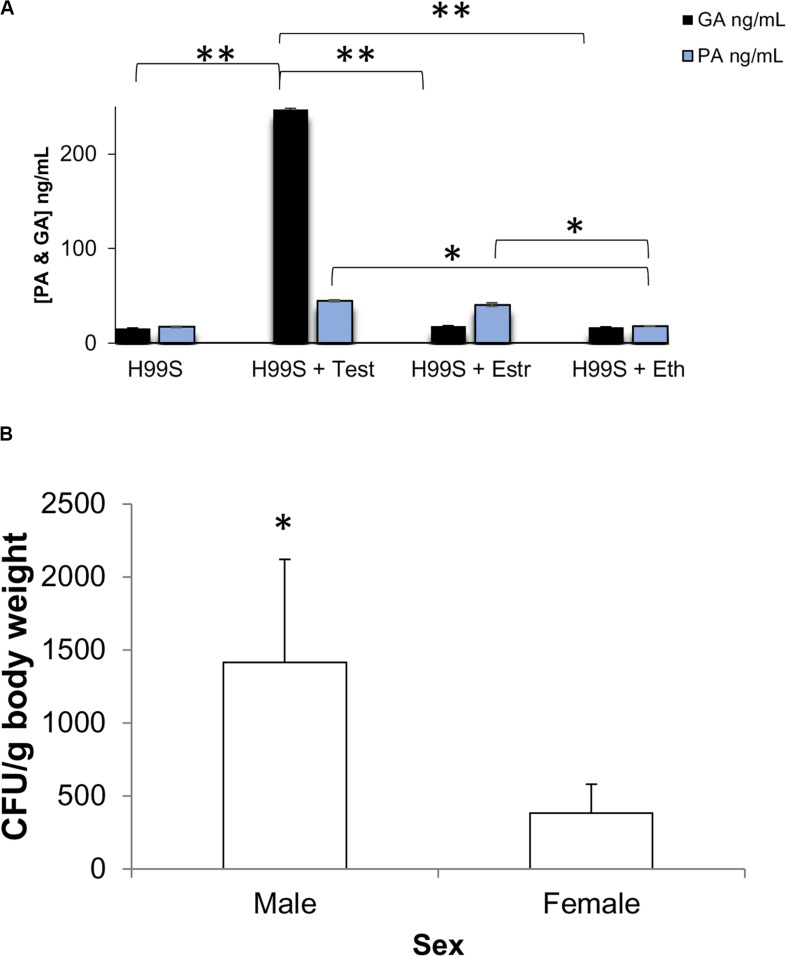
Cryptococcus neoformans, a spore-producing pathogenic yeast, affects immunocompromised individuals causing meningoencephalitis. Once C. neoformans is introduced via the respiratory tract, it is engulfed by macrophages and other phagocytes. One of C. neoformans's primary virulence factors is the pigment melanin, which is formed in the cell wall and protects the yeast against UV radiation and oxidizing agents produced by macrophages during phagocytosis. To better understand the observed sex bias (3:1; male:female) in C. neoformans infections, the phenotype of various virulence factors was determined in the presence of exogenous sex hormones. C. neoformans melanized faster in the presence of testosterone than it did in the presence of estradiol. Using a combination of RNA sequencing analysis and ELISA results, we identified a growth hormone, gibberellic acid (GA), produced in C. neoformans that was highly upregulated in the presence of testosterone. A variety of knockout strains of genes involved in the GA biosynthesis pathway showed significantly reduced melanization in the presence of testosterone. Additionally, inhibitors of GA also reduced melanization in the presence of testosterone. Thus, these data suggest that the gibberellic biosynthesis pathway is involved in melanization in C. neoformans, and the melanization difference observed in the presence of testosterone may be due to increased production of GA, which may partly explain the sex bias observed in C. neoformans infections.

Keywords: Cryptococcus neoformans; gibberellic acid; melanization; pantothenic acid; testosterone.


Figures

FIGURE 1
FIGURE 1
Melanization of C. neoformans on L-3,4-dihydroxyphenylalanine (L-DOPA) agar plates and liquid medium in the presence of steroid hormones (estradiol, 400 pg/mL; testosterone, 10 ng/mL). (A) Melanization of C. neoformans clinical isolates grown for 7 days on L-DOPA agar plates supplemented with steroid hormones. Images were taken on days three, five, and seven. (B) Melanization of H99S grown for 5 days in L-DOPA medium supplemented with steroid hormones and measured at an optical density of 400 and 600 nm. Data is representative of three independent experiments. Statistical significance is represented as follows: ∗∗p < 0.001 comparing testosterone to ethanol and estradiol, using linear regression analysis. (C) Melanization of C. neoformans in conditioned media supplemented with steroid hormones. Absorbances were measured at an optical density of 400 and 600 nm. Error bars represent the standard deviation. Data is representative of three independent experiments. Statistical significance is represented as follows: ∗∗p < 0.002, ∗∗∗p < 0.0002 using MANOVA with simple contrasts, comparing testosterone to estrogen or ethanol. (D) Pictures of H99S melanized cells from (C) at 16, 24, and 32 h. Test, Testosterone; Estr, Estrogen (Estradiol); Eth, Ethanol.
FIGURE 2
FIGURE 2
Pantothenic acid (PA) concentrations secreted from C. neoformans in various conditions using ELISA. (A) PA concentrations secreted from C. neoformans grown in steroid hormone-supplemented L-DOPA medium for 5 days. Error bars represent the standard deviation. Data is representative of three independent experiments. Statistical significance is represented as follows: *p < 0.01 comparing all days in each treatment, *p < 0.026 comparing Test to Estr over all days, using MANOVA with simple contrasts. (B) PA concentrations secreted from C. neoformans grown in steroid hormone-supplemented conditioned medium at the 32 h time point. Error bars represent the standard deviation. Data is representative of three independent experiments. Statistical significance is represented as follows: **p < 0.001, using MANOVA with simple contrasts. (C) PA concentrations secreted from C. neoformans while grown in various concentrations of testosterone and estradiol. The X-axis depicts the concentrations of testosterone and estradiol. Error bars represent the standard deviation. Data is representative of two independent experiments. **p < 0.001, using MANOVA with simple contrasts. Test, Testosterone; Estr, Estrogen (Estradiol); Eth, Ethanol.
FIGURE 3
FIGURE 3
Gibberellic acid (GA) concentrations secreted from C. neoformans in various conditions measured via ELISA. (A) GA concentrations secreted from C. neoformans grown in steroid hormone-supplemented L-DOPA medium for 5 days. Error bars represent the standard deviation. Data is representative of three independent experiments. Statistical significance is represented as follows: in Ethanol treatment **p = 0.0167 comparing Day 1 and Day 4 and **p = 0.0089 comparing Day 1 to Day 5, in Testosterone treatment all days are different ***p < 0.001, in Estrogen treatment **p = 0.01 comparing Day 1 and Day 4 and **p = 0.0037 comparing Day 1 to Day 5, using MANOVA with simple contrasts. (B) GA concentrations secreted from C. neoformans grown in steroid hormone-supplemented conditioned medium at the 32 h time point. Error bars represent the standard deviation. Data is representative of three independent experiments. Statistical significance is represented as follows: **p < 0.001 using Tukey–Kramer HSD. (C) GA concentrations secreted from C. neoformans while grown in various concentrations of testosterone or estrogen (estradiol). The X-axis depicts the concentrations of testosterone. Error bars represent the standard deviation. Data is representative of two independent experiments. **p < 0.001, using MANOVA with simple contrasts.
FIGURE 4
FIGURE 4
Pantothenic acid (PA) and gibberellic acid (GA) concentrations secreted from C. neoformans at different cell densities using ELISA. (A) Comparison of PA concentrations secreted from C. neoformans grown in L-DOPA medium supplemented with steroid hormones at two cell densities. Error bars represent the standard error of the mean. Data is representative of three independent experiments. Statistical significance is represented as follows: *p < 0.001 using Tukey–Kramer HSD. (B) Comparison of GA concentrations secreted from C. neoformans grown in L-DOPA medium supplemented with steroid hormones at two cell densities. Error bars represent the standard error of the mean. Data is representative of three independent experiments. Statistical significance is represented as follows: p > 0.05 using Tukey–Kramer HSD, ns, not significant. Test, testosterone; Estr, Estrogen (Estradiol); Eth, Ethanol.
FIGURE 5
FIGURE 5
Gibberellic acid (GA) effects on C. neoformans growth and melanin production. (A) A comparison of H99S growth with and without exogenous GA (3 μg/mL). Error bars represent the standard deviation. Data is representative of three independent experiments. Statistical significance is represented as follows: ***p < 0.0001 for all days, using MANOVA with simple contrasts. Absorbances were measured at an optical density of 400 and 600 nm. (B) A comparison of H99S melanization with and without exogenous GA (3 μg/mL). Error bars represent the standard deviation. Data is representative of three independent experiments. Statistical significance is represented as follows: *p = 0.012 comparing Day 2 and ***p < 0.0001 comparing Day 3, using MANOVA with simple contrasts. Absorbances were measured at an optical density of 400 and 600 nm. (C) Dose-response of exogenous GA at various concentrations in conditioned media. Error bars represent the standard deviation. Data is representative of three independent experiments. Statistical significance is represented as follows: *p < 0.02 comparing 3 μg/mL to all other concentrations and *p = 0.01 comparing 1 μg/mL to 0 ng/mL using linear regression.
FIGURE 6
FIGURE 6
Phenotypic changes when genes involved in the gibberellic acid (GA) pathway are knocked out (KO) of C. neoformans. (A) Melanization of C. neoformans KO strains identified in the RNAseq data. Absorbances were measured at an optical density of 400 and 600 nm. Error bars represent the standard deviation. Data is representative of three independent experiments. Statistical significance is represented as follows: ***p < 0.0001 comparing H99S + Test (10 ng/mL) with all other strains, ***p < 0.0001 comparing strains CNAG_03857 to CNAG_04029, CNAG_5356 to CNAG_04029, CNAG_04029 to CNAG_02841, CNAG_04029 to CNAG_03340, and CNAG_02841 to CNAG_03340 using linear regression. (B) GA concentrations (ng/mL) secreted from KO strains at 32 h of melanization normalized to an optical density of 600 nm. Error bars represent the standard deviation. Data is representative of three independent experiments. Statistical significance is represented as follows: **p < 0.004 using Wilcoxon Rank Sums. (C) Gibberellic acid (GA) concentrations (ng/mL) secreted from KO strains of two hypothetical proteins identified in the RNA sequencing data that were upregulated when C. neoformans was in the presence of testosterone at 32 h of melanization normalized to an optical density of 600 nm. Error bars represent the standard deviation. Data is representative of three independent experiments. Statistical significance is represented as follows: **p < 0.004 using Wilcoxon Rank Sums. Test, Testosterone; Estr, Estrogen (Estradiol); Eth, Ethanol.
FIGURE 7
FIGURE 7
Melanization of C. neoformans grown in the presence of various additives/inhibitors and steroid hormones. (A) Testosterone, (B) Estrogen, (C) Ethanol. Absorbances were measured at an optical density of 400 and 600 nm. Error bars represent the standard deviation. Data is representative of three independent experiments. Statistical significance is represented as follows: ***p < 0.0001 comparing Test alone and Test + GA to all other treatments. ***p < 0.0001 comparing Estr + GA to Estr alone and Estr + PA to all other treatments. ****p < 0.0001 comparing Eth + GA to all other treatments using linear regression. Test, Testosterone; GA, Gibberellic Acid; PA, Pantothenic Acid; CC, Chlormequat Chloride; DS/DLS, DL-Serine.
FIGURE 8
FIGURE 8
Potential model for the regulation of gibberellic acid production when C. neoformans is in the presence of testosterone.
FIGURE 9
FIGURE 9
Biological relevance (A) Gibberellic acid (GA) and Pantothenic acid (PA) concentrations after incubation at 37°C + 5% CO2. Error bars represent the standard deviation. Data is representative of three independent experiments. ∗∗p < 0.0001 Test vs. all other conditions; p < 0.05 Est and Test vs. Eth and media alone; ANOVA with Tukey’s HSD. (B) Combined organ fungal burden per gram body weight at day 7 post-infection in male and female mice infected with H99S. Error bars represent the standard error of the mean. Data are representative of one experiment, N = 6 mice/sex. p = 0.0345, Wilcoxon Ranks Sums. Test, Testosterone; Estr, Estrogen (Estradiol); Eth, Ethanol.

Similar articles

Cited by

References

    1. Albuquerque P., Nicola A. M., Nieves E., Williamson P. R., Silva-Pereira I., Casadevall A. (2013). Quorum sensing-mediated, cell density-dependent regulation of growth and virulence in Cryptococcus neoformans. mBio 5:e00986-13. 10.1128/mBio.00986-13 - DOI - PMC - PubMed
    1. Baker L. G., Specht C. A., Donlin M. J., Lodge J. K. (2007). Chitosan, the deacetylated form of chitin, is necessary for cell wall integrity in Cryptococcus neoformans. Eukaryot. Cell 6 855–867. 10.1128/ec.00399-06 - DOI - PMC - PubMed
    1. Bateman D. E., Weller R. O., Kennedy P. (1990). Stiffman syndrome: a rare paraneoplastic disorder? J. Neurol. Neurosurg. Psychiatry 53 695–696. 10.1136/jnnp.53.8.695 - DOI - PMC - PubMed
    1. Bernard D., Prasanth K. V., Tripathi V., Colasse S., Nakamura T., Xuan Z., et al. (2010). A long nuclear-retained non-coding RNA regulates synaptogenesis by modulating gene expression. EMBO J. 29 3082–3093. 10.1038/emboj.2010.199 - DOI - PMC - PubMed
    1. Bisson G. P., Nthobatsong R., Thakur R., Lesetedi G., Vinekar K., Tebas P., et al. (2008). The use of HAART is associated with decreased risk of death during initial treatment of cryptococcal meningitis in adults in Botswana. J. Acquir. Immune Defic. Syndr. 49 227–229. 10.1097/QAI.0b013e318183181e - DOI - PMC - PubMed

LinkOut - more resources