Comparative Study
. 2020 Aug 12:11:1960.
doi: 10.3389/fimmu.2020.01960. eCollection 2020.

Rhesus Cytomegalovirus-Specific CD8+ Cytotoxic T Lymphocytes Do Not Become Functionally Exhausted in Chronic SIVmac239 Infection

Affiliations
Comparative Study

Rhesus Cytomegalovirus-Specific CD8+ Cytotoxic T Lymphocytes Do Not Become Functionally Exhausted in Chronic SIVmac239 Infection

Brandon C Rosen et al. Front Immunol. .

Abstract

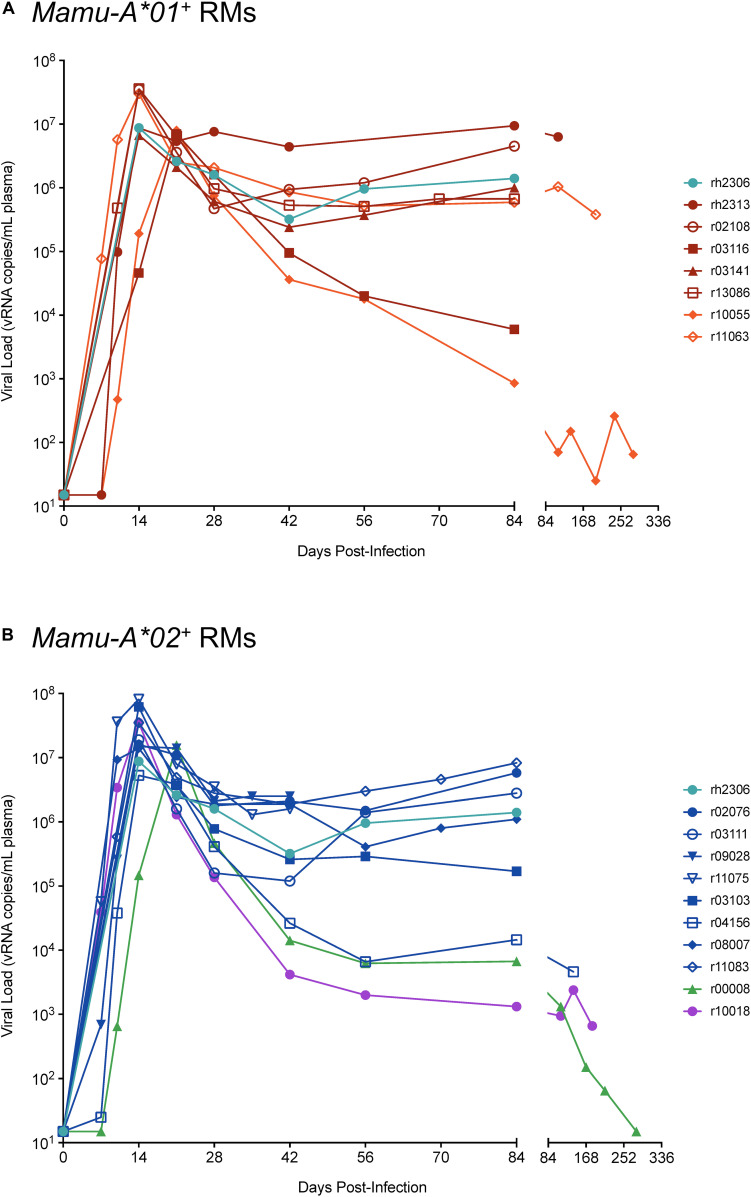
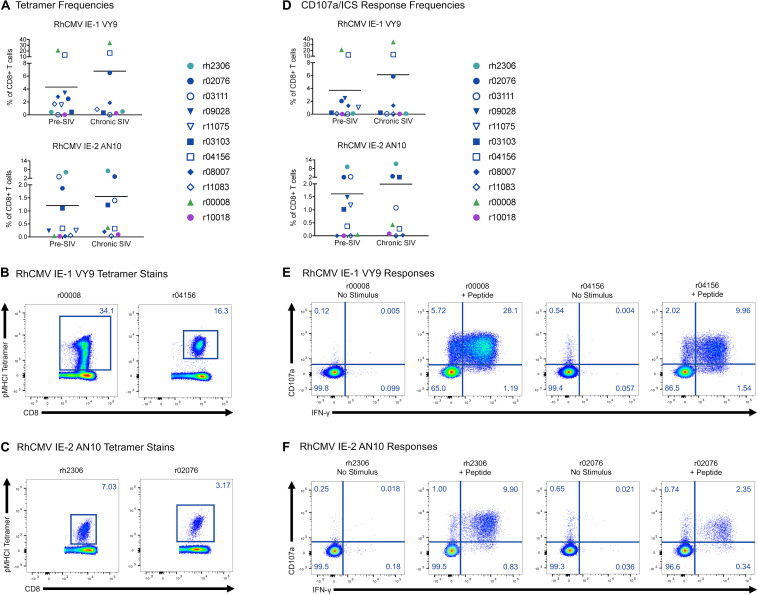
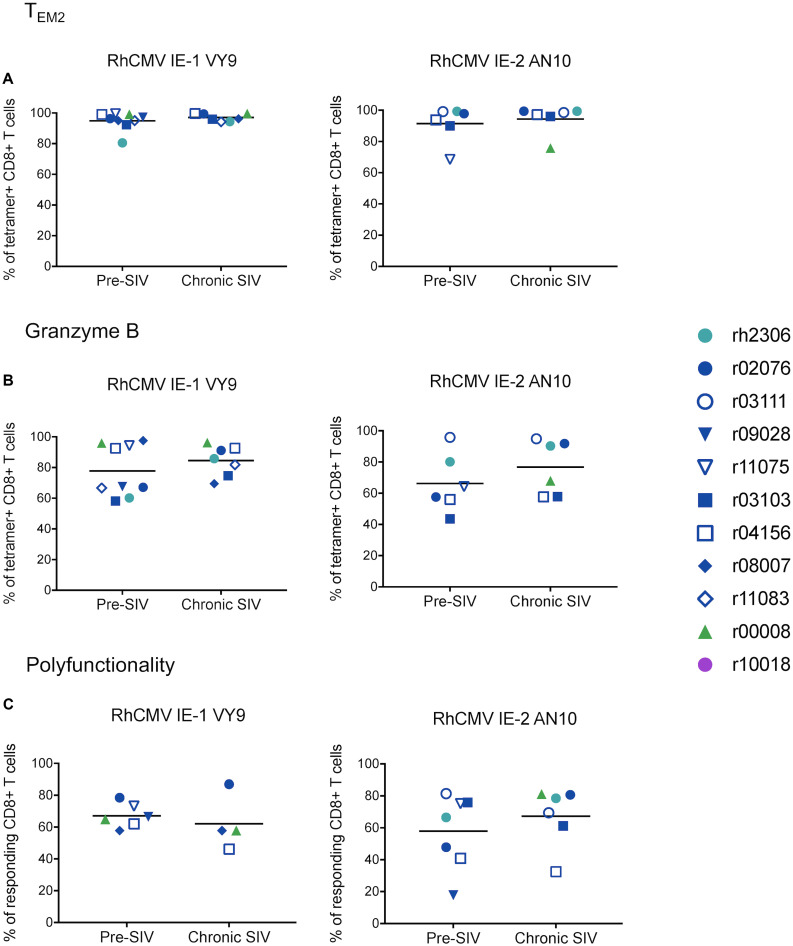
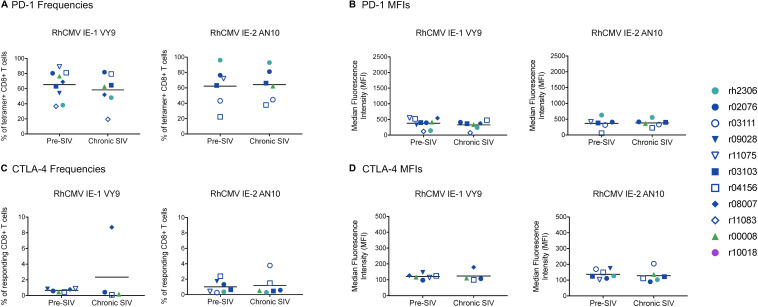
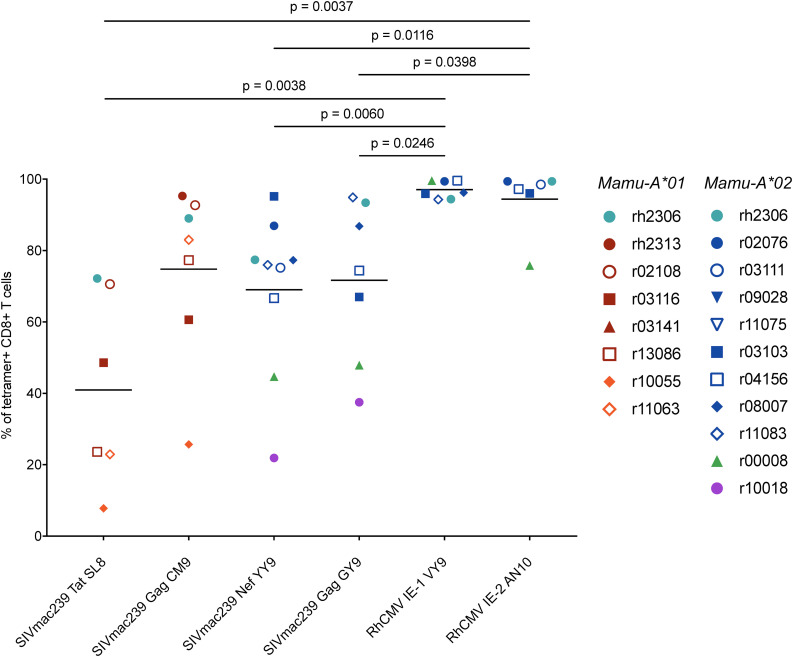
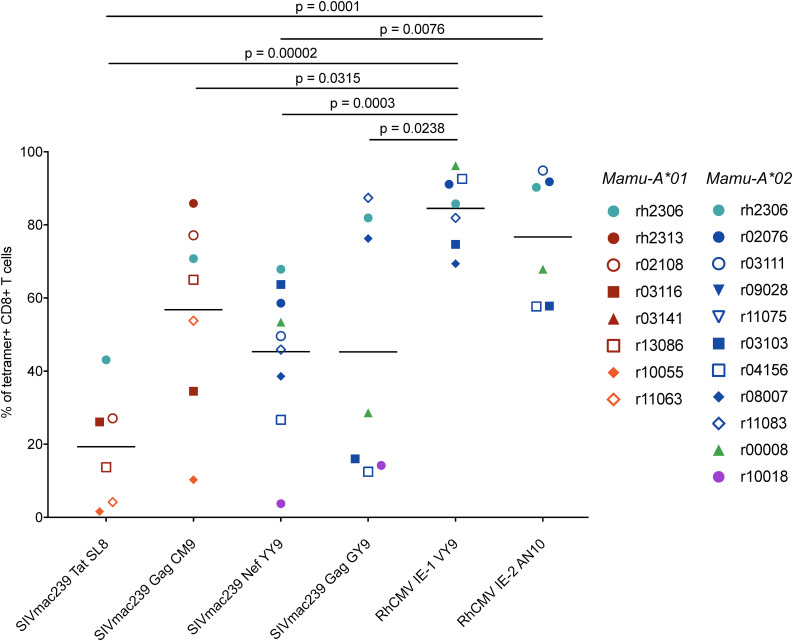
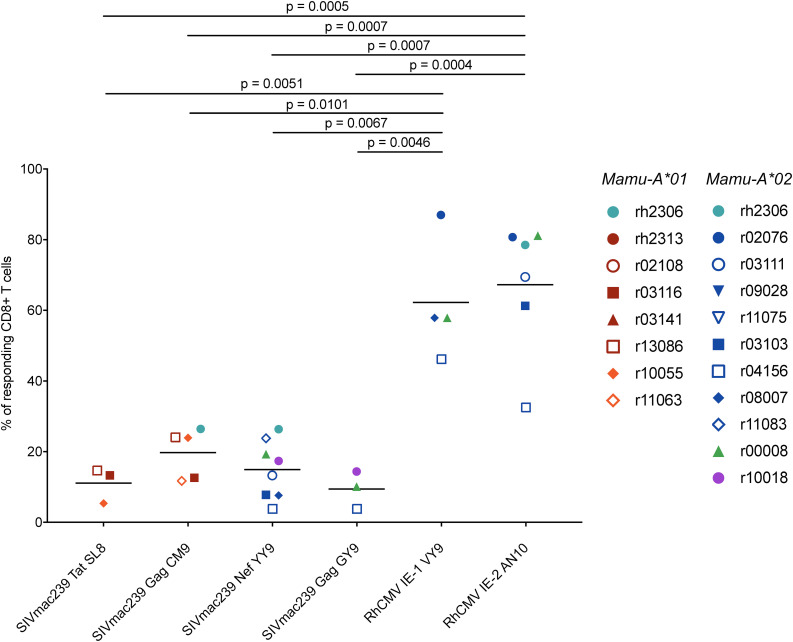
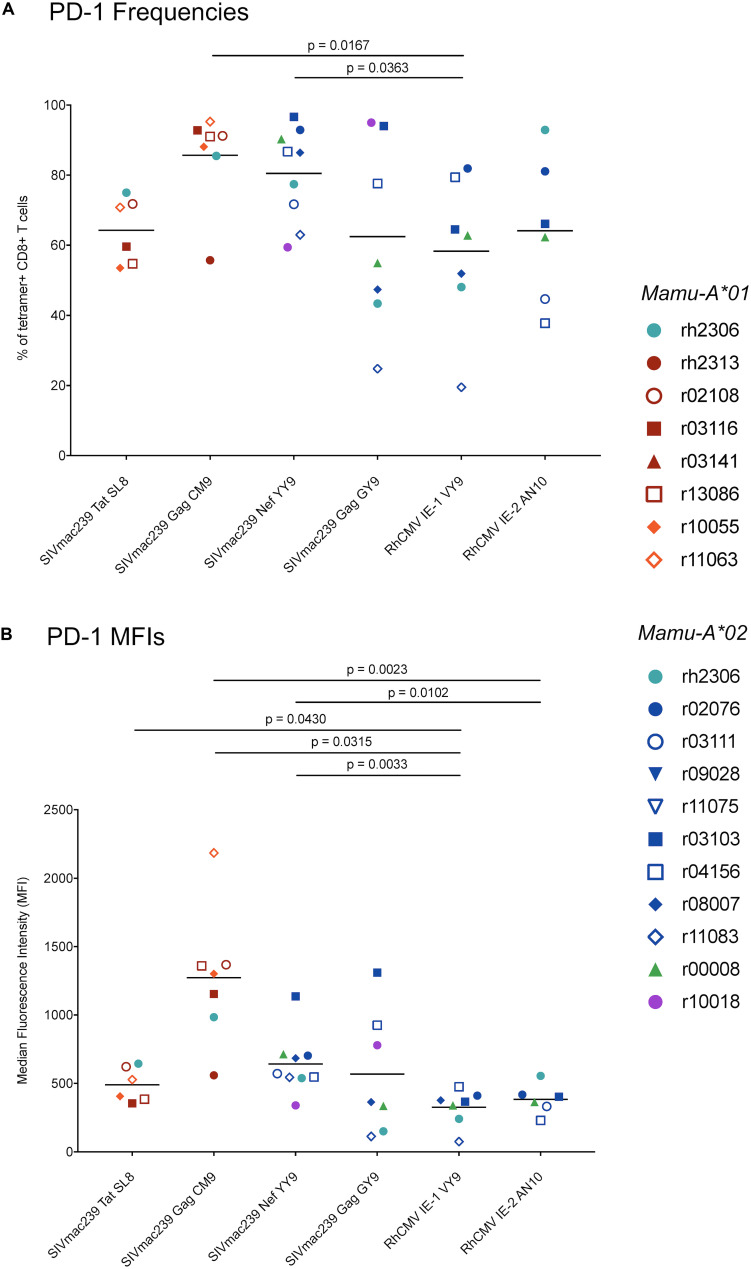
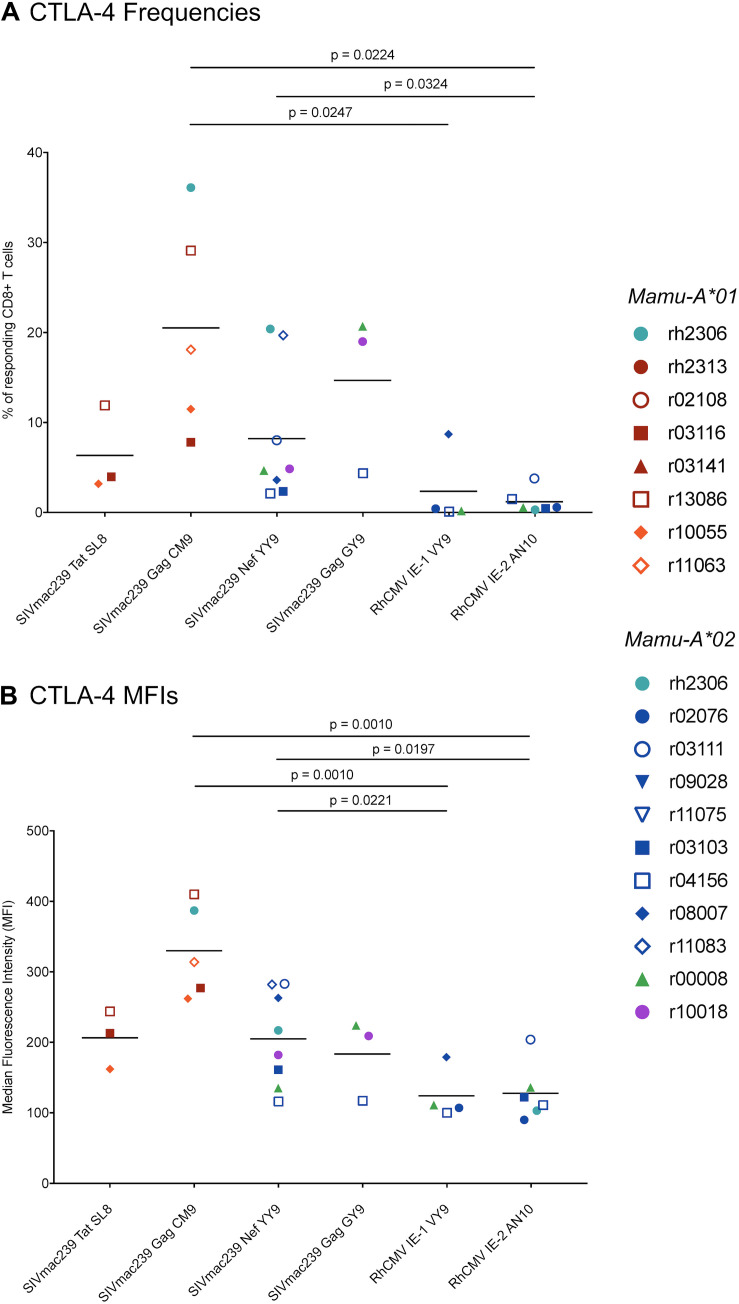
CD8+ cytotoxic T lymphocytes (CTLs) exert potent antiviral activity after HIV/SIV infection. However, efforts to harness the antiviral efficacy of CTLs for HIV/SIV prophylaxis and therapy have been severely hindered by two major problems: viral escape and exhaustion. By contrast, CTLs directed against human cytomegalovirus (HCMV), a ubiquitous chronic herpesvirus, seldom select for escape mutations and remain functional and refractory to exhaustion during chronic HCMV and HIV infection. Recently, attempts have been made to retarget HCMV-specific CTLs for cancer immunotherapy. We speculate that such a strategy may also be beneficial in the context of HIV/SIV infection, facilitating CTL-mediated control of HIV/SIV replication. As a preliminary assessment of the validity of this approach, we investigated the phenotypes and functionality of rhesus CMV (RhCMV)-specific CTLs in SIVmac239-infected Indian rhesus macaques (RMs), a crucial HIV animal model system. We recently identified two immunodominant, Mamu-A02-restricted CTL epitopes derived from RhCMV proteins and sought to evaluate the phenotypic and functional characteristics of these CTL populations in chronic SIVmac239 infection. We analyzed and directly compared RhCMV- and SIVmac239-specific CTLs during SIVmac239 infection in a cohort of Mamu-A01+ and Mamu-A02+ RMs. CTL populations specific for at least one of the RhCMV-derived CTL epitopes were detected in ten of eleven Mamu-A02+ animals tested, and both populations were detected in five of these animals. Neither RhCMV-specific CTL population exhibited significant changes in frequency, memory phenotype, granzyme B expression, exhaustion marker (PD-1 and CTLA-4) expression, or polyfunctionality between pre- and chronic SIVmac239 infection timepoints. In chronic SIVmac239 infection, RhCMV-specific CTLs exhibited higher levels of granzyme B expression and polyfunctionality, and lower levels of exhaustion marker expression, than SIVmac239-specific CTLs. Additionally, compared to SIVmac239-specific CTLs, greater proportions of RhCMV-specific CTLs were of the terminally differentiated effector memory phenotype (CD28- CCR7-) during chronic SIVmac239 infection. These results suggest that, in contrast to SIVmac239-specific CTLs, RhCMV-specific CTLs maintain their phenotypes and cytolytic effector functions during chronic SIVmac239 infection, and that retargeting RhCMV-specific CTLs might be a promising SIV immunotherapeutic strategy.

Keywords: cytomegalovirus; cytotoxic T lymphocytes; human immunodeficiency virus; rhesus macaques; simian immunodeficiency virus.


Figures

FIGURE 1
FIGURE 1
SIVmac239 viral loads for rhesus macaques in this study. (A) Mamu-A*01+ RMs. (B) Mamu-A*02+ RMs. Viral loads for rh2306 are shown in both graphs, since this animal was Mamu-A*01+ Mamu-A*02+.
FIGURE 2
FIGURE 2
Frequencies of RhCMV-specific CD8+ T cells before and during SIVmac239 infection. PBMCs from SIVmac239-infected Mamu-A*02+ animals were stained with (A–C) the indicated pMHCI tetramers or (D–F) stimulated with the corresponding minimal optimal peptides in a CD107a degranulation assay with ICS. Graphs depict the frequencies of antigen-specific CD8+ T cells among all CD8+ T cells (defined as live CD3+ CD8+ CD14 CD20 CD159a lymphocytes). Flow cytometry plots depict all CD8+ T cells for the animals with the highest frequencies of RhCMV-specific CD8+ T cells in chronic SIVmac239 infection by tetramer staining (B,C) or CD107a degranulation assay with ICS (E,F). None of the differences in tetramer or CD107a/ICS frequencies between pre- and chronic infection timepoints were statistically significant (all p > 0.05 by Welch’s t-test).
FIGURE 3
FIGURE 3
Phenotypic and functional characteristics of RhCMV-specific CD8+ T cells before and during SIVmac239 infection. Unstimulated PBMCs were stained with pMHCI tetramer and fluorophore-conjugated mAbs to determine the frequencies of (A) TEM2 (CD28 CCR7) and (B) granzyme B+ cells among tetramer+ CD8+ T cells (defined as live CD3+ CD8+ tetramer+ CD14 CD20 CD159a lymphocytes). (C) CTL polyfunctionality was evaluated by CD107a/ICS assay, in which PBMCs were stimulated with the corresponding minimal optimal peptides. A responding CD8+ T cell (a live CD3+ CD8+ CD14 CD20 CD159a lymphocyte) was defined as a cell staining positive for CD107a or IFN-γ or TNF-α. Polyfunctionality was defined as the proportion of responding CD8+ T cells staining for all three markers simultaneously (CD107a+ IFN-γ+ TNF-α+). None of the differences between pre- and chronic-phase CD8+ T cells in panels (A–C) were statistically significant (all p > 0.05 by Welch’s t-test).
FIGURE 4
FIGURE 4
Exhaustion marker expression by RhCMV-specific CD8+ T cells before and during SIVmac239 infection. (A) Frequencies of PD-1+ CTLs and (B) PD-1 median fluorescence intensities (MFIs) were determined by pMHCI tetramer staining of unstimulated PBMCs. PD-1 expression was analyzed in tetramer+ CD8+ T cells (defined as live CD3+ CD8+ tetramer+ CD14 CD20 CD159a lymphocytes). (C) Frequencies of CTLA-4+ CTLs and (D) CTLA-4 MFIs were evaluated by CD107a/ICS assay, in which PBMCs were stimulated with the corresponding minimal optimal peptides. CTLA-4 expression was analyzed in responding CD8+ T cells, which were defined as live CD3+ CD8+ CD14 CD20 CD159a lymphocytes staining positive for CD107a or IFN-γ or TNF-α. None of the differences between pre- and chronic-phase CD8+ T cells in panels (A–D) were statistically significant (all p > 0.05 by Welch’s t-test).
FIGURE 5
FIGURE 5
Frequencies of TEM2 lymphocytes among RhCMV- and SIVmac239-specific CD8+ T cells during chronic SIVmac239 infection. Graphs depict the frequencies of TEM2 (CD28 CCR7) cells among tetramer+ CD8+ T cells (defined as live CD3+ CD8+ tetramer+ CD14 CD20 CD159a lymphocytes). Statistical analysis was conducted using Welch’s t-test. Comparison of TEM2 frequencies between Tat SL8- and Gag CM9-specific CD8+ T cells yielded a p-value of 0.0407 (Welch’s t-test; not shown in figure). All other comparisons of RhCMV- and/or SIVmac239-specific CD8+ T cells without p-values listed in figure yielded non-significant p-values (p > 0.05).
FIGURE 6
FIGURE 6
Granzyme B expression in RhCMV- and SIVmac239-specific CD8+ T cells during chronic SIVmac239 infection. Graph depicts the frequencies of granzyme B+ cells among tetramer+ CD8+ T cells (defined as live CD3+ CD8+ tetramer+ CD14 CD20 CD159a lymphocytes). Statistical analysis was conducted using Welch’s t-test. The following comparisons of granzyme B frequencies in SIVmac239-specific CD8+ T cell populations also yielded statistically significant p-values: Tat SL8- and Gag CM9-specific CD8+ T cells (p = 0.0103); Tat SL8- and Nef YY9-specific CD8+ T cells (p = 0.0150). All other comparisons of RhCMV- and/or SIVmac239-specific CD8+ T cells without p-values listed in figure yielded non-significant p-values (p > 0.05).
FIGURE 7
FIGURE 7
Frequencies of polyfunctional lymphocytes (CD107a+ IFN-γ+ TNF-α+) among RhCMV- and SIVmac239-specific CD8+ T cells during chronic SIVmac239 infection. Graph depicts the frequencies of polyfunctional (CD107a+ IFN-γ+ TNF-α+) CD8+ T cells responding to minimal optimal peptide in a CD107a degranulation assay with ICS. A responding CD8+ T cell was defined as a live CD3+ CD8+ CD14 CD20 CD159a lymphocyte staining positive for CD107a or IFN-γ or TNF-α. Statistical significance was evaluated using Welch’s t-test. None of the comparisons between SIVmac239-specific CD8+ T cell populations yielded statistically significant p-values (not shown on graph, all p > 0.05).
FIGURE 8
FIGURE 8
PD-1 expression by RhCMV- and SIVmac239-specific CD8+ T cells during chronic SIVmac239 infection. Graph depicts (A) frequencies of PD-1+ cells among tetramer+ CD8+ T cells and (B) PD-1 median fluorescence intensities (MFIs) for tetramer+ CD8+ T cells (defined as live CD3+ CD8+ tetramer+ CD14 CD20 CD159a lymphocytes). Statistical analysis was conducted using Welch’s t-test. The following comparisons of PD-1+ frequencies between SIVmac239-specific CD8+ T cell populations yielded statistically significant p-values: Tat SL8- and Gag CM9-specific CD8+ T cells (p = 0.0066); Tat SL8- and Nef YY9-specific CD8+ T cells (p = 0.0160). The following comparisons of PD-1 MFIs for SIVmac239-specific CD8+ T cells yielded statistically significant p-values: Tat SL8- and Gag CM9-specific CD8+ T cells (p = 0.0048); Gag CM9- and Nef YY9-specific CD8+ T cells (p = 0.0134); Gag CM9- and Gag GY9-specific CD8+ T cells (p = 0.0159). All other comparisons of RhCMV- and/or SIVmac239-specific CD8+ T cells without p-values listed in figure yielded non-significant p-values (p > 0.05).
FIGURE 9
FIGURE 9
CTLA-4 expression by RhCMV- and SIVmac239-specific CD8+ T cells during chronic SIVmac239 infection. Graph depicts (A) frequencies of CTLA-4+ lymphocytes among CD8+ T cells responding to minimal optimal peptide and (B) CTLA-4 median fluorescence intensities (MFIs) for responding CD8+ T cells in a CD107a/ICS assay. A responding CD8+ T cell was defined as a live CD3+ CD8+ CD14 CD20 CD159a lymphocyte staining positive for CD107a or IFN-γ or TNF-α. Statistical significance was evaluated using Welch’s t-test. None of the comparisons of CTLA-4 frequencies between SIVmac239-specific CD8+ T cell populations yielded statistically significant p-values (all p > 0.05). The following comparisons of CTLA-4 MFIs for SIVmac239-specific CD8+ T cells yielded statistically significant p-values: Tat SL8- and Gag CM9-specific CD8+ T cells (p = 0.0172); Gag CM9- and Nef YY9-specific CD8+ T cells (p = 0.0089); Gag CM9- and Gag GY9-specific CD8+ T cells (p = 0.0217). All other comparisons of RhCMV- and/or SIVmac239-specific CD8+ T cells without p-values listed in figure yielded non-significant p-values (p > 0.05).

Similar articles

Cited by

References

    1. Walker BD, Chakrabarti S, Moss B, Paradis TJ, Flynn T, Durno AG, et al. HIV-specific cytotoxic T lymphocytes in seropositive individuals. Nature. (1988) 328:345–8. 10.1038/328345a0 - DOI - PubMed
    1. Koup RA, Safrit JT, Cao Y, Andrews CA, McLeod G, Borkowsky W, et al. Temporal association of cellular immune responses with the initial control of viremia in primary human immunodeficiency virus type 1 syndrome. J Virol. (1994) 68:4650–5. 10.1128/jvi.68.7.4650-4655.1994 - DOI - PMC - PubMed
    1. Borrow P, Lewicki H, Hahn BH, Shaw GM, Oldstone MB. Virus-specific CD8+ cytotoxic T-lymphocyte activity associated with control of viremia in primary human immunodeficiency virus type 1 infection. J Virol. (1994) 68:6103–10. 10.1128/jvi.68.9.6103-6110.1994 - DOI - PMC - PubMed
    1. Goonetilleke N, Liu MKP, Salazar-Gonzalez JF, Ferrari G, Giorgi E, Ganusov VV, et al. The first T cell response to transmitted/founder virus contributes to the control of acute viremia in HIV-1 infection. J Exp Med. (2009) 206:1253–72. 10.1084/jem.20090365 - DOI - PMC - PubMed
    1. Phillips RE, Rowland-Jones S, Nixon DF, Gotch FM, Edwards JP, Ogunlesi AO, et al. Human immunodeficiency virus genetic variation that can escape cytotoxic T cell recognition. Nature. (1991) 354:453–9. 10.1038/354453a0 - DOI - PubMed

Publication types

MeSH terms