

Clinical significance of long non-coding RNA DUXAP8 and its protein coding genes in hepatocellular carcinoma
- PMID: 32922554
- PMCID: PMC7477403
- DOI: 10.7150/jca.47902
Clinical significance of long non-coding RNA DUXAP8 and its protein coding genes in hepatocellular carcinoma
Abstract
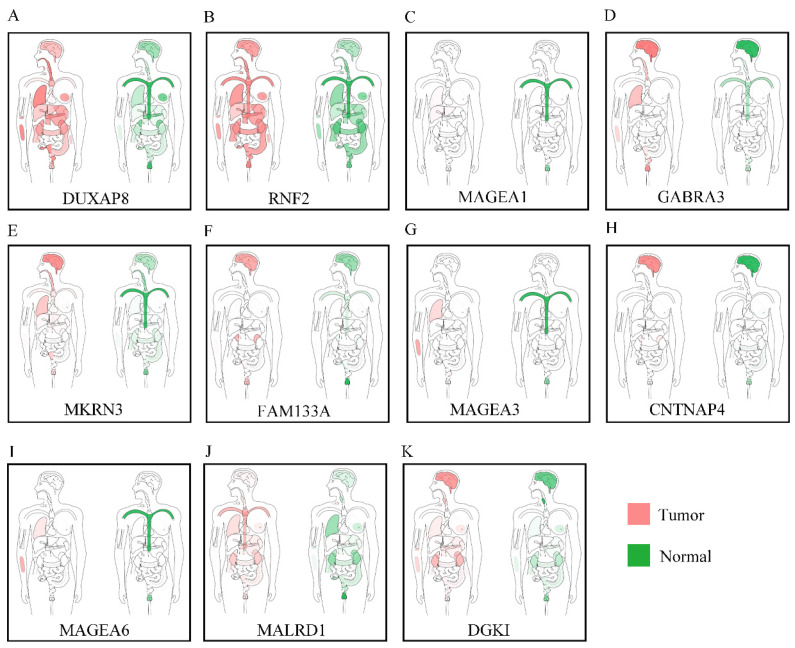
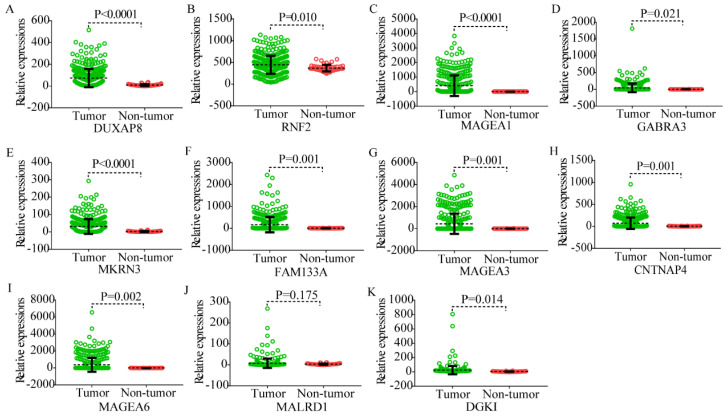
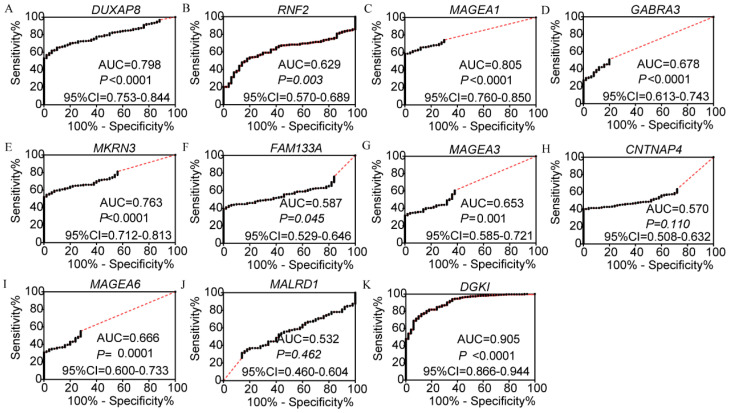
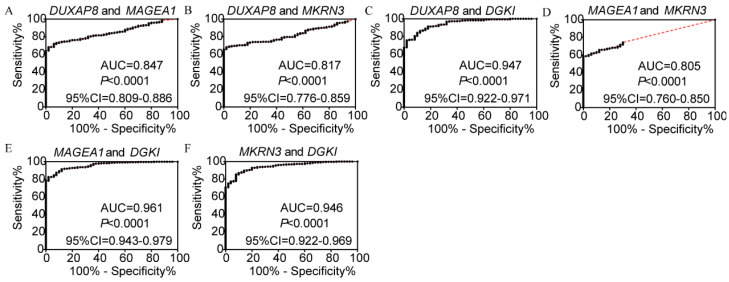
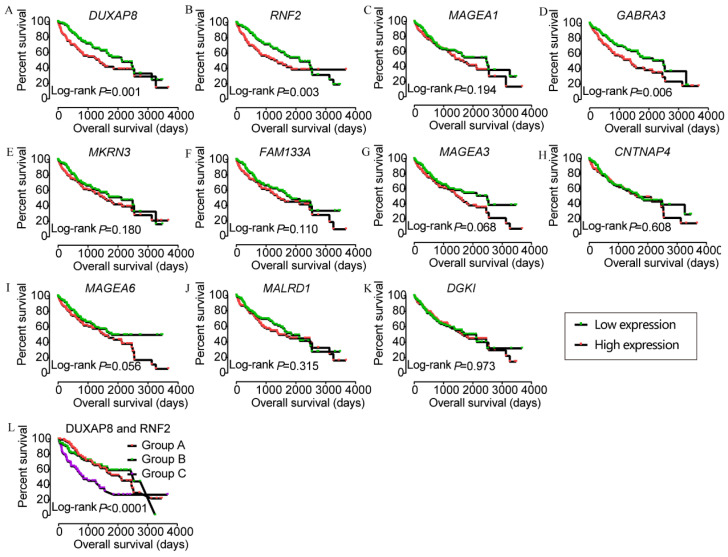
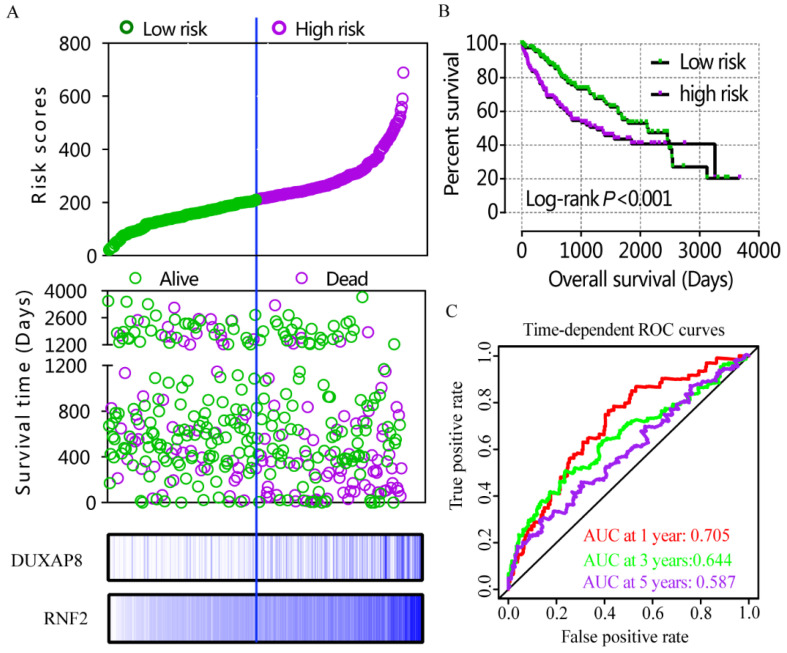
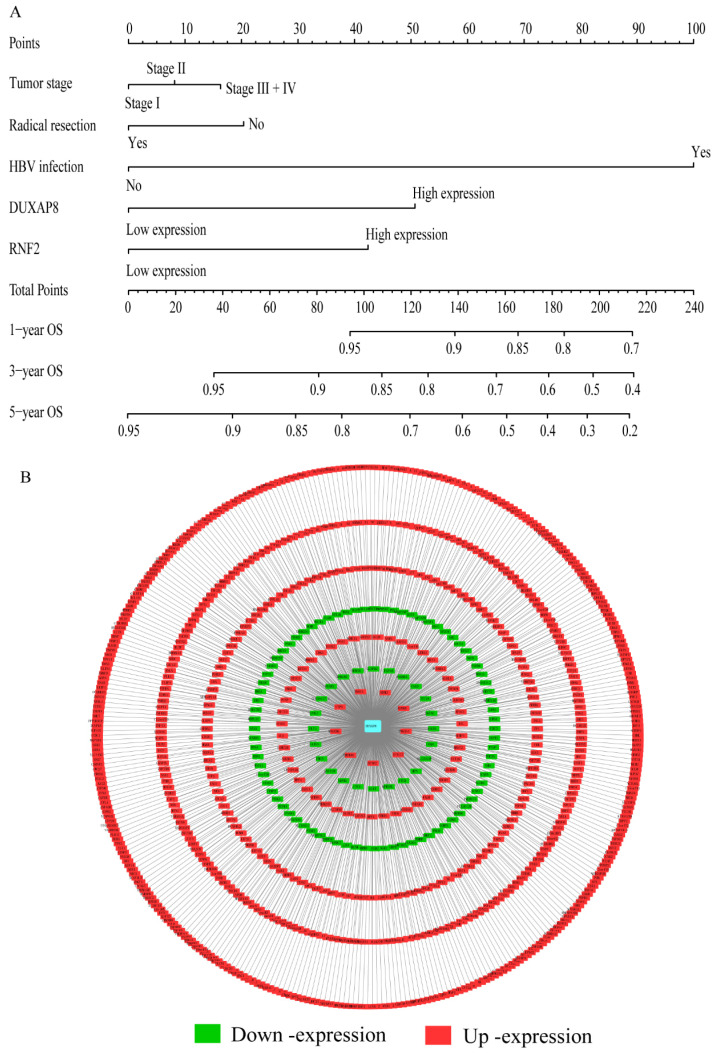
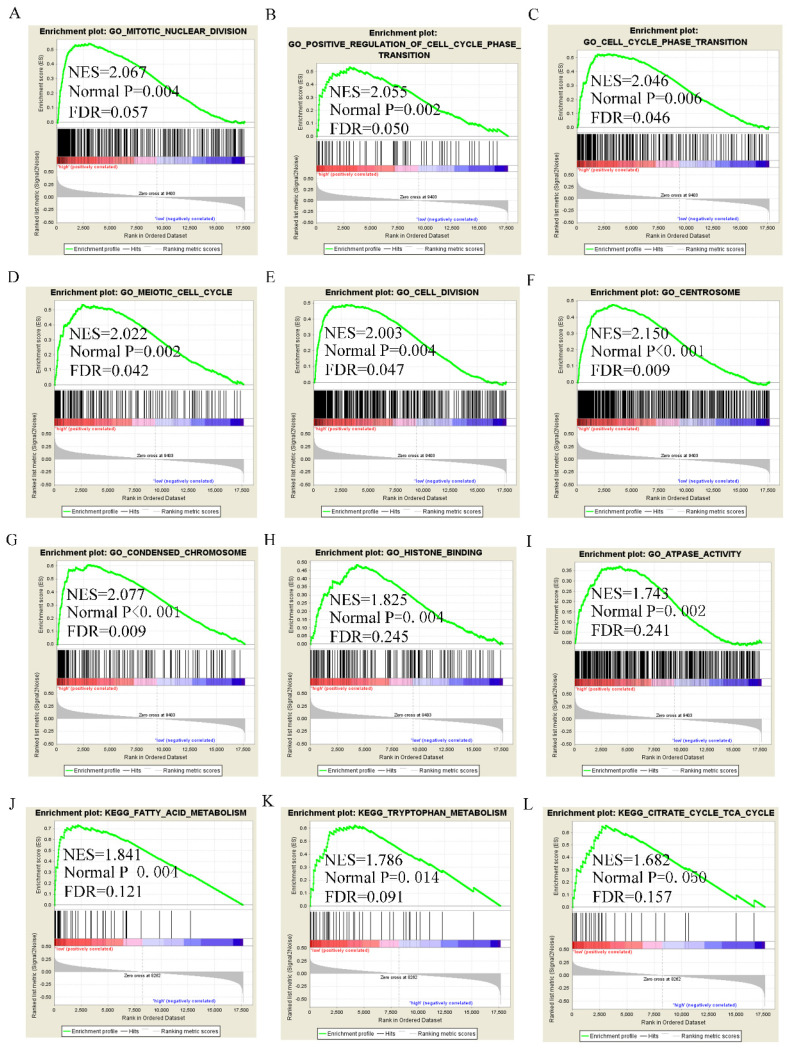
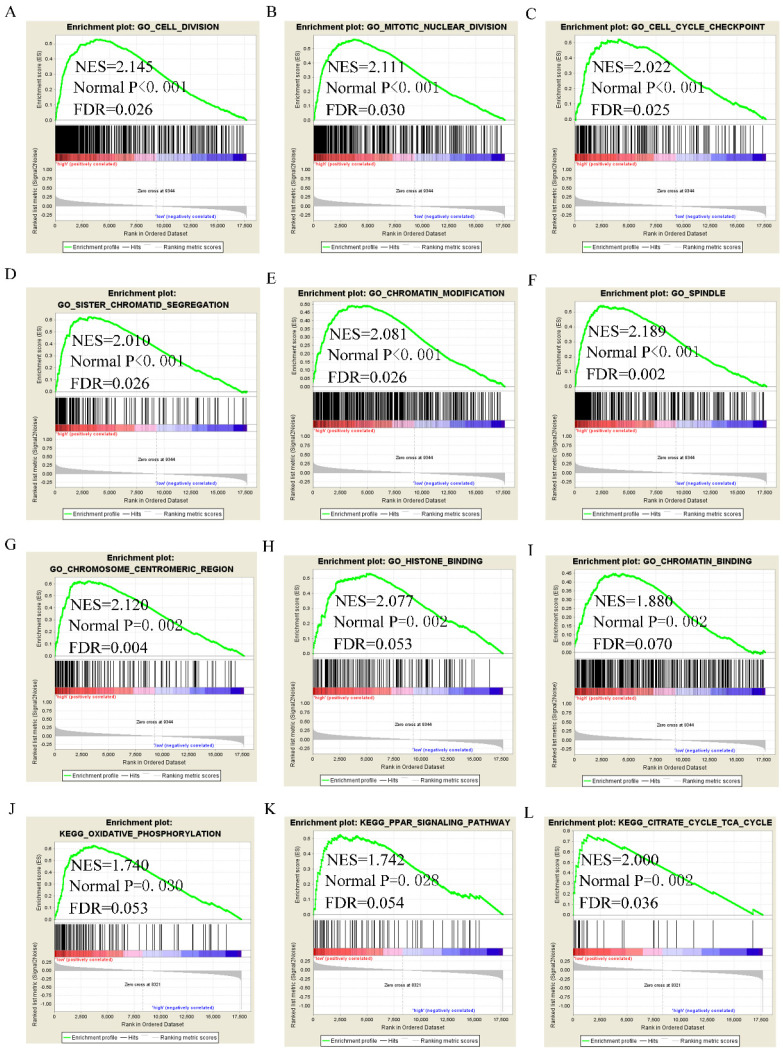
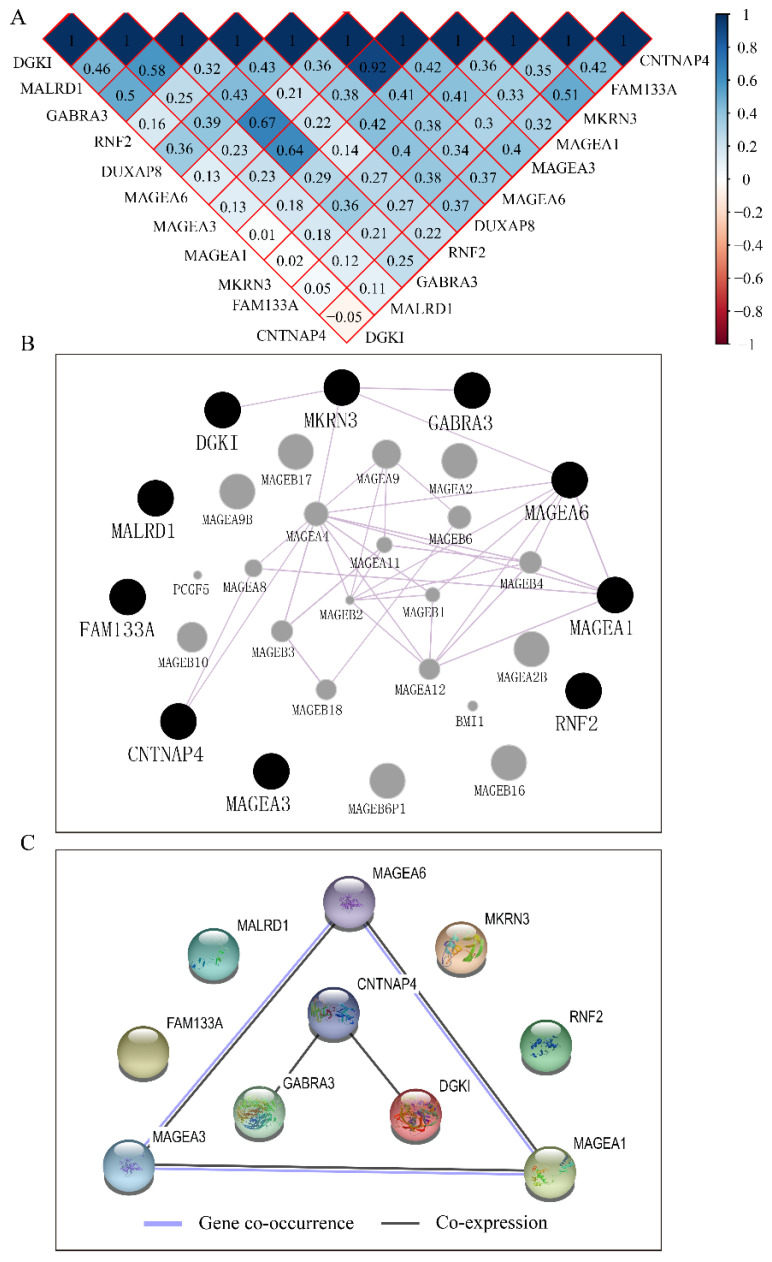
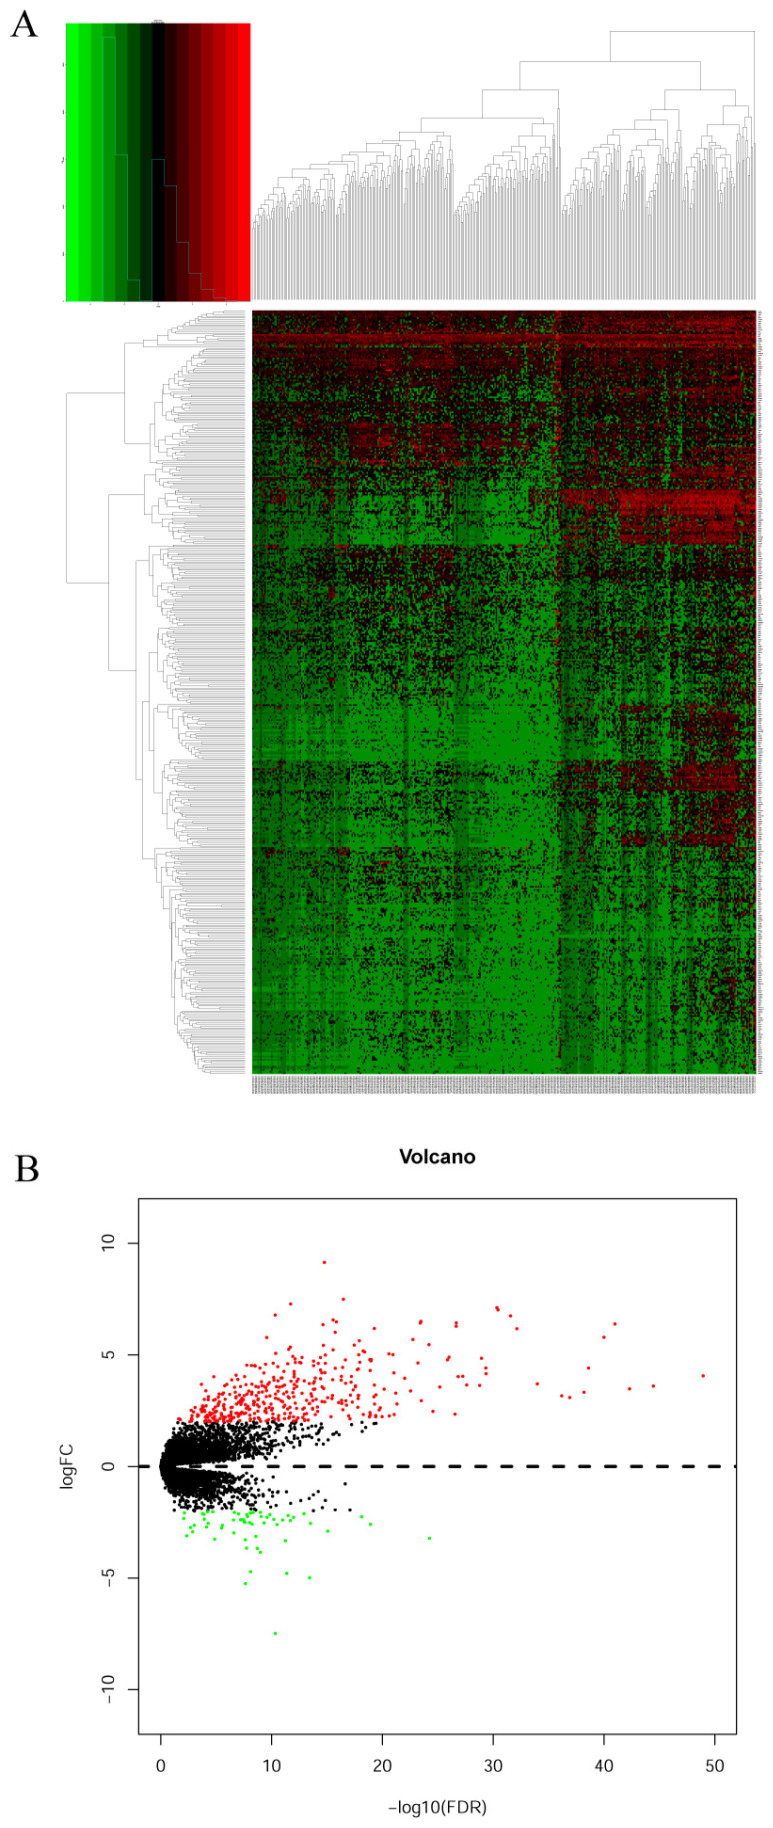
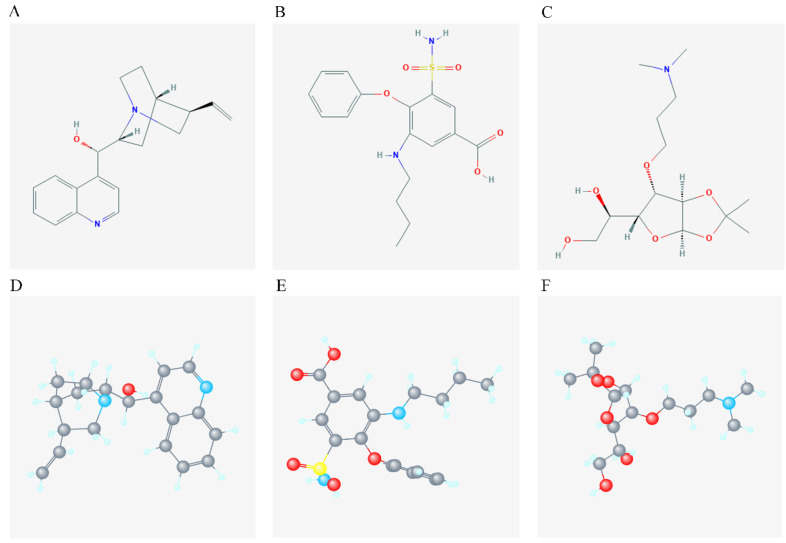
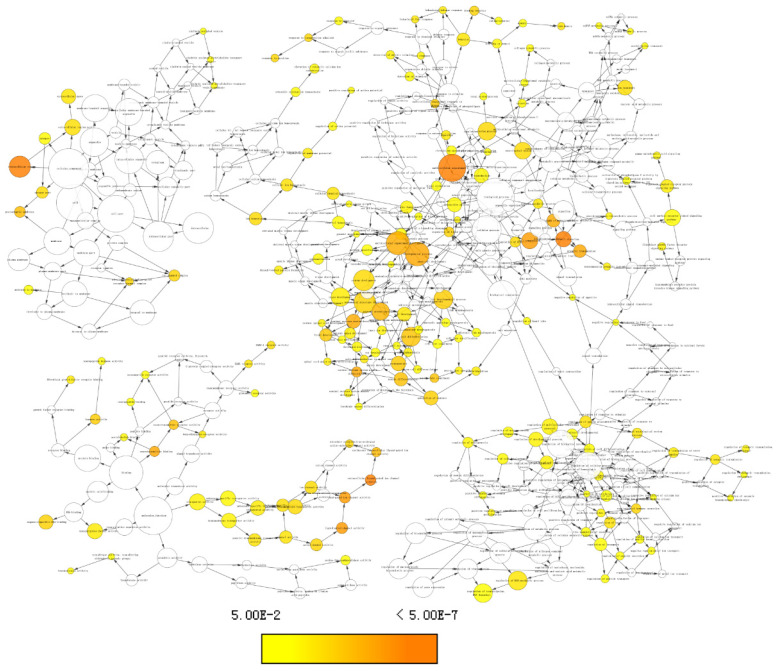
Backgrounds: Hepatocellular carcinoma (HCC) is a lethal malignancy worldwide that is difficult to diagnose during the early stages and its tumors are recurrent. Long non-coding RNAs (lncRNAs) have increasingly been associated with tumor biomarkers for diagnosis and prognosis. This study attempts to explore the potential clinical significance of lncRNA DUXAP8 and its co-expression related protein coding genes (PCGs) for HCC. Method: Data from a total of 370 HCC patients from The Cancer Genome Atlas were utilized for the analysis. DUXAP8 and its top 10 PCGs were explored for their diagnostic and prognostic implications for HCC. A risk score model and nomogram were constructed for prognosis prediction using prognosis-related genes and DUXAP8. Molecular mechanisms of DUXAP8 and its PCGs involved in HCC initiation and progression were investigated. Then, potential target drugs were identified using genome-wide DUXAP8-related differentially expressed genes in a Connectivity Map database. Results: The top 10 PCGs were identified as: RNF2, MAGEA1, GABRA3, MKRN3, FAM133A, MAGEA3, CNTNAP4, MAGEA6, MALRD1, and DGKI. Diagnostic analysis indicated that DUXAP8, MEGEA1, MKRN3, and DGKI show diagnostic implications (all area under curves ≥0.7, p≤0.05). Prognostic analysis indicated that DUXAP8 and RNF2 had prognostic implications for HCC (adjusted p=0.014 and 0.008, respectively). The risk score model and nomogram showed an advantage for prognosis prediction. A total of 3 target drugs were determined: cinchonine, bumetanide and amiprilose and they may serve as potential therapeutic targets for HCC. Conclusion: Functioning as an oncogene, DUXAP8 is overexpressed in tumor tissue and may serve as both a diagnostic and prognosis biomarker for HCC. MEGEA1, MKRN3, and DGKI maybe potential diagnostic biomarkers and DGKI may also be potentially prognostic biomarkers for HCC.
Keywords: DUXAP8; hepatocellular carcinoma; long non-coding RNA; molecular mechanism; protein-coding gene.
© The author(s).
Conflict of interest statement
Competing Interests: The authors have declared that no competing interest exists.
Figures
Similar articles
-
m6A Modification-Mediated DUXAP8 Regulation of Malignant Phenotype and Chemotherapy Resistance of Hepatocellular Carcinoma Through miR-584-5p/MAPK1/ERK Pathway Axis.Front Cell Dev Biol. 2021 Dec 9;9:783385. doi: 10.3389/fcell.2021.783385. eCollection 2021. Front Cell Dev Biol. 2021. PMID: 34957112 Free PMC article.
-
Genome‑wide investigation of the clinical implications and molecular mechanism of long noncoding RNA LINC00668 and protein‑coding genes in hepatocellular carcinoma.Int J Oncol. 2019 Oct;55(4):860-878. doi: 10.3892/ijo.2019.4858. Epub 2019 Aug 14. Int J Oncol. 2019. PMID: 31432149 Free PMC article.
-
Pseudogene DUXAP8 Promotes Cell Proliferation and Migration of Hepatocellular Carcinoma by Sponging MiR-490-5p to Induce BUB1 Expression.Front Genet. 2020 Jul 22;11:666. doi: 10.3389/fgene.2020.00666. eCollection 2020. Front Genet. 2020. PMID: 32849765 Free PMC article.
-
Long Non-coding RNA Double Homeobox A Pseudogene 8: A Novel Oncogenic Propellant in Human Cancer.Front Cell Dev Biol. 2021 Sep 23;9:709069. doi: 10.3389/fcell.2021.709069. eCollection 2021. Front Cell Dev Biol. 2021. PMID: 34631702 Free PMC article. Review.
-
Long non-coding RNAs in hepatocellular carcinoma: Potential roles and clinical implications.World J Gastroenterol. 2017 Aug 28;23(32):5860-5874. doi: 10.3748/wjg.v23.i32.5860. World J Gastroenterol. 2017. PMID: 28932078 Free PMC article. Review.
Cited by
-
LncRNA DUXAP8 as a prognostic biomarker for various cancers: A meta-analysis and bioinformatics analysis.Front Genet. 2022 Aug 15;13:907774. doi: 10.3389/fgene.2022.907774. eCollection 2022. Front Genet. 2022. PMID: 36046244 Free PMC article.
-
Identification of the Potential Molecular Mechanism of TGFBI Gene in Persistent Atrial Fibrillation.Comput Math Methods Med. 2022 Nov 8;2022:1643674. doi: 10.1155/2022/1643674. eCollection 2022. Comput Math Methods Med. 2022. PMID: 36398072 Free PMC article.
-
RNF2 Modulates Lipid Metabolism and Inflammation in Alcohol-associated Liver Disease by Interacting with USP7.Int J Biol Sci. 2025 Apr 28;21(7):3306-3323. doi: 10.7150/ijbs.111290. eCollection 2025. Int J Biol Sci. 2025. PMID: 40384855 Free PMC article.
-
The Role of FGF19 and MALRD1 in Enterohepatic Bile Acid Signaling.Front Endocrinol (Lausanne). 2022 Jan 18;12:799648. doi: 10.3389/fendo.2021.799648. eCollection 2021. Front Endocrinol (Lausanne). 2022. PMID: 35116006 Free PMC article. Review.
-
m6A Modification-Mediated DUXAP8 Regulation of Malignant Phenotype and Chemotherapy Resistance of Hepatocellular Carcinoma Through miR-584-5p/MAPK1/ERK Pathway Axis.Front Cell Dev Biol. 2021 Dec 9;9:783385. doi: 10.3389/fcell.2021.783385. eCollection 2021. Front Cell Dev Biol. 2021. PMID: 34957112 Free PMC article.
References
-
- Bray F, Ferlay J, Soerjomataram I, Siegel RL, Torre LA, Jemal A. Global cancer statistics 2018: GLOBOCAN estimates of incidence and mortality worldwide for 36 cancers in 185 countries. CA Cancer J Clin. 2018;68(6):394–424. - PubMed
-
- Testino G, Leone S, Patussi V, Scafato E, Borro P. Hepatocellular carcinoma: diagnosis and proposal of treatment. Minerva Med. 2016;107(6):413–26. - PubMed
-
- Varnholt H, Drebber U, Schulze F, Wedemeyer I, Schirmacher P, Dienes HP. et al. MicroRNA gene expression profile of hepatitis C virus-associated hepatocellular carcinoma. Hepatology. 2008;47(4):1223–32. - PubMed
LinkOut - more resources
Full Text Sources
Miscellaneous
