

Small extracellular vesicles modulated by αVβ3 integrin induce neuroendocrine differentiation in recipient cancer cells
- PMID: 32922691
- PMCID: PMC7448905
- DOI: 10.1080/20013078.2020.1761072
Small extracellular vesicles modulated by αVβ3 integrin induce neuroendocrine differentiation in recipient cancer cells
Abstract
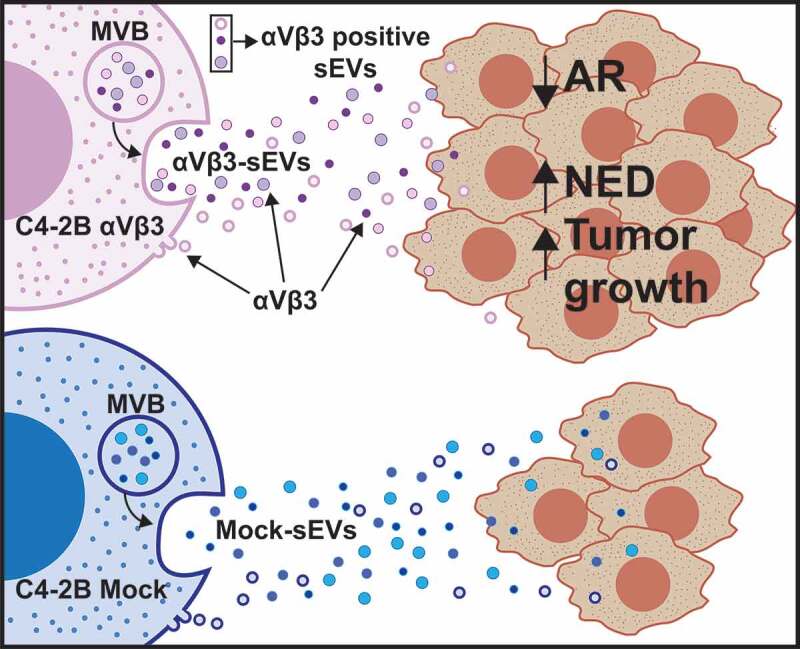
The ability of small extracellular vesicles (sEVs) to reprogram cancer cells is well established. However, the specific sEV components able to mediate aberrant effects in cancer cells have not been characterized. Integrins are major players in mediating sEV functions. We have previously reported that the αVβ3 integrin is detected in sEVs of prostate cancer (PrCa) cells and transferred into recipient cells. Here, we investigate whether sEVs from αVβ3-expressing cells affect tumour growth differently than sEVs from control cells that do not express αVβ3. We compared the ability of sEVs to stimulate tumour growth, using sEVs isolated from PrCa C4-2B cells by iodixanol density gradient and characterized with immunoblotting, nanoparticle tracking analysis, immunocapturing and single vesicle analysis. We incubated PrCa cells with sEVs and injected them subcutaneously into nude mice to measure in vivo tumour growth or analysed in vitro their anchorage-independent growth. Our results demonstrate that a single treatment with sEVs shed from C4-2B cells that express αVβ3, but not from control cells, stimulates tumour growth and induces differentiation of PrCa cells towards a neuroendocrine phenotype, as quantified by increased levels of neuroendocrine markers. In conclusion, the expression of αVβ3 integrin generates sEVs capable of reprogramming cells towards an aggressive phenotype.
Keywords: Prostate cancer; aurora kinase A; iodixanol density gradient; synaptophysin; tumour growth.
© 2020 The Author(s). Published by Informa UK Limited, trading as Taylor & Francis Group on behalf of The International Society for Extracellular Vesicles.
Conflict of interest statement
No potential conflict of interest was reported by the author(s). George Daaboul is CSO and co-founder of NanoView Bioscience.
Figures


Similar articles
-
Expression of the αVβ3 integrin affects prostate cancer sEV cargo and density and promotes sEV pro-tumorigenic activity in vivo through a GPI-anchored receptor, NgR2.J Extracell Vesicles. 2024 Aug;13(8):e12482. doi: 10.1002/jev2.12482. J Extracell Vesicles. 2024. PMID: 39105261 Free PMC article.
-
The αvβ6 integrin in cancer cell-derived small extracellular vesicles enhances angiogenesis.J Extracell Vesicles. 2020 May 20;9(1):1763594. doi: 10.1080/20013078.2020.1763594. eCollection 2020. J Extracell Vesicles. 2020. PMID: 32595914 Free PMC article.
-
Small extracellular vesicle-mediated ITGB6 siRNA delivery downregulates the αVβ6 integrin and inhibits adhesion and migration of recipient prostate cancer cells.Cancer Biol Ther. 2022 Dec 31;23(1):173-185. doi: 10.1080/15384047.2022.2030622. Cancer Biol Ther. 2022. PMID: 35188070 Free PMC article.
-
Pancreatic Cancer Small Extracellular Vesicles (Exosomes): A Tale of Short- and Long-Distance Communication.Cancers (Basel). 2021 Sep 28;13(19):4844. doi: 10.3390/cancers13194844. Cancers (Basel). 2021. PMID: 34638330 Free PMC article. Review.
-
Therapeutic Application of Small Extracellular Vesicles (sEVs): Pharmaceutical and Pharmacokinetic Challenges.Biol Pharm Bull. 2020;43(4):576-583. doi: 10.1248/bpb.b19-00831. Biol Pharm Bull. 2020. PMID: 32238700 Review.
Cited by
-
Irradiation of prostate cancer alters circulating small extracellular vesicle functions.Sci Rep. 2025 Jul 2;15(1):23217. doi: 10.1038/s41598-025-03329-5. Sci Rep. 2025. PMID: 40603896 Free PMC article.
-
Integrins regulate stemness in solid tumor: an emerging therapeutic target.J Hematol Oncol. 2021 Oct 29;14(1):177. doi: 10.1186/s13045-021-01192-1. J Hematol Oncol. 2021. PMID: 34715893 Free PMC article. Review.
-
The ELAVL3/MYCN positive feedback loop provides a therapeutic target for neuroendocrine prostate cancer.Nat Commun. 2023 Nov 28;14(1):7794. doi: 10.1038/s41467-023-43676-3. Nat Commun. 2023. PMID: 38016952 Free PMC article.
-
Extracellular vesicle-cell adhesion molecules in tumours: biofunctions and clinical applications.Cell Commun Signal. 2023 Sep 21;21(1):246. doi: 10.1186/s12964-023-01236-8. Cell Commun Signal. 2023. PMID: 37735659 Free PMC article. Review.
-
A functional outside-in signaling network of proteoglycans and matrix molecules regulating autophagy.Matrix Biol. 2021 Jun;100-101:118-149. doi: 10.1016/j.matbio.2021.04.001. Epub 2021 Apr 7. Matrix Biol. 2021. PMID: 33838253 Free PMC article.
References
-
- Thery C, Amigorena S, Raposo G, et al. Isolation and characterization of exosomes from cell culture supernatants and biological fluids. Curr Protoc Cell Biol. 2006;30:3.22.1–3.22.29 by John Wiley & Sons, Inc. - PubMed
Grants and funding
LinkOut - more resources
Full Text Sources
Miscellaneous
