. 2020 Jul 21;11(8):4491-4508.
doi: 10.1364/BOE.399020. eCollection 2020 Aug 1.

Deep learning-based cell identification and disease diagnosis using spatio-temporal cellular dynamics in compact digital holographic microscopy

Affiliations

Deep learning-based cell identification and disease diagnosis using spatio-temporal cellular dynamics in compact digital holographic microscopy

Timothy O'Connor et al. Biomed Opt Express. .

Abstract

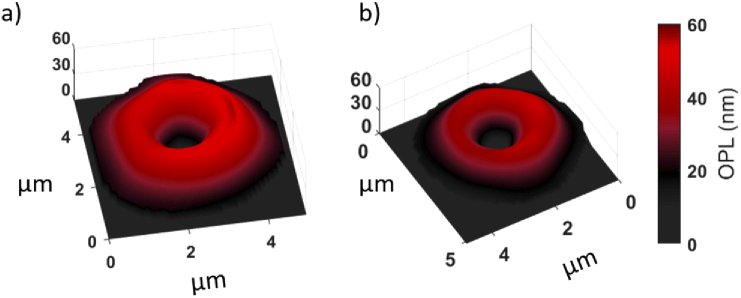
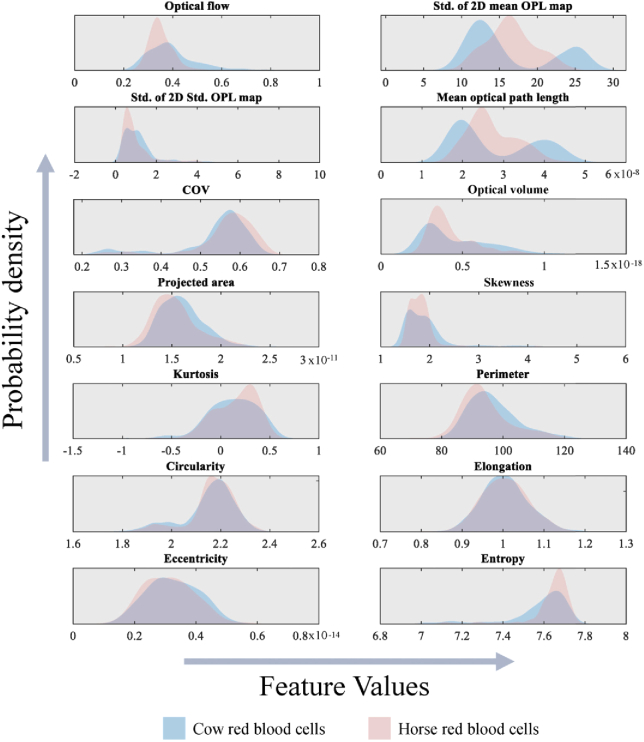
We demonstrate a successful deep learning strategy for cell identification and disease diagnosis using spatio-temporal cell information recorded by a digital holographic microscopy system. Shearing digital holographic microscopy is employed using a low-cost, compact, field-portable and 3D-printed microscopy system to record video-rate data of live biological cells with nanometer sensitivity in terms of axial membrane fluctuations, then features are extracted from the reconstructed phase profiles of segmented cells at each time instance for classification. The time-varying data of each extracted feature is input into a recurrent bi-directional long short-term memory (Bi-LSTM) network which learns to classify cells based on their time-varying behavior. Our approach is presented for cell identification between the morphologically similar cases of cow and horse red blood cells. Furthermore, the proposed deep learning strategy is demonstrated as having improved performance over conventional machine learning approaches on a clinically relevant dataset of human red blood cells from healthy individuals and those with sickle cell disease. The results are presented at both the cell and patient levels. To the best of our knowledge, this is the first report of deep learning for spatio-temporal-based cell identification and disease detection using a digital holographic microscopy system.


Conflict of interest statement

The authors declare no conflicts of interest.

Figures

Fig. 1.
Fig. 1.
(a) Optical schematic of lateral shearing digital holographic microscope. (b) 3D-printed microscope used for data collection.
Fig. 2.
Fig. 2.
Explanatory diagram of the Bi-LSTM network architecture. (a) Shows the general overview of the network structure starting from the input feature vectors at each time step, xt, which are fed through the Bi-LSTM layer enclosed by the dashed box. The output of the Bi-LSTM layer feeds to a fully connected layer followed by a softmax then classification layer. (b) Shows a close-up look at an individual LSTM block of the network. Internal operation of the LSTM block is discussed in the paragraph below.
Fig. 3.
Fig. 3.
Flow chart depicting an overview of the deep learning-based cell and disease identification system. Video holograms of biological samples are recorded using the system depicted in Fig. 1. Following data acquisition, each time frame is reconstructed, and individual cells are segmented. Features are extracted from the segmented cells and input into a Long Short-Term Memory network for classification. xt and ht denote the input and output through a portion of an LSTM network at time-step t.
Fig. 4.
Fig. 4.
Segmented digital holographic reconstructions of (a) cow, and (b) horse red blood cells, with noted similarity in both size and shape. Video reconstructions for each cell are available online.
Fig. 5.
Fig. 5.
Probability density functions of each hand-crafted feature for cow (blue curve) and horse (red curve) red blood cells. Mean optical path length is reported in meters, projected area in meters squared, optical volume in cubic meters, and all other features in arbitrary units.
Fig. 6.
Fig. 6.
Receiving operating characteristic (ROC) curves for classification between cow and horse red blood cells.
Fig. 7.
Fig. 7.
Segmented digital holographic reconstructions of (a) healthy red blood cell, and (b) sickle cell disease red blood cell. Note, sickle cell disease red blood cells can have various degrees of deformity and may present morphologically similar to healthy RBCs. Video reconstructions for each cell available online.
Fig. 8.
Fig. 8.
Probability density functions of each feature for healthy (blue curve) and sickle cell disease (red curve) red blood cells. Mean optical path length is reported in meters, projected area in meters squared, optical volume in cubic meters, and all other features in arbitrary units.
Fig. 9.
Fig. 9.
Receiving operating characteristic curves (ROC) for classification between healthy and SCD red blood cells.

References

    1. Schnars U., Jueptner W., Digital Holography: Digital Hologram Recording, Numerical Reconstruction, and Related Techniques (Springer, 2005).
    1. Anand A., Chhaniwal V., Patel N., Javidi B., “Automatic Identification of Malaria-Infected RBC With Digital Holographic Microscopy Using Correlation Algorithms,” IEEE Photonics J. 4(5), 1456–1464 (2012).10.1109/JPHOT.2012.2210199 - DOI
    1. Anand A., Chhaniwal V., Javidi B., “Tutorial: Common path self-referencing digital holographic microscopy,” APL Photonics 3(7), 071101 (2018).10.1063/1.5027081 - DOI
    1. Doblas A., Roche E., Ampudia-Blasco F., Martinez-Corral M., Saavedra G., Garcia-Sucerquia J., “Diabetes screening by telecentric digital holographic microscopy,” J. Microsc. 261(3), 285–290 (2016).10.1111/jmi.12331 - DOI - PubMed
    1. Girshovitz P., Shaked N. T., “Generalized cell morphological parameters based on interferometric phase microscopy and their application to cell life cycle characterization,” Biomed. Opt. Express 3(8), 1757 (2012).10.1364/BOE.3.001757 - DOI - PMC - PubMed

LinkOut - more resources