. 2020 Jun 1;9(1):1771142.
doi: 10.1080/2162402X.2020.1771142.

The metabolic enzyme arginase-2 is a potential target for novel immune modulatory vaccines

Affiliations

The metabolic enzyme arginase-2 is a potential target for novel immune modulatory vaccines

Stine Emilie Weis-Banke et al. Oncoimmunology. .

Abstract

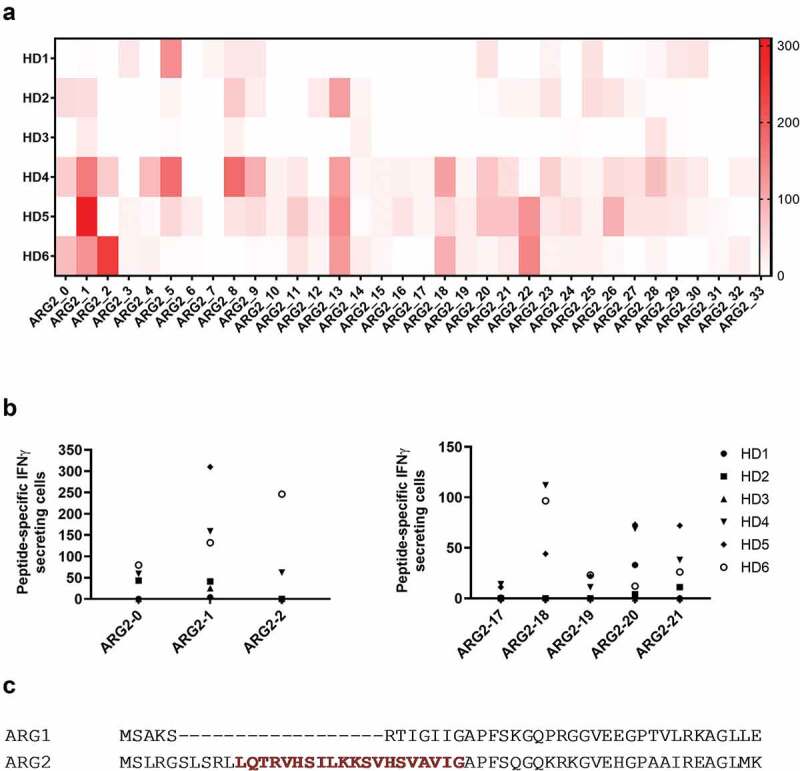
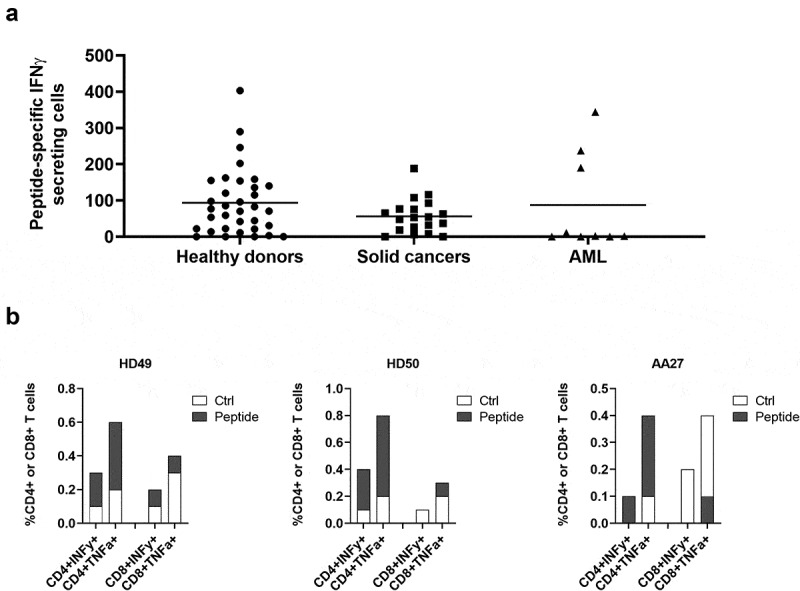
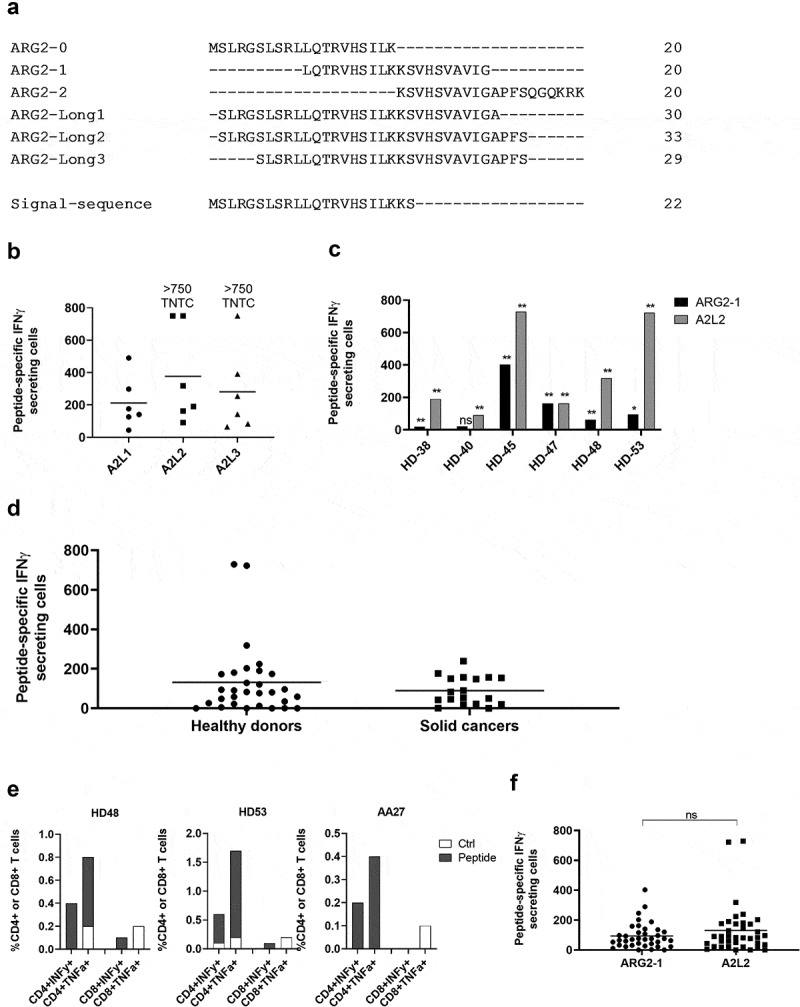
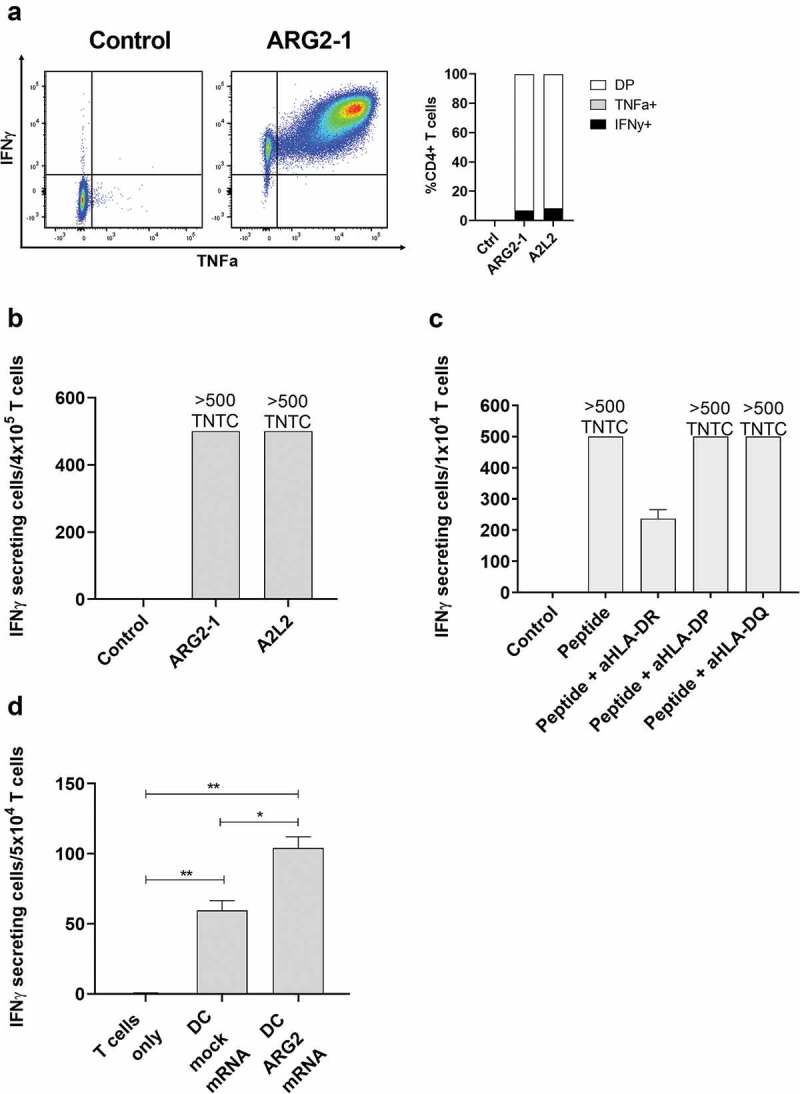
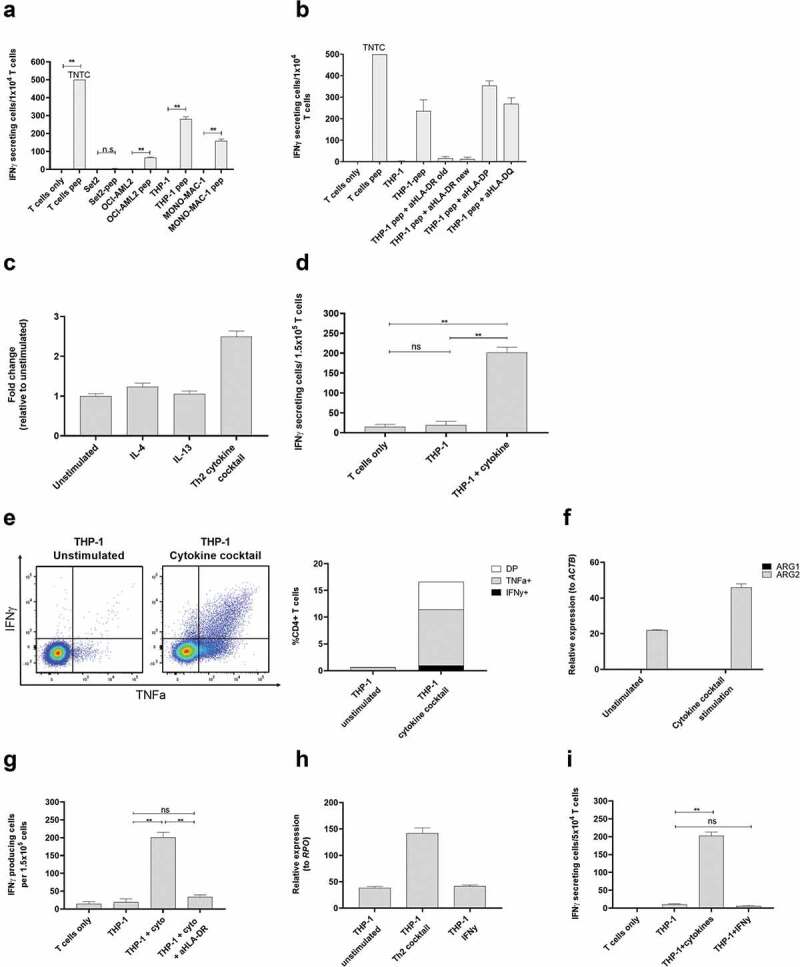
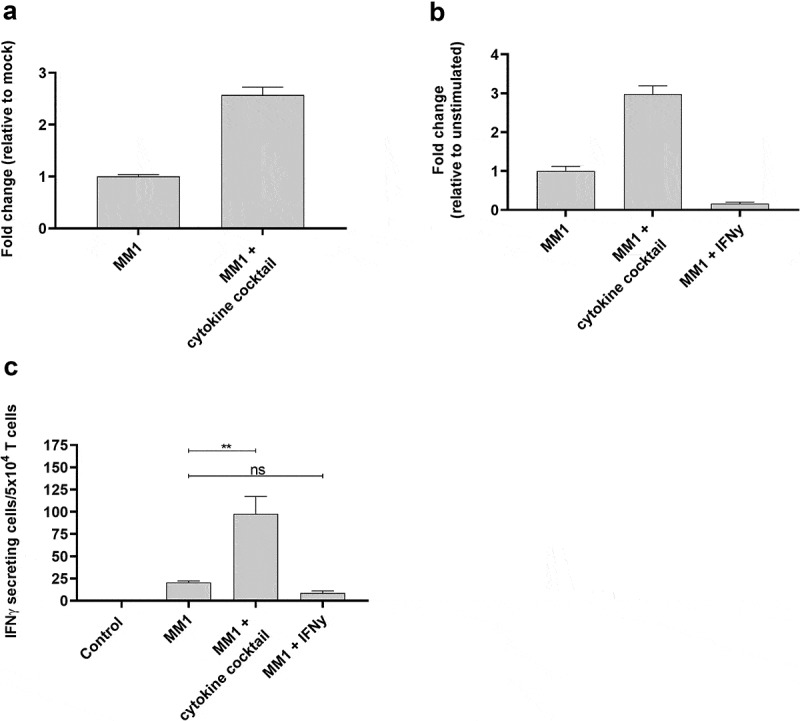
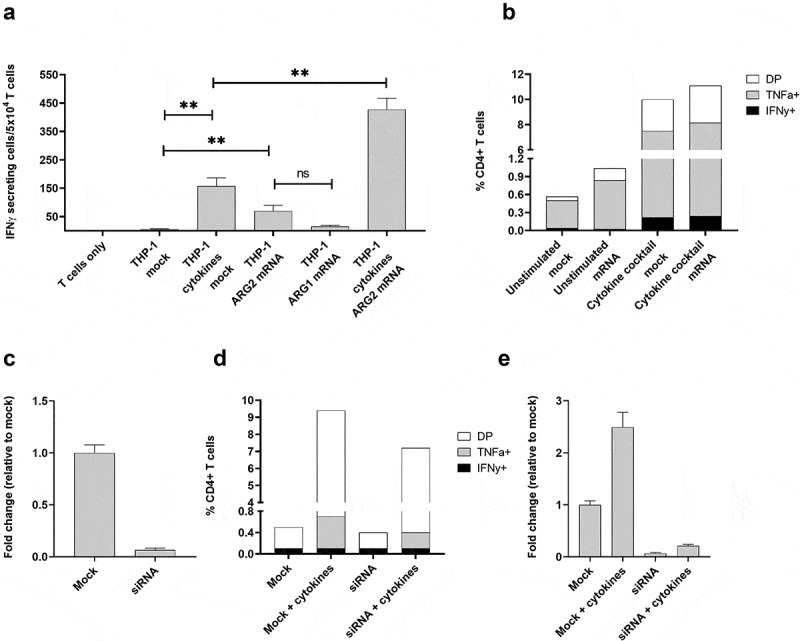
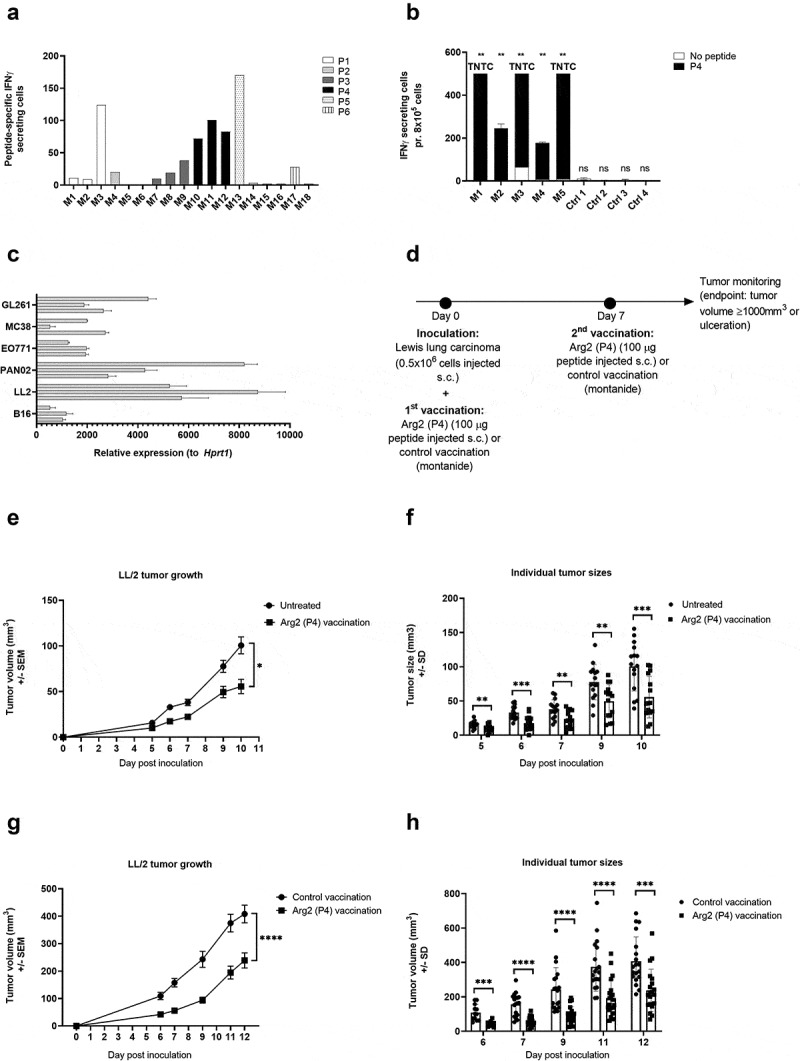
One way that tumors evade immune destruction is through tumor and stromal cell expression of arginine-degrading enzyme arginase-2 (ARG2). Here we describe the existence of pro-inflammatory effector T-cells that recognize ARG2 and can directly target tumor and tumor-infiltrating cells. Using a library of 34 peptides covering the entire ARG2 sequence, we examined reactivity toward these peptides in peripheral blood mononuclear cells from cancer patients and healthy individuals. Interferon-γ ELISPOT revealed frequent immune responses against several of the peptides, indicating that ARG2-specific self-reactive T-cells are natural components of the human T-cell repertoire. Based on this, the most immunogenic ARG2 protein region was further characterized. By identifying conditions in the microenvironment that induce ARG2 expression in myeloid cells, we showed that ARG2-specific CD4T-cells isolated and expanded from a peripheral pool from a prostate cancer patient could recognize target cells in an ARG2-dependent manner. In the 'cold' in vivo tumor model Lewis lung carcinoma, we found that activation of ARG2-specific T-cells by vaccination significantly inhibited tumor growth. Immune-modulatory vaccines targeting ARG2 thus are a candidate strategy for cancer immunotherapy.

Keywords: ARG2; Anti-Tregs; T-win; immune modulation.


Conflict of interest statement

MHA has made an invention based on the use of ARG2 for vaccinations. The rights of the invention have been transferred to Copenhagen University Hospital Herlev, according to the Danish Law of Public Inventions at Public Research Institutions. The capital region has licensed the rights to the company IO Biotech ApS, whose purpose is to develop immune-modulating vaccines for cancer treatments. The patent application was filed by IO Biotech ApS. MHA is a shareholder and board member of IO Biotech ApS. IMS is a shareholder of IO Biotech ApS. EM and AWP are employed at IO Biotech ApS.

Figures

Figure 1.
Figure 1.
Multiple ARG2 peptides are recognized by PBMCs from healthy donors. (a) IFNγ ELISPOT screening of responses against overlapping 20-mer ARG2 peptides from six healthy donors. 4–4.5 × 105 cells were plated per well, and peptide and control stimulation were performed in duplicate or triplicate. Specific spot counts (peptide-specific IFNγ-secreting cells) are given as the difference in number of IFNγ spots between averages of the wells stimulated with peptide and control wells. (b) IFNγ ELISPOT responses from the screening toward the peptides here covering the signal peptide region of ARG2 (left; ARG2-0, ARG2-1, ARG2-2) or the peptides located in the region corresponding to the most immunogenic region of the ARG1 sequence (right; ARG2-17, ARG2-18, ARG2-19, ARG2-20 og ARG2-21). (c) Alignment of ARG1 and ARG2 amino acid sequence around the ARG2-1 sequence. The ARG2-1 sequence is highlighted and marked in red.
Figure 2.
Figure 2.
ARG2-1 is widely recognized by PBMCs from both healthy donors and cancer patients with solid tumors or AML. (a) IFNγ ELISPOT responses against ARG2-1 peptide in PBMCs from healthy donors (n = 33), cancer patients with solid tumors (n = 19), or cancer patients with AML (n = 19). 3–4 × 105 cells were plated per well. Peptide and control stimulations were performed in triplicate. Each spot represents one donor and is the number of peptide-specific IFNγ-secreting cells (the difference between the average of wells stimulated with peptide and control wells). (b) Representative intracellular cytokine staining for IFNγ and TFNα production in samples from healthy donors (HD49 and HD50) and a cancer patient (AA27) with solid tumors stimulated with ARG2-1 or non-stimulated control.
Figure 3.
Figure 3.
The long ARG2 peptide A2L2 elicits strong and frequent CD4 + T-cell responses in samples from healthy donors and cancer patients. (a) Aligned peptide sequences of the library peptides ARG2-0, ARG2-1, and ARG2-2 and the long peptides ARG2-Long1 (A2L1), ARG2-Long2 (A2L2), and ARG2-Long3 (A2L3). The signal sequence of ARG2 is shown for comparison. (b) IFNγ ELISPOT responses against the long peptides A2L1, A2L2, and A2L3 in PBMCs from six healthy donors. 4 × 105 cells were plated per well, and peptide and control stimulation were performed in triplicate. Specific spot counts (peptide-specific IFNγ-secreting cells) are given as the difference in number of IFNγ spots between averages of the wells stimulated with peptide and control wells. Responses against peptide were too numerous to count (TNTC) in 3 settings and set to be >750 spots. (c) IFNγ ELISPOT responses to A2L2 and ARG2-1 in PBMCs from 6 healthy donors. 4 × 105 cells were plate per well, and peptide and control stimulation were performed in triplicate. Specific spot counts (peptide-specific IFNγ-secreting cells) are given as the difference in number of IFNγ spots between averages of the wells stimulated with peptide and control wells. * p ≤ 0.05 or ** p ≤ 0.01 according to the distribution free resampling rule. (d) IFNγ ELISPOT responses against A2L2 peptide in PBMCs from healthy donors (n = 30) and cancer patients with solid tumors (n = 18). 3–4 × 105 cells were plated per well. Peptide and control stimulations were performed in triplicate. Each spot represents one donor and is the number of peptide-specific IFNγ-secreting cells (the difference between the average of wells stimulated with peptide and control wells). (e) Representative intracellular cytokine staining for IFNγ and TFNα production in samples from healthy donors (HD48 and HD53) and a cancer patient (AA27) with solid tumors stimulated with A2L2 or non-stimulated control. (f) FNγ ELISPOT responses to ARG2-1 and A2L2 in PBMCs from healthy donors (n = 26) and cancer patients with solid tumors (n = 11) for comparison of the magnitude of responses to the two peptides. 4 × 105 cells were plated per well, and peptide and control stimulation were performed in triplicate. Specific spot counts (peptide-specific IFNγ-secreting cells) are given as the difference in number of IFNγ spots between averages of the wells stimulated with peptide and control wells. ns: p = .7038.
Figure 4.
Figure 4.
ARG2-specific T-cells recognize ARG2-expressing dendritic cells. (a) ARG2-specific T-cells were expanded from samples from a patient with prostate cancer. The specificity of the T-cell culture was assessed by intracellular cytokine staining for TFNα and IFNγ production in peptide-stimulated cells and a non-stimulated control. Left: Dot plot for ARG2-1 peptide-stimulated and non-stimulated (control) cells. Right: % CD4 T-cells producing IFNγ, TFNα, or both (DP: double positive) in response to control stimulation (no peptide), ARG2-1 peptide stimulation, or A2L2 peptide stimulation. (b) Specificity of the ARG2-specific T-cells assessed by ELISPOT responses to control stimulation (no peptide), ARG2-1 peptide, or A2L2 peptide. 4 × 104 cells were plated per well. TNTC, too numerous to count (more than 500 spots). (c) he HLA-restriction of ARG2-specific T-cells were examined. IFNγ ELISPOT response of the ARG2-specific T-cells toward ARG2-1 peptide in the presence of different class II blockers. (d) IFNγ ELISPOT response by the ARG2-specific T-cells to autologous dendritic cells transfected with irrelevant control mRNA (mock mRNA) or ARG2 mRNA. Effector-to-target ratio 5:1 with 5 × 104 effector cells plated per well. * p ≤ 0.05 or ** p ≤ 0.01 according to the distribution free resampling rule.
Figure 5.
Figure 5.
ARG2-specific T-cells recognize ARG2-expressing malignant myeloid cells. (a) To identify HLA-matched malignant T-cells, the ARG2-specific T-cells were examined in IFNγ ELISPOT response toward different relevant cancer cell lines pre-pulsed with ARG2-1 peptide. The same cancer cell lines without peptide stimulation were examined as control. Effector-to-target ratio 1:1 with 1 × 104 effector cells plated per well. * p ≤ 0.05 or ** p ≤ 0.01 according to the distribution free resampling rule. TNTC, too numerous to count (>500). (b) FNγ ELISPOT response of the ARG2-specific T-cells toward THP-1 cells pulsed with ARG2-1 peptide and class II blockers. (c) ARG2 expression in THP-1 evaluated by RT-qPCR following 48-h incubation of THP-1 cells with different cytokines. Data are represented as fold change vs unstimulated THP-1 cells; mean+SD, n = 4. (d) FNγ ELISPOT response of the ARG2-specific T-cells toward THP-1 cells stimulated with the cytokine cocktail. Effector-to-target ratio 5:1 with 1.5 × 105 effector cells plated per well. ** p ≤ 0.01 and ns = not significant according to the distribution free resampling rule. (e) Intracellular staining of TFNα and IFNγ production from CD4 + T-cells in the ARG2-specific T-cell culture when incubated with unstimulated THP-1 cells or THP-1 cells pre-stimulated with cytokine cocktail for 48 h. Effector-to-target ratio 2:1 with 500,000 effector cells used per condition. (f) RG1 and ARG2 expression in THP-1 cells evaluated by RT-qPCR following 48-h incubation with cytokine cocktail. Unstimulated THP-1 cells served as control. Data are represented as relative expression to the housekeeping gene ACTB; mean+SD, n = 4. (g) IFNγ ELISPOT response of the ARG2-specific T-cells toward THP-1 cells stimulated with the cytokine cocktail (THP-1 + cyto) and the class II blocker, aHLA-DR. Effector-to-target ratio 5:1 with 1.5 × 105 effector cells plated per well. ** p ≤ 0.01 and ns = not significant according to the distribution free resampling rule. (h) ARG2 expression in THP-1 cells evaluated by RT-qPCR following 48-h stimulation with cytokine cocktail (Th2 cocktail) or IFNγ. Unstimulated THP-1 cells were included as control. Data are represented as relative expression to the housekeeping gene RPO; mean+SD, n = 4. (i) IFNγ ELISPOT response of the ARG2-specific T-cells toward THP-1 cells pre-stimulated with the cytokine cocktail (THP-1 + cytokines) or IFNγ (THP-1 + IFNγ). Effector-to-target ratio 2.5:1 with 5 × 104 effector cells plated per well. ** p ≤ 0.01 and ns = not significant according to the distribution free resampling rule.
Figure 6.
Figure 6.
ARG2-specific T-cells recognize several ARG2-expressing malignant myeloid cells. (a) RG2 expression in MONO-MAC-1 (MM1) cells evaluated by RT-qPCR following a 48-h incubation with cytokine cocktail. Data are represented as fold change vs unstimulated MM1 cells; mean+SD, n = 4. (b) ARG2 expression in MM1 cells evaluated by RT-qPCR following a 48-h incubation with cytokine cocktail or IFNγ. Data are represented as fold change vs unstimulated MM1 cells; mean+SD, n = 4. (c) IFNγ ELISPOT response of the ARG2-specific T-cells toward MM1 cells pre-stimulated with the cytokine cocktail (MM1 + cytokine cocktail) or IFNγ (MM1 + IFNγ). Effector-to-target ratio 2.5:1 with 5 × 104 effector cells plated per well. ** p ≤ 0.01 and n = not significant according to the distribution free resampling rule.
Figure 7.
Figure 7.
The recognition of ARG2-expressing cells by ARG2-specific T-cells dependent on the level of ARG2 expression in addition to the antigen-processing apparatus of the target T-cells. (a) IFNγ ELISPOT response of the ARG2-specific T-cells toward THP-1 cells unstimulated or pre-stimulated with the cytokine cocktail and mock transfected or transfected with ARG1 or ARG2 mRNA. Effector-to-target ratio 2.5:1 with 5 × 104 effector cells plated per well. ** p ≤ 0.01 and ns = not significant according to the distribution free resampling rule. (b) Intracellular staining of TFNα and IFNγ production from CD4 + T-cells in the ARG2-specific T-cell culture when incubated with unstimulated THP-1 cells or THP-1 cells pre-stimulated with cytokine cocktail followed by either mock (mock) or ARG2 mRNA (mRNA) transfection. Effector-to-target ratio 2:1 with 500,000 effector cells used per condition. DP: Double Positive. (c) ARG2 expression in THP-1 cells evaluated by RT-qPCR at 48 h post transfection with ARG2-specific siRNA. Data are represented as fold change vs mock-transfected THP-1 cells; mean+SD, n = 4. (d) Intracellular staining of TFNα and IFNγ production from CD4 + T-cells in the ARG2-specific T-cell culture when incubated with mock- or siRNA-transfected cells kept under unstimulated or cytokine cocktail stimulated conditions for 48 h prior to setup. Effector-to-target ratio 2:1 with 500,000 effector cells used per condition. (e) ARG2 expression in THP-1 cells evaluated by RT-qPCR at 48 h post transfection with ARG2-specific siRNA followed by cytokine cocktail stimulation. Data are represented as fold change vs unstimulated mock-transfected THP-1 cells; mean+SD, n = 4.
Figure 8.
Figure 8.
ARG2 vaccination results on LL/2 tumor growth delay. (a) Murine IFNy ELISPOT screening of PBMCs from the spleens of C57BL/6 mice vaccinated with one of six different predicted ARG2 epitopes. 8*10^5 cells were plated pr. well and peptide and control stimulation were performed in triplicates. Specific spot counts (peptide-specific IFNy secreting cells) are given as the difference in number of IFNy spots between averages of the wells stimulated with peptide and control wells. (b) Murine IFNy ELISPOT of PBMCs from the spleen of C57BL/6 mice vaccinated with ARG2 peptide P4 (M1-M5) or a control vaccination (Ctrl1-4). 8*10^5 cells were plated pr. well and peptide and control stimulation were performed in triplicates. Specific spot counts (peptide-specific IFNy secreting cells) are given as the difference in number of IFNy spots between averages of the wells stimulated with peptide and control wells.(c) ARG2 expression in engrafted tumors of different origin in C57BL/6 background. 3 engrafted tumors were evaluated pr. tumor type. Data are represented as relative expression to the housekeeping gene Hprt1, mean+SD, n = 3. (d) Treatment schedule for ARG2 (P4) vaccination in Lewis lung carcinoma (LL/2) challenged mice. On day 0, 0.5*10^6 LL/2 tumor cells were injected subcutaneously in the right flank of female C57BL/6 mice. Hereafter, mice were left untreated or received either control vaccination or ARG2 vaccination on day 0 and 7. (e) Average growth of LL/2 tumors in untreated or ARG2 (P4) vaccinated mice (n = 15 for each group). Female C57BL/6 mice were inoculated with LL/2 cells and were left untreated or received ARG2 (P4) vaccination on day 0 and 7, as indicated in (d). Error bars indicate the standard error of the mean (SEM). * = p = .013 (Two-way ANOVA with Bonferroni correction). (f) Individual tumor sizes from the treatment groups described in (e). Error bars indicate the standard deviation (SD). *** = p ≤ 0.001 (Two-tailed Student t-test). (g) Average tumor growth of LL/2 tumors in control vaccinated or ARG2 (P4) vaccinated mice (n = 20 for each group). Female C57BL/6 mice were inoculated with LL/2 cells and received either control vaccination or ARG2 (P4) vaccination on day 0 and 7, as indicated in (d). Error bars indicate the standard error of the mean (SEM). **** = p ≤ 0.0001 (Two-way ANOVA with Bonferroni correction). (h) Individual tumor sizes from the treatment groups described in (g). Error bars indicate the standard deviation (SD). **** = p ≤ 0.0001 (Two-tailed Student t-test).

References

    1. Wu AA, Drake V, Huang HS, Chiu S, Zheng L.. Reprogramming the tumor microenvironment: tumor-induced immunosuppressive factors paralyze T cells. Oncoimmunology. 2015;4(7):e1016700. doi:10.1080/2162402X.2015.1016700. - DOI - PMC - PubMed
    1. Caldwell RB, Toque HA, Narayanan SP, Caldwell RW. Arginase: an old enzyme with new tricks. Trends Pharmacol Sci. 2015;36(6):395–16. doi:10.1016/j.tips.2015.03.006. - DOI - PMC - PubMed
    1. Bronte V, Zanovello P. Regulation of immune responses by L-arginine metabolism. Nat.Rev.Immunol. 2005;5(8):641–654. doi:10.1038/nri1668. - DOI - PubMed
    1. Bronte V, Kasic T, Gri G, Gallana K, Borsellino G, Marigo I, Battistini L, Iafrate M, Prayer-Galetti T, Pagano F, et al. Boosting antitumor responses of T lymphocytes infiltrating human prostate cancers. J.Exp.Med. 2005;201(8):1257–1268. doi:10.1084/jem.20042028. - DOI - PMC - PubMed
    1. Mondanelli G, Bianchi R, Pallotta MT, Orabona C, Albini E, Iacono A, Belladonna ML, Vacca C, Fallarino F, Macchiarulo A, et al. A relay pathway between arginine and tryptophan metabolism confers immunosuppressive properties on dendritic cells. Immunity. 2017;46(2):233–244. doi:10.1016/j.immuni.2017.01.005. - DOI - PMC - PubMed

Publication types