. 2020 Aug 20;9(1):1806662.
doi: 10.1080/2162402X.2020.1806662.

IDH-mutant gliomas harbor fewer regulatory T cells in humans and mice

Affiliations

IDH-mutant gliomas harbor fewer regulatory T cells in humans and mice

Leland G Richardson et al. Oncoimmunology. .

Abstract

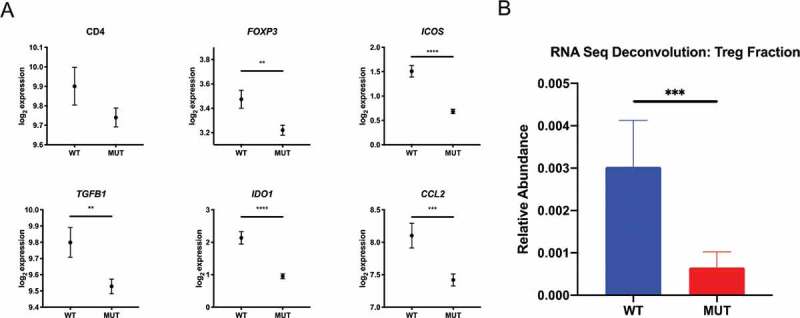
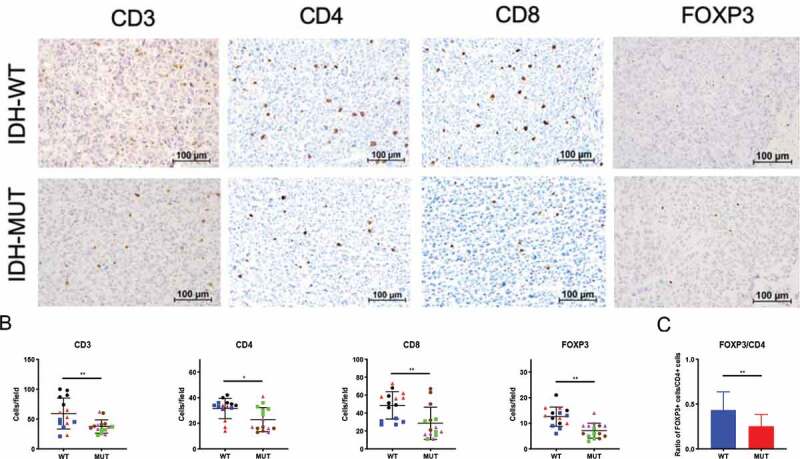
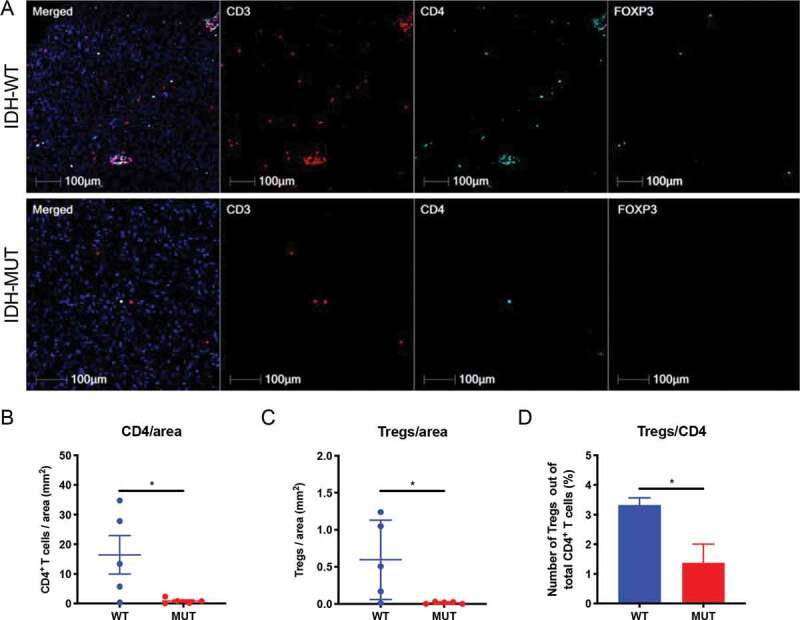
The metabolic gene isocitrate dehydrogenase 1 (IDH1) is commonly mutated in lower grade glioma (LGG) and secondary glioblastoma (GBM). Regulatory T cells (Tregs) play a significant role in the suppression of antitumor immunity in human glioma. Given the importance of Tregs in the overall framework of designing immune-based therapies, a better understanding on their association with IDH mutational status remains of critical clinical importance. Using multispectral imaging analysis, we compared the incidence of Tregs in IDH-mutant and IDH wild-type glioma from patient tumor samples of LGG. An orthotopic IDH-mutant murine model was generated to evaluate the role of mutant IDH on Treg infiltration by immunohistochemistry. When compared to IDH wild-type controls, Tregs are disproportionally underrepresented in mutant disease, even when taken as a proportion of all infiltrating T cells. Our findings suggest that therapeutic agents targeting Tregs may be more appropriate in modulating the immune response to wild-type disease.

Keywords: Glioma; IDH-mutation; Regulatory T cells; immune microenvironment.


Figures

Figure 1.
Figure 1.
Differential gene expression profile of intratumoral Tregs associates with IDH1 status. Using the Xena Functional Genomic Browser, TCGA gene expression data were downloaded for WHO grade II and III glioma cases. IDH wild-type (n = 117) and IDH-mutant (n = 413) cases were compared for differential Treg-associated gene expression and relative Treg abundance using the CIBERSORT algorithm. (a) Lower expression levels of Treg-associated genes and (b) lower relative Treg abundance in IDH-mutant versus IDH-wild type patients. In A, graphs depict the log2 expression value of each gene, each dot represents the mean expression and error bars indicate the SEM for each group. In B, graph depict the mean relative abundance of infiltrating Tregs and error bars indicate the SEM for each group. P-values were determined using two-sided, unpaired t tests; *P < .05; **P < .01; ***P < .001; ****P < .0001.
Figure 2.
Figure 2.
Syngeneic GL261 IDH-mutant murine gliomas demonstrate reduced FoxP3+ cell infiltration. C57BL/6 mice received intracranial injections of 7.5 × 104 GL261 glioma cells stably transduced with cDNA for either wild-type (n = 3) or the R132H (n = 3) form of IDH1. Day-25 tumors were removed from mice and brain tumor sections stained for immunohistochemistry. (a) Representative immunohistochemistry staining for CD3, CD4, CD8 or FoxP3 in both IDH wild-type (top panel) and IDH-mutant (bottom panel) mice. Scale bars, 100 µm. (b) The number of positive cells from 5 fields at 10x magnification per mouse were counted and presented here. Each individual mouse is identified by a symbol and color. (c) FoxP3+ lymphocyte/CD4+ lymphocyte ratio in murine syngeneic IDH-mutant and IDH wild-type gliomas. In B and C, mean and error bars indicate the SD of each group. P-values were determined using 2-sided, unpaired t tests; * p < .05; ** p < .01.
Figure 3.
Figure 3.
Reduced Treg numbers and proportions of Treg/CD4 T cells in WHO grade III IDH-mutant gliomas compared with IDH wild-type glioma. FFPE sections from IDH wild-type (n = 5) and IDH-mutant (n = 5) WHO grade III gliomas were stained for CD3 (Texas Red), CD4 (Aqua), FoxP3 (FITC). The number of CD3+CD4+FoxP3+ triple positive cells from IDH wild-type and IDH-mutant tumors was calculated using HALO imaging analysis software. (a) Representative immunofluorescence images were taken for CD3 (red), CD4 (aqua), FoxP3 (green) either alone or merged in IDH wild-type (top panel) and IDH-mutant (bottom panel) tumors. (b) The number of CD3+CD4+ double positive cells per area (mm2) of tumor was calculated for each specimen. (c) The number of CD3+CD4+FoxP3+ triple positive cells per area (mm2) of tumor was calculated for each specimen. (d) CD3+CD4+FoxP3+ triple positive cells as a percentage of total CD3+CD4+ cells were calculated for each specimen. In B and C, each individual patient is identified by a dot. In B-D, mean and error bars indicate the SD of each group. P-values were determined using 2-sided, unpaired t tests; * p < .05.

Similar articles

Cited by

References

    1. Bastien JI, McNeill KA, Fine HA.. Molecular characterizations of glioblastoma, targeted therapy, and clinical results to date. Cancer. 2015;121(4):502–6. doi:10.1002/cncr.28968. - DOI - PubMed
    1. Stupp R, Mason WP, van den Bent MJ, Weller M, Fisher B, Taphoorn MJ, Belanger K, Brandes AA, Marosi C, Bogdahn U, et al. Radiotherapy plus concomitant and adjuvant temozolomide for glioblastoma. N Engl J Med. 2005;352(10):987–996. doi:10.1056/NEJMoa043330. - DOI - PubMed
    1. Heimberger AB, Abou-Ghazal M, Reina-Ortiz C, Yang DS, Sun W, Qiao W, Hiraoka N, Fuller GN. Incidence and prognostic impact of FoxP3+ regulatory T cells in human gliomas. Clin Cancer Res. 2008;14(16):5166–5172. doi:10.1158/1078-0432.CCR-08-0320. - DOI - PubMed
    1. El Andaloussi A, Lesniak MS. An increase in CD4+CD25+FOXP3+ regulatory T cells in tumor-infiltrating lymphocytes of human glioblastoma multiforme. Neuro-oncology. 2006;8(3):234–243. doi:10.1215/15228517-2006-006. - DOI - PMC - PubMed
    1. Crane CA, Ahn BJ, Han SJ, Parsa AT. Soluble factors secreted by glioblastoma cell lines facilitate recruitment, survival, and expansion of regulatory T cells: implications for immunotherapy. Neuro-oncology. 2012;14(5):584–595. doi:10.1093/neuonc/nos014. - DOI - PMC - PubMed

Publication types

Substances