. 2020 Jul 3;6(27):eaba2735.
doi: 10.1126/sciadv.aba2735. eCollection 2020 Jul.

Engineering bacterial outer membrane vesicles as transdermal nanoplatforms for photo-TRAIL-programmed therapy against melanoma

Affiliations

Engineering bacterial outer membrane vesicles as transdermal nanoplatforms for photo-TRAIL-programmed therapy against melanoma

Li-Hua Peng et al. Sci Adv. .

Abstract

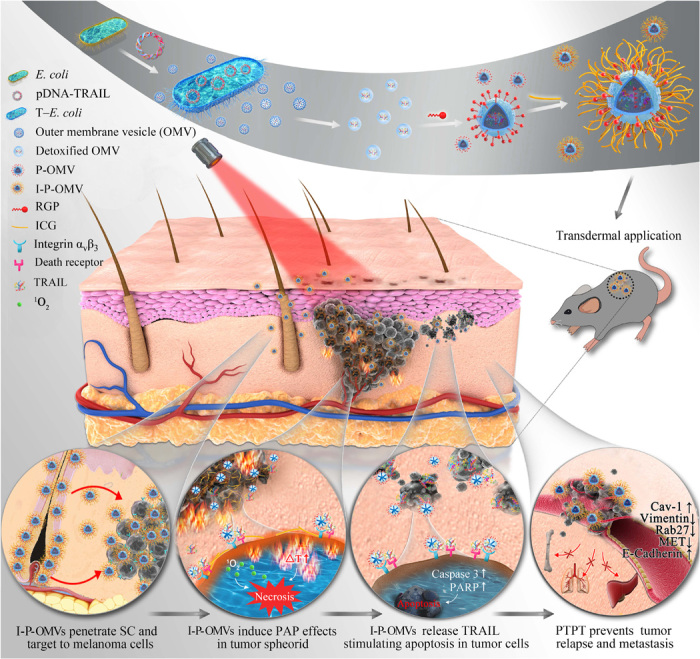
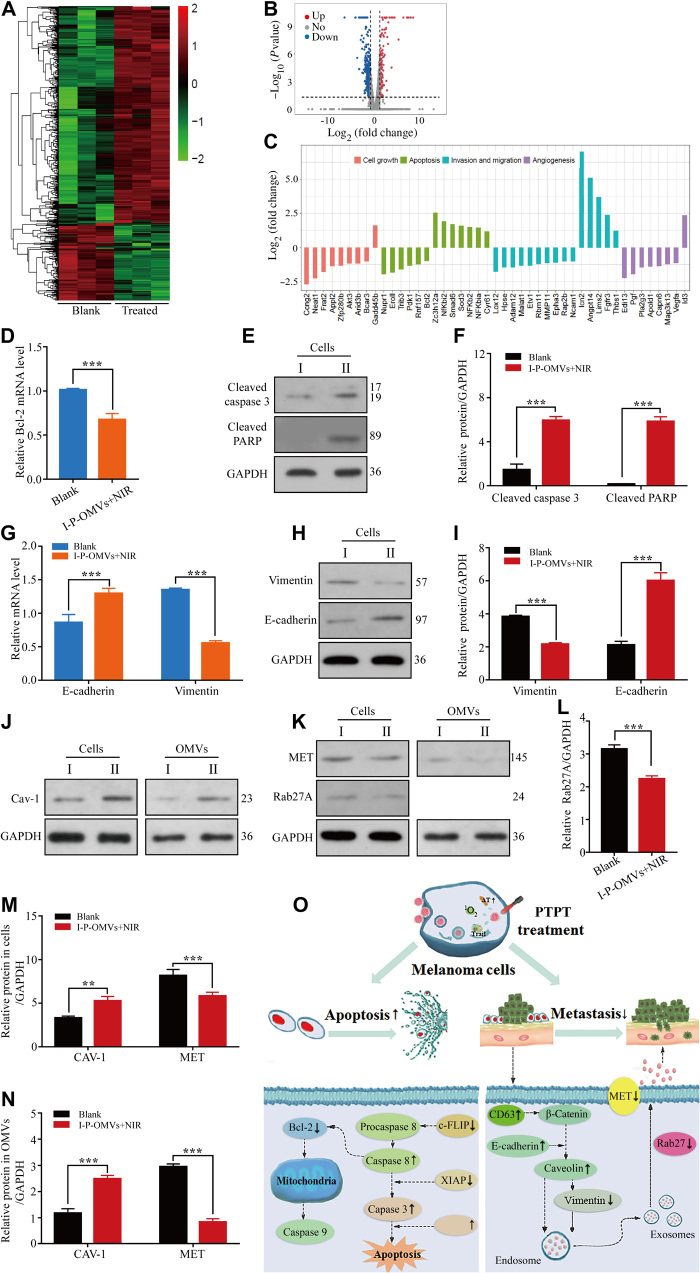
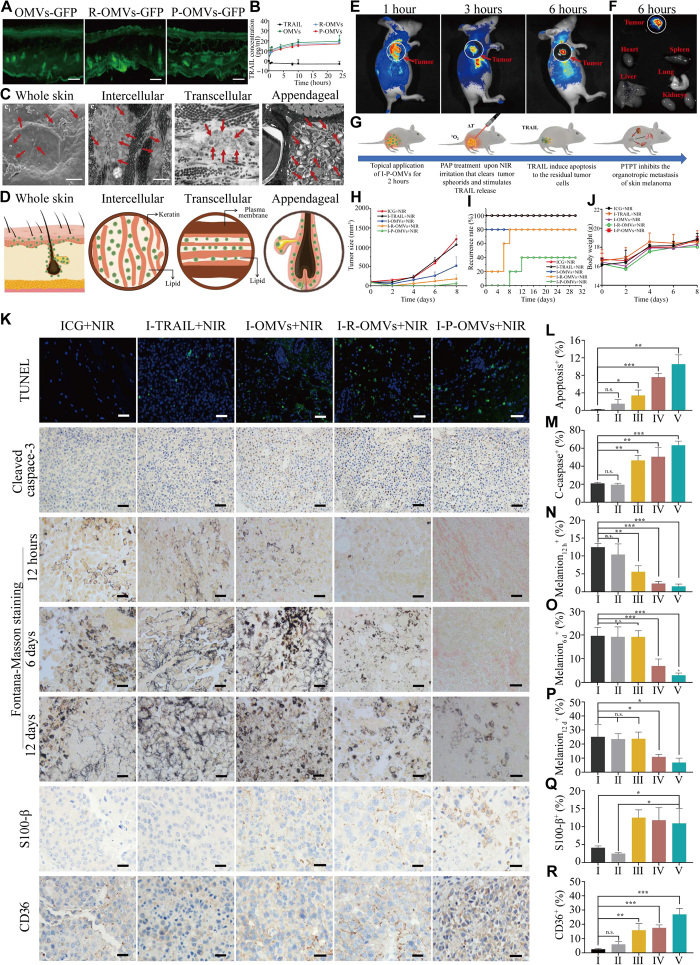
Melanoma is an aggressive cancer with rapid progression, relapse, and metastasis. Systemic therapies for melanoma exhibit limited anticancer potential and high toxicity. Here, we developed the outer membrane vesicles derived from transgenic Escherichia coli, modified with αvβ3 integrin peptide targeting ligand and indocyanine green (named as I-P-OMVs), to induce the transdermal photo-TRAIL-programmed treatment in skin melanoma.-OMVs, which are outer membrane vesicles derived from transgenic Escherichia coli, modified with αvβ3 integrin targeting ligand and indocyanine green (named as I-P-OMVs), to induce the transdermal photo-TRAIL-programmed treatment in skin melanoma. I-P-OMVs exhibited excellent stratum corneum penetration and specificity to melanoma. Upon near-infrared irritation, I-P-OMVs not only induced photothermal-photodynamic responses against primary melanoma spheroids but also activated TRAIL-induced apoptosis in disseminated tumor cells, resulting in a complete eradication of melanoma. I-P-OMVs are the first nanoplatforms to induce transdermal photo-TRAIL-programmed therapy in melanoma with enhanced antitumor performance and high safety, having great potential in cancer therapy.


Figures

Fig. 1
Fig. 1. Schematic design and therapeutic strategy of I-P-OMVs+NIR.
Part I: Preparation of I-P-OMVs. (i) Transformation of E. coli with pDNA-TRAIL (T–E. coli). (ii) Isolation of OMVs from T–E. coli. (iii) Detoxification of OMVs with lysozyme. (iv) Modification of OMVs with RGP forming P-OMVs. (v) Conjugation of ICG to P-OMVs forming I-P-OMVs. Part II: Topical application of I-P-OMVs induces photo-TRAIL treatment in skin melanoma. (i) I-P-OMVs penetrate through skin and target to melanoma. (ii) NIR irritation triggers ICG to induce hyperthermia effect and secret singlet oxygen that clears primary melanoma spheroids promptly. (iii) Photothermal effect induces the deformation of OMVs that release TRAIL, followed by their binding to death receptors in melanoma cells surface, activating the apoptosis in residual melanoma cells. (iv) I-P-OMVs+NIR treatments prevents the metastatic potential of melanoma through interfering the relevant genes and proteins.
Fig. 2
Fig. 2. Construction and characterization of I-P-OMVs.
(A) TEM images of T–E. coli with their derived OMVs. Scale bars, 2 μm and 200 nm. (B) Confocal laser scanning microscopy (CLSM) image of Dil-OMVs. Scale bar, 2 μm. (C) Size distribution of OMVs measured by DLS. (D) WB analysis of S3 protein (a classical protein contained within E. coli) and TRAIL protein in bacterial cells and their derived OMVs. GAPDH, glyceraldehyde-3-phosphate dehydrogenase. (E) Size distribution and (F) zeta potential (ZP) of OMVs, R-OMVs, and P-OMVs. (G) TEM images of OMVs, R-OMVs, and P-OMVs. Scale bars, 200 nm.
Fig. 3
Fig. 3. PAP response, TRAIL release, and infiltration of I-P-OMVs in melanoma spheroids.
(A) Photothermal response of I-P-OMVs (0 to 5 μg/ml) to NIR irritation (2 W/cm2 for 3 min) (n = 3). (B) Changes in the DPBF absorbance spectra in the presence of I-P-OMVs under NIR irradiation (0, 0.6, and 2 W/cm2). (C) DPBF absorbance in the presence of I-P-OMVs at 412 nm under NIR irradiation (0, 0.6, and 2 W/cm2) (n = 3). (D) TRAIL release profiles at 37°C without or with NIR irradiation (2 W/cm2) (n = 3). (E) CLSM images of 3D tumor spheroids incubated with Dil-OMVs, Dil-R-OMVs, and Dil-P-OMVs. (F and G) CM-Dil fluorescence intensity in different depths of 3D tumor spheroids incubated with Dil-OMVs (F), Dil-R-OMVs (F), and Dil-P-OMVs (G). All data are represented as means ± SD. ***P < 0.001 and **P < 0.01.
Fig. 4
Fig. 4. Influence of I-P-OMVs+NIR in behavior of melanoma cells.
(A and B) The viability (A) and apoptosis percentages (B) of B16F10 and A375 cells before and after treatments (n = 6). (C) B16F10 and A375 cells invasion before and after treatments (n = 6). (D) Migration kinetics of cells before and after treatments, as shown by continuous monitoring of live-cell migration. Results shown are means ± SD (n = 3). (E) Changes of converting enzyme-inhibitory protein (c-FLIP) and survivin mRNA levels in B16F10 cells in the Blank, I-P-OMVs, ICG+NIR, and I-P-OMVs+NIR groups (n = 3). (F and G) WB analysis (F) and the quantitative levels (G) of c-FLIP, survivin, cleaved caspase 3, and cleaved caspase 8 in the tested cells (n = 3). All blank groups indicate cells treated by culture medium. All data are represented as means ± SD. ***P < 0.001, **P < 0.01, and *P < 0.05.
Fig. 5
Fig. 5. Cells genetic and proteic alterations in response to I-P-OMVs+NIR.
(A and B) Hierarchical clustering (A) and volcano plots (B) of differentially regulated genes identified at q < 0.05 in B16F10 cells. (C) Categorization of the differentially expressed genes. (D) Bcl-2 gene in the tested B16F10 cells (n = 3). (E and F) WB (E) and pooled data (F) of cleaved caspase 3 and cleaved PARP protein levels in the tested B16F10 cells (n = 3). (G) E-cadherin and vimentin genes in the tested B16F10 cells. (H and I) WB (H) and pooled data (I) of the E-cadherin and vimentin protein levels in the tested B16F10 cells (n = 3). (J) WB of Caveolin-1 (Cav-1) protein level in the tested cells or their derived OMVs (n = 3). (K) WB of mesenchymal-to-epithelial transition (MET) and Rab27A proteins level in the tested cells or their derived OMVs (n = 3). (L to N) Pooled data of Rab27A (L), Cav-1, and MET (M and N) protein levels in the tested cells or their derived OMVs (n = 3). I and II represent the blank and I-P-OMVs+NIR groups, respectively. All blank groups indicate cells treated by culture medium. (O) Schematic illustration of the changes in apoptosis and metastasis related genes upon I-P-OMVs+NIR. All data are represented as means ± SD. ***P < 0.001 and **P < 0.01.
Fig. 6
Fig. 6. Transdermal delivery of I-P-OMVs and antitumor performance of I-P-OMVs+NIR.
(A) The distribution of OMVs-GFP, R-OMVs-GFP, and P-OMVs-GFP in skin slice. Scale bars, 100 nm. (B) The accumulative transdermal amounts of TRAIL protein (n = 3). (C) Scanning electron microscopy (SEM) (c1) and TEM (c2, c3, and c4) images of skin tissues after topical application of DiI-P-OMVs. Scale bars, 1 μm. DiI (1,1′-dioctadecyl-3,3,3′,3′-tetramethylindocarbocyanine perchlorate)–P-OMVs were indicated by red arrows. (D) Schematic illustration of the distribution of OMVs in skin and their transdermal routes. (E) In vivo fluorescence imaging of tumor-bearing mice after topically applied with Dil-P-OMVs. (F) Fluorescent images of tumors and major organs (G) Therapeutic regimen of I-P-OMVs+NIR in mice with B16F10 melanoma. (H to J) The tumors size, relapse rates, and body weights in mice during tested periods. (K) The TUNEL (terminal deoxynucleotidyl transferase–mediated deoxyuridine triphosphate nick end labeling), cleaved caspase 3, Fontana-Masson (12 hours, day 6, and day 12), S100-β (day 12), and CD63 (day 12) staining of tumors. (L to R) Quantification of (K)-positive cells in the tumors (n = 3). Scale bars, 100 nm. I to V represent the ICG+NIR, I-TRAIL+NIR, I-OMVs+NIR, I-R-OMVs+NIR, and I-P-OMVs+NIR groups, respectively. All data are represented as means ± SD. ***P < 0.001, **P < 0.01, and *P < 0.05. n.s., not significant.

References

    1. Nam J., Son S., Park K. S., Zou W., Shea L. D., Moon J. J., Cancer nanomedicine for combination cancer immunotherapy. Nat. Rev. Mater. 4, 398–414 (2019).
    1. Hersey P., Zhang X. D., How melanoma cells evade trail-induced apoptosis. Nat. Rev. Cancer 1, 142–150 (2001). - PubMed
    1. Gu Z., Biswas A., Zhao M., Tang Y., Tailoring nanocarriers for intracellular protein delivery. Chem. Soc. Rev. 40, 3638–3655 (2011). - PubMed
    1. Chen L., Valentine J. L., Huang C.-J., Endicott C. E., Moeller T. D., Rasmussen J. A., Fletcher J. R., Boll J. M., Rosenthal J. A., Dobruchowska J., Wang Z., Heiss C., Azadi P., Putnam D., Trent M. S., Jones B. D., DeLisa M. P., Outer membrane vesicles displaying engineered glycotopes elicit protective antibodies. Proc. Natl. Acad. Sci. U.S.A. 113, E3609–E3618 (2016). - PMC - PubMed
    1. Gujrati V., Prakash J., Malekzadeh-Najafabadi J., Stiel A., Klemm U., Mettenleiter G., Aichler M., Walch A., Ntziachristos V., Bioengineered bacterial vesicles as biological nano-heaters for optoacoustic imaging. Nat. Commun. 10, 1114 (2019). - PMC - PubMed

Publication types