

A single molecular descriptor to predict solution behavior of therapeutic antibodies
- PMID: 32923611
- PMCID: PMC7457339
- DOI: 10.1126/sciadv.abb0372
A single molecular descriptor to predict solution behavior of therapeutic antibodies
Abstract
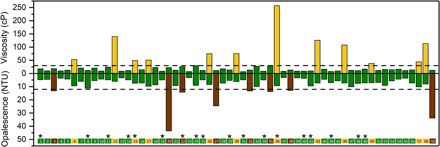
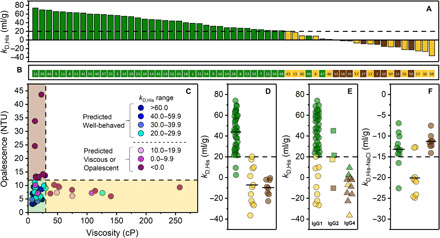
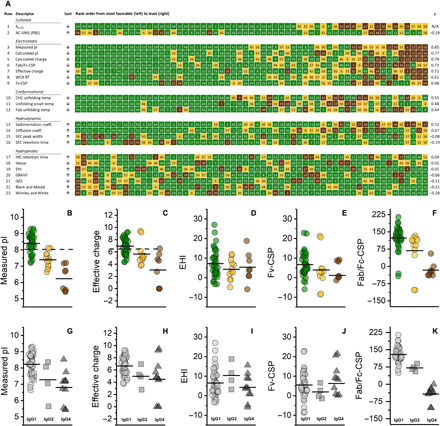
Despite the therapeutic success of monoclonal antibodies (mAbs), early identification of developable mAb drug candidates with optimal manufacturability, stability, and delivery attributes remains elusive. Poor solution behavior, which manifests as high solution viscosity or opalescence, profoundly affects the developability of mAb drugs. Using a diverse dataset of 59 mAbs, including 43 approved products, and an array of molecular descriptors spanning colloidal, conformational, charge-based, hydrodynamic, and hydrophobic properties, we show that poor solution behavior is prevalent (>30%) in mAbs and is singularly predicted (>90%) by the diffusion interaction parameter (k D), a dilute-solution measure of colloidal self-interaction. No other descriptor, individually or in combination, was found to be as effective as k D. We also show that well-behaved mAbs, a substantial subset of which bear high positive charge and pI, present no disadvantages with respect to pharmacokinetics in humans. Here, we provide a systematic framework with quantitative thresholds for selecting well-behaved therapeutic mAbs during drug discovery.
Copyright © 2020 The Authors, some rights reserved; exclusive licensee American Association for the Advancement of Science. No claim to original U.S. Government Works. Distributed under a Creative Commons Attribution NonCommercial License 4.0 (CC BY-NC).
Figures
Similar articles
-
Ultradilute Measurements of Self-Association for the Identification of Antibodies with Favorable High-Concentration Solution Properties.Mol Pharm. 2021 Jul 5;18(7):2744-2753. doi: 10.1021/acs.molpharmaceut.1c00280. Epub 2021 Jun 9. Mol Pharm. 2021. PMID: 34105965
-
Improved Diffusion Interaction Parameter Measurement to Predict the Viscosity of Concentrated mAb Solutions.Mol Pharm. 2023 Dec 4;20(12):6420-6428. doi: 10.1021/acs.molpharmaceut.3c00797. Epub 2023 Oct 31. Mol Pharm. 2023. PMID: 37906640
-
In Silico Prediction of Diffusion Interaction Parameter (kD), a Key Indicator of Antibody Solution Behaviors.Pharm Res. 2018 Aug 20;35(10):193. doi: 10.1007/s11095-018-2466-6. Pharm Res. 2018. PMID: 30128780
-
An accelerated surface-mediated stress assay of antibody instability for developability studies.MAbs. 2020 Jan-Dec;12(1):1815995. doi: 10.1080/19420862.2020.1815995. MAbs. 2020. PMID: 32954930 Free PMC article. Review.
-
Discovery-stage identification of drug-like antibodies using emerging experimental and computational methods.MAbs. 2021 Jan-Dec;13(1):1895540. doi: 10.1080/19420862.2021.1895540. MAbs. 2021. PMID: 34313532 Free PMC article. Review.
Cited by
-
Low-data interpretable deep learning prediction of antibody viscosity using a biophysically meaningful representation.Sci Rep. 2023 Feb 20;13(1):2917. doi: 10.1038/s41598-023-28841-4. Sci Rep. 2023. PMID: 36806303 Free PMC article.
-
Biophysical cartography of the native and human-engineered antibody landscapes quantifies the plasticity of antibody developability.Commun Biol. 2024 Jul 31;7(1):922. doi: 10.1038/s42003-024-06561-3. Commun Biol. 2024. PMID: 39085379 Free PMC article.
-
Toward Drug-Like Multispecific Antibodies by Design.Int J Mol Sci. 2020 Oct 12;21(20):7496. doi: 10.3390/ijms21207496. Int J Mol Sci. 2020. PMID: 33053650 Free PMC article. Review.
-
Accelerating therapeutic protein design with computational approaches toward the clinical stage.Comput Struct Biotechnol J. 2023 Apr 29;21:2909-2926. doi: 10.1016/j.csbj.2023.04.027. eCollection 2023. Comput Struct Biotechnol J. 2023. PMID: 38213894 Free PMC article. Review.
-
Modulation of the high concentration viscosity of IgG1 antibodies using clinically validated Fc mutations.MAbs. 2024 Jan-Dec;16(1):2379560. doi: 10.1080/19420862.2024.2379560. Epub 2024 Jul 19. MAbs. 2024. PMID: 39028186 Free PMC article.
References
-
- Walsh G., Biopharmaceutical benchmarks 2018. Nat. Biotechnol. 36, 1136–1145 (2018). - PubMed
-
- Casadevall A., Dadachova E., Pirofski L.-a., Passive antibody therapy for infectious diseases. Nat. Rev. Microbiol. 2, 695–703 (2004). - PubMed
-
- Carter P. J., Potent antibody therapeutics by design. Nat. Rev. Immunol. 6, 343–357 (2006). - PubMed
-
- Anselmo A. C., Gokarn Y., Mitragotri S., Non-invasive delivery strategies for biologics. Nat. Rev. Drug Discov. 18, 19–40 (2019). - PubMed
-
- Shire S. J., Shahrokh Z., Liu J., Challenges in the development of high protein concentration formulations. J. Pharm. Sci. 93, 1390–1402 (2004). - PubMed
Publication types
MeSH terms
Substances
LinkOut - more resources
Full Text Sources
Other Literature Sources
Research Materials
Miscellaneous
