. 2020 Aug 5;6(32):eabb8458.
doi: 10.1126/sciadv.abb8458. eCollection 2020 Aug.

Herbivores at the highest risk of extinction among mammals, birds, and reptiles

Affiliations

Herbivores at the highest risk of extinction among mammals, birds, and reptiles

Trisha B Atwood et al. Sci Adv. .

Abstract

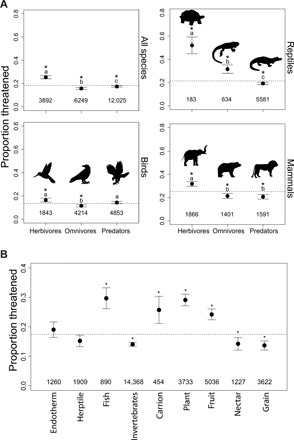
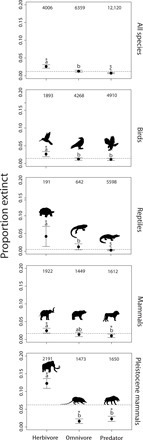
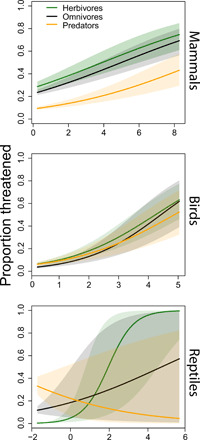
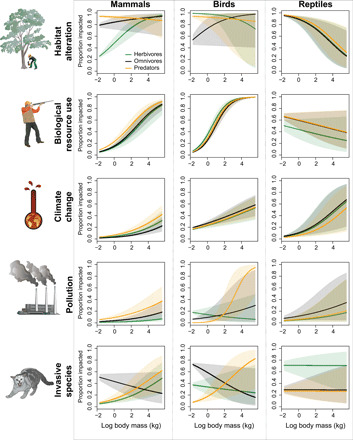
As a result of their extensive home ranges and slow population growth rates, predators have often been perceived to suffer higher risks of extinction than other trophic groups. Our study challenges this extinction-risk paradigm by quantitatively comparing patterns of extinction risk across different trophic groups of mammals, birds, and reptiles. We found that trophic level and body size were significant factors that influenced extinction risk in all taxa. At multiple spatial and temporal scales, herbivores, especially herbivorous reptiles and large-bodied herbivores, consistently have the highest proportions of threatened species. This observed elevated extinction risk for herbivores is ecologically consequential, given the important roles that herbivores are known to play in controlling ecosystem function.


Figures

Fig. 1
Fig. 1. Patterns of extinction risk by trophic group and diet.
(A) Mean proportions of threatened vertebrate species (±95% CI) within herbivores, omnivores, and predators summarized for all species combined and within mammals, birds, and reptiles. Letters indicate the results for comparisons across trophic group using Tukey’s post hoc tests. Differing letters indicate significant differences among trophic groups (P < 0.05). (B) Mean proportions of threatened species (±95% CI) within each diet group across all species combined. Some species can be classified in multiple diet groups. Asterisks indicate where the proportions of threatened species are significantly different from the background fraction (dashed horizontal line). Numbers indicate sample size.
Fig. 2
Fig. 2. Trophic group patterns in extinction risk across land and marine regions.
Silhouettes indicate trophic groups and taxonomic classes with higher proportions of threatened species in a given region compared to the background fraction. Regions without symbols had either similar or lower proportions of threatened species compared to the background fraction. Colors illustrate land and marine regional boundaries. Summary statistics can be found in table S1.
Fig. 3
Fig. 3. Trophic group patterns in extinction risk across habitat types.
Icons indicate trophic groups with lower proportions (white), similar proportions (gray), or higher proportions (black) of threatened species compared to the background fraction. Numbers indicate the mean proportion (±95% CI) listed as threatened for each trophic group–habitat combination. Letters indicate the results for comparisons across trophic group using Tukey’s post hoc tests. Differing letters indicate significant differences among trophic groups (P < 0.05). Summary statistics can be found in table S2.
Fig. 4
Fig. 4. Historical patterns in extinctions across trophic groups.
The mean proportions (±95% CI) of extinct species for recently extinct birds, mammals, and reptiles combined (all species) and separately, and Pleistocene extinct mammals. Asterisks indicate where the proportions of extinct species are significantly different from the background fraction (dashed horizontal line). Numbers indicate total number of species within each group. Letters indicate the results for comparisons across trophic group using Tukey’s post hoc tests. Differing letters indicate significant differences among trophic groups (P < 0.05).
Fig. 5
Fig. 5. Relationships between body mass, trophic group, and threat status.
The relationship between body size, trophic group, and the proportion of mammals, birds, and reptiles listed as threatened by the IUCN. Models account for phylogenetic relatedness. Solid lines represent means, while shaded areas represent 95% CI. See table S5 for summary statistics.
Fig. 6
Fig. 6. Impacts of anthropogenic drivers of global change on threatened species.
The relationship between body size, trophic group, and the proportion of species affected by habitat alteration, biological resource use, climate change, pollution, and invasive species. Models account for phylogenetic relatedness. Solid lines represent means, while shaded areas represent 95% CI. See tables S6 to S8 for summary statistics.

Similar articles

  • Functional traits of the world's late Quaternary large-bodied avian and mammalian herbivores.
    Lundgren EJ, Schowanek SD, Rowan J, Middleton O, Pedersen RØ, Wallach AD, Ramp D, Davis M, Sandom CJ, Svenning JC. Lundgren EJ, et al. Sci Data. 2021 Jan 20;8(1):17. doi: 10.1038/s41597-020-00788-5. Sci Data. 2021. PMID: 33473149 Free PMC article.
  • Less need for differentiation? Intestinal length of reptiles as compared to mammals.
    Hoppe MI, Meloro C, Edwards MS, Codron D, Clauss M, Duque-Correa MJ. Hoppe MI, et al. PLoS One. 2021 Jul 2;16(7):e0253182. doi: 10.1371/journal.pone.0253182. eCollection 2021. PLoS One. 2021. PMID: 34214090 Free PMC article.
  • A global reptile assessment highlights shared conservation needs of tetrapods.
    Cox N, Young BE, Bowles P, Fernandez M, Marin J, Rapacciuolo G, Böhm M, Brooks TM, Hedges SB, Hilton-Taylor C, Hoffmann M, Jenkins RKB, Tognelli MF, Alexander GJ, Allison A, Ananjeva NB, Auliya M, Avila LJ, Chapple DG, Cisneros-Heredia DF, Cogger HG, Colli GR, de Silva A, Eisemberg CC, Els J, Fong G A, Grant TD, Hitchmough RA, Iskandar DT, Kidera N, Martins M, Meiri S, Mitchell NJ, Molur S, Nogueira CC, Ortiz JC, Penner J, Rhodin AGJ, Rivas GA, Rödel MO, Roll U, Sanders KL, Santos-Barrera G, Shea GM, Spawls S, Stuart BL, Tolley KA, Trape JF, Vidal MA, Wagner P, Wallace BP, Xie Y. Cox N, et al. Nature. 2022 May;605(7909):285-290. doi: 10.1038/s41586-022-04664-7. Epub 2022 Apr 27. Nature. 2022. PMID: 35477765 Free PMC article.
  • Megafauna and ecosystem function from the Pleistocene to the Anthropocene.
    Malhi Y, Doughty CE, Galetti M, Smith FA, Svenning JC, Terborgh JW. Malhi Y, et al. Proc Natl Acad Sci U S A. 2016 Jan 26;113(4):838-46. doi: 10.1073/pnas.1502540113. Proc Natl Acad Sci U S A. 2016. PMID: 26811442 Free PMC article. Review.
  • Herbivore regulation of plant abundance in aquatic ecosystems.
    Wood KA, O'Hare MT, McDonald C, Searle KR, Daunt F, Stillman RA. Wood KA, et al. Biol Rev Camb Philos Soc. 2017 May;92(2):1128-1141. doi: 10.1111/brv.12272. Epub 2016 Apr 8. Biol Rev Camb Philos Soc. 2017. PMID: 27062094 Review.

Cited by

References

    1. IUCN, The IUCN Red List of Threatened Species. Version 2019–2 (IUCN, 2019); http://www.iucnredlist.org.
    1. McCauley D. J., Pinsky M. L., Palumbi S. R., Estes J. A., Joyce F. H., Warner R. R., Marine defaunation: Animal loss in the global ocean. Science 347, 1255641 (2015). - PubMed
    1. Young H. S., Mccauley D. J., Galetti M., Dirzo R., Patterns, causes, and consequences of Anthropocene defaunation. Annu. Rev. Ecol. Evol. Syst. 47, 333–358 (2016).
    1. Barnosky A. D., Koch P. L., Feranec R. S., Wing S. L., Shabel A. B., Assessing the causes of late Pleistocene extinctions on the continents. Science 306, 70–75 (2004). - PubMed
    1. Urban M., Accelerating extinction risk from climate change. Science 348, 571–573 (2015). - PubMed

Publication types