. 2020 Aug 28;6(35):eaba1394.
doi: 10.1126/sciadv.aba1394. eCollection 2020 Aug.

Unmasking selective path integration deficits in Alzheimer's disease risk carriers

Affiliations

Unmasking selective path integration deficits in Alzheimer's disease risk carriers

Anne Bierbrauer et al. Sci Adv. .

Abstract

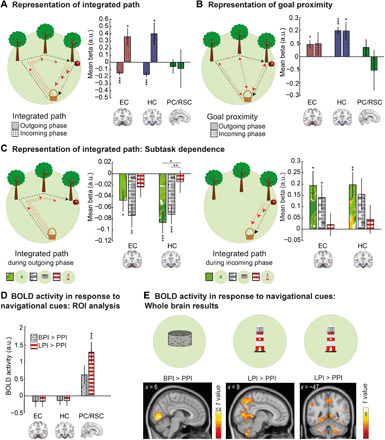
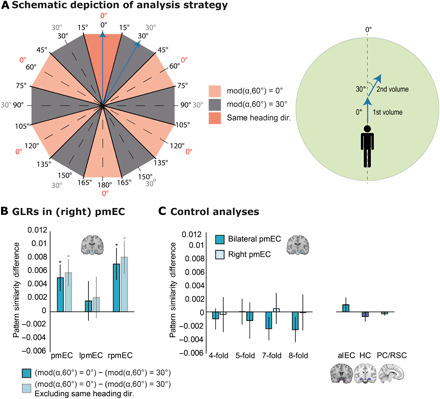
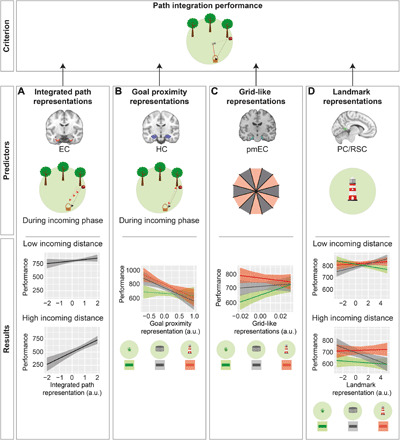
Alzheimer's disease (AD) manifests with progressive memory loss and spatial disorientation. Neuropathological studies suggest early AD pathology in the entorhinal cortex (EC) of young adults at genetic risk for AD (APOE ε4-carriers). Because the EC harbors grid cells, a likely neural substrate of path integration (PI), we examined PI performance in APOE ε4-carriers during a virtual navigation task. We report a selective impairment in APOE ε4-carriers specifically when recruitment of compensatory navigational strategies via supportive spatial cues was disabled. A separate fMRI study revealed that PI performance was associated with the strength of entorhinal grid-like representations when no compensatory strategies were available, suggesting grid cell dysfunction as a mechanistic explanation for PI deficits in APOE ε4-carriers. Furthermore, posterior cingulate/retrosplenial cortex was involved in the recruitment of compensatory navigational strategies via supportive spatial cues. Our results provide evidence for selective PI deficits in AD risk carriers, decades before potential disease onset.


Figures

Fig. 1
Fig. 1. Experimental paradigm.
(A) Participants performed a novel PI task (the Apple Game) in a virtual environment. The task comprised three subtasks that differed with regard to the presence or absence of supportive spatial cues: the PPI subtask without any supportive cue, the BPI subtask with a circular boundary, and the LPI subtask with an intramaze landmark (lighthouse) close to the center of the environment. (B) In each trial, participants collected a basket (start phase) and tried to remember its location (goal location). After navigating toward a variable number of trees (1 to 5; outgoing phase), which disappeared after having been reached, participants had to find their way back to the goal location (incoming phase). Last, they received feedback via different numbers of stars, depending on response accuracy. (C) Outgoing distance refers to the cumulated distance during the outgoing phase, and incoming distance refers to the Euclidean distance between retrieval location (tree with apple) and goal location (basket). (D) PI performance was assessed as the distance between the correct goal location and the response location (drop error). The drop error can be separated into the distance error (i.e., the difference between the retrieval-to-goal distance and the retrieval-to-response distance) and the rotation error (i.e., the difference between the retrieval-to-goal rotation and the retrieval-to-response rotation). (E) The behavioral task comprised 8 practice trials followed by 16 trials in each subtask (short version; in the long version, all subtasks were performed twice, resulting in 32 trials in each subtask). (F) The fMRI task consisted of up to nine practice trials during the structural scan, followed by two functional runs with six blocks of four trials each. See also fig. S1 and movie S1.
Fig. 2
Fig. 2. Performance as a function of genotype, distances, and subtask.
(A) Performance (which is inversely related to drop error) is specifically impaired in risk carriers when no supportive spatial cues are available, i.e., in the PPI subtask. (B) Risk carriers benefit more from environmental landmarks and boundaries than controls. (A) and (B) depict results from model 1b; results from model 1a are statistically equivalent. (C) Incoming (but not outgoing) distance is more closely related to spatial memory performance in risk carriers than controls (model 1c). (D) Goal-to-landmark distance (but not goal-to-boundary distance) is more relevant in risk carriers than controls (models 2a and 2b). (E) Movement-to-landmark distance (but not movement-to-boundary distance) is significantly lower in risk carriers than controls (models 2c and 2d). Y axes show parameter estimates resulting from the different models; error bars, SEM; *P < 0.05, **P < 0.01, and ***P < 0.001. Control, APOE ε3/ε3-carriers; Risk, APOE ε3/ε4-carriers; PI, path integration; BPI, boundary-supported PI; LPI, landmark-supported PI; vm, virtual meters. See also figs. S1 to S3 and tables S1 and S2.
Fig. 3
Fig. 3. Performance as a function of genotype, age, incoming distance, and EC gray matter volume.
(A) EC gray matter volume predicts performance only during PI with long incoming distances (middle to right panels) and only in risk carriers (model 3b). (B) In younger risk carriers, EC gray matter volume predicted performance during PI trials with long incoming distances. In older risk carriers, EC gray matter volume predicted performance during the majority of all trials (model 3b). The young group comprises subjects aged 18 to 28 years; the older group contains subjects aged 53 to 75 years (see age histogram in fig. S1C). As the models contained two continuous predictors, one of them (incoming distance) was discretized into quintiles for post hoc tests and graphical depiction. Thicker lines mark slopes that are significantly different from zero. Y axes show parameter estimates resulting from the different models; shaded areas, SEM. Control, APOE ε3/ε3-carriers; Risk, APOE ε3/ε4-carriers; % volume, percent of whole-brain volume. See also fig. S1 and tables S1 and S3.
Fig. 4
Fig. 4. Performance as a function of genotype, distances, and subtask split by age groups.
The younger age group comprises subjects aged 18 to 41 (n = 163), and the older age group comprises subjects aged 42 to 75 (n = 104). (A) Performance (which is inversely related to drop error) is specifically impaired in older risk carriers when no supportive spatial cues are available, i.e., in the PPI subtask. (B) In older participants, risk carriers benefit more from environmental landmarks and boundaries than controls. (A) and (B) depict results from model 1b; results from model 1a are statistically equivalent. (C) In both age groups, neither incoming nor outgoing distance is more closely related to spatial memory performance in risk carriers than controls. (D) In the younger age group, goal-to-boundary distance is more relevant in risk carriers than in controls (models 2a and 2b). (E) In younger participants, movement-to-landmark distance (but not movement-to-boundary distance) is significantly lower in risk carriers than in controls (models 2c and 2d). Y axes show parameter estimates resulting from the different models; error bars, SEM. +P < 0.10, *P < 0.05, **P < 0.01, and ***P < 0.001. Control, APOE ε3/ε3-carriers; Risk, APOE ε3/ε4-carriers. See also figs. S1 to S3 and tables S1, S2, and S4.
Fig. 5
Fig. 5. fMRI results: Neural determinants of integrated path, goal proximity, and subtask.
(A) Representation of integrated path in EC and HC: Deactivation during navigation at longer integrated paths during outgoing phase and activation during incoming phase. (B) Representation of goal proximity: Activation for navigation closer to the goal in HC in both trial phases and in EC during the outgoing phase. (C) Subtask dependence of integrated path representations: HC deactivation during navigation at longer integrated paths during the outgoing phase was modulated by subtask. During the incoming phase, we observed a statistical trend for a similar result in EC and HC. (D) Significantly higher activity in PC/RSC during the LPI as compared to the PPI subtask. (E) Confirmatory whole-brain analyses: (left) activation of visual areas during the BPI as compared to the PPI subtask and (right) higher PC/RSC activity in the LPI than in the PPI subtask. P values are FDR-corrected for the number of contrasts and for the number of ROIs in all ROI analyses (A, B, and D). For post hoc comparisons between subtasks in (C), P values are FDR-corrected for number of subtasks. *P < 0.05, **P < 0.01, and ***P < 0.001. Error bars (A to D), SEM. Statistical parametric maps in (E) are thresholded at P < 0.05, family-wise error (FWE)–corrected for whole brain (left) and small volume–corrected for PC/RSC (middle and right), and clusters are considered significant at P < 0.05, FWE-corrected. FDR, false discovery rate; a.u., arbitrary units. See also figs. S4 and S5 and table S5.
Fig. 6
Fig. 6. Grid-like representations in pmEC.
(A) Left: Schematic depiction of angular differences in 360° space (inner numbers) and in 60° space (outer numbers). We expected higher pattern similarity for angular differences of mod(α,60°) = 0° (rose, where α is the angular difference between two movement directions) as compared to angular differences of mod(α,60°) = 30° (gray). We expected the same result when excluding pattern similarities of the same heading direction (dark rose). Right: Movement directions of two exemplary fMRI volumes (blue arrows). In the first volume, the subject navigates at an angle of 0° with respect to the reference axis. In the second volume, the subject navigates at an angle of 30°. This results in an angular difference of 30° (in 360° and 60° spaces) and thus mod(α,60°) = 30° (compare to blue arrows on the left). (B) In bilateral and in right pmEC, pattern similarity for angular differences of mod(α,60°) = 0° was significantly higher than pattern similarity for angular differences of mod(α,60°) = 30°, suggesting a hexadirectional symmetry of pattern similarities (dark blue bars). Same result when removing movements with similar heading directions in 360° space (light blue bars). (C) Control analyses. Left: No evidence for fourfold, fivefold, sevenfold, or eightfold rotational symmetry of pattern similarity in bilateral or right pmEC. Right: No evidence for sixfold rotational symmetry of pattern similarity in alEC, HC, and PC/RSC. Error bars (B and C), SEM. *P < 0.05. mod, modulus; dir., direction; pmEC, posterior-medial entorhinal cortex; alEC, anterior-lateral entorhinal cortex; HC, hippocampus.
Fig. 7
Fig. 7. Mechanistic model to predict PI performance.
We aimed at predicting PI performance as a function of fMRI-based representations of spatial features in combination with subtask and incoming distance (model 6). (A) Integrated path representations in EC interacted with incoming distance in predicting PI performance: At higher incoming distances, stronger integrated path representations in EC were associated with better performance. (B) Goal proximity representations in HC interacted with subtask in predicting PI performance. In none of the subtasks was the prediction significant by itself. (C) GLRs in pmEC interacted with subtask in predicting PI performance: Only in PPI, higher GLRs in pmEC were associated with better performance. (D) Landmark representations in PC/RSC interacted with subtask and incoming distance in predicting PI performance. In none of the individual subtask by incoming distance combinations was the prediction significant by itself. As the model contained two continuous predictors, one of them (incoming distance) was discretized into quintiles for post hoc tests and for graphical depiction; only quintiles 1 and 5 are depicted (A and D). Y axes show parameter estimates for performance; shaded areas, SEM.

References

    1. Coughlan G., Laczó J., Hort J., Minihane A.-M., Hornberger M., Spatial navigation deficits—Overlooked cognitive marker for preclinical Alzheimer disease? Nat. Rev. Neurol. 14, 496–506 (2018). - PubMed
    1. Sperling R. A., Jack C. R. Jr., Aisen P. S., Testing the right target and right drug at the right stage. Sci. Transl. Med. 3, 111cm33 (2011). - PMC - PubMed
    1. Corder E. H., Saunders A. M., Strittmatter W. J., Schmechel D. E., Gaskell P. C., Small G. W., Roses A. D., Haines J. L., Pericak-Vance M. A., Gene dose of apolipoprotein E type 4 allele and the risk of Alzheimer’s disease in late onset families. Science 261, 921–923 (1993). - PubMed
    1. Kunz L., Schröder T. N., Lee H., Montag C., Lachmann B., Sariyska R., Reuter M., Stirnberg R., Stöcker T., Messing-Floeter P. C., Fell J., Doeller C. F., Axmacher N., Reduced grid-cell–like representations in adults at genetic risk for Alzheimer’s disease. Science 350, 430–433 (2015). - PubMed
    1. Coughlan G., Coutrot A., Khondoker M., Minihane A.-M., Spiers H., Hornberger M., Toward personalized cognitive diagnostics of at-genetic-risk Alzheimer’s disease. Proc. Natl. Acad. Sci. U.S.A. 116, 9285–9292 (2019). - PMC - PubMed

Publication types

Substances