. 2020 Aug 26;6(35):eabb2119.
doi: 10.1126/sciadv.abb2119. eCollection 2020 Aug.

Fate mapping via CCR2-CreER mice reveals monocyte-to-microglia transition in development and neonatal stroke

Affiliations

Fate mapping via CCR2-CreER mice reveals monocyte-to-microglia transition in development and neonatal stroke

Hong-Ru Chen et al. Sci Adv. .

Abstract

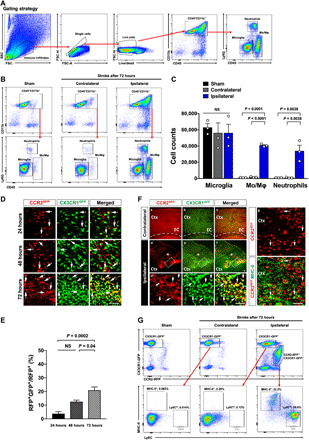
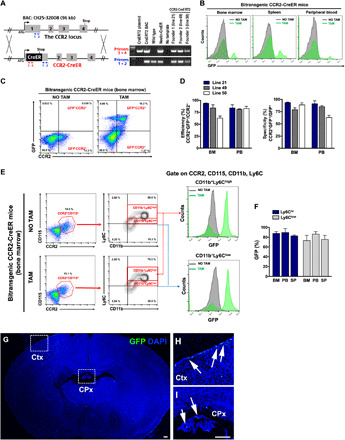
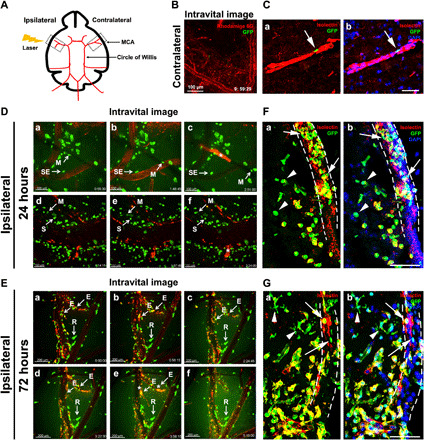
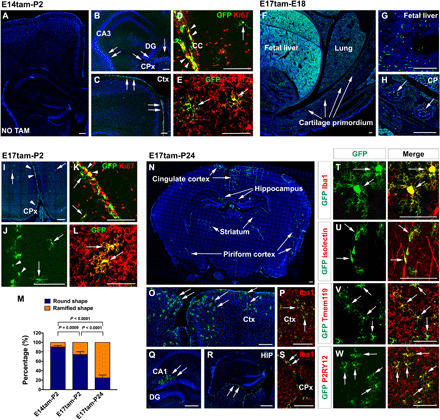
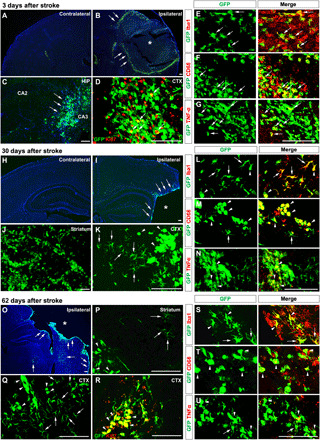
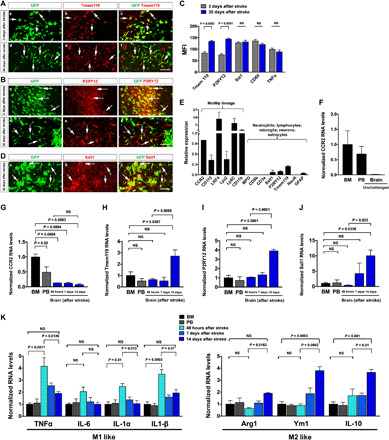
Whether monocytes contribute to the brain microglial pool in development or after brain injury remains contentious. To address this issue, we generated CCR2-CreER mice to track monocyte derivatives in a tamoxifen-inducible manner. This method labeled Ly6Chi and Ly6Clo monocytes after tamoxifen dosing and detected a surge of perivascular macrophages before blood-brain barrier breakdown in adult stroke. When dosed by tamoxifen at embryonic day 17 (E17), this method captured fetal hematopoietic cells at E18, subdural Ki67+ ameboid cells at postnatal day 2 (P2), and perivascular microglia, leptomeningeal macrophages, and Iba1+Tmem119+P2RY12+ parenchymal microglia in selective brain regions at P24. Furthermore, this fate mapping strategy revealed an acute influx of monocytes after neonatal stroke, which gradually transformed into a ramified morphology and expressed microglial marker genes (Sall1, Tmem119, and P2RY12) for at least 62 days after injury. These results suggest an underappreciated level of monocyte-to-microglia transition in development and after neonatal stroke.


Figures

Fig. 1
Fig. 1. Tracking monocyte derivatives after neonatal stroke in CCR2RFP/+; CX3CR1GFP/+ (R/G) mice.
(A) The gating strategy for flow cytometry analysis used in (B). (B and C) Flow cytometry of the brain myeloid cells after photothrombosis in P16 mice. Shown in (B) are representative flow plots and in (C) are quantification results at 72 hours after stroke (n = 3 males). (D and E) Sections of the brains of R/G mice at 24, 48, and 72 hours after stroke (n = 6 to 15 of both genders). Arrows indicate CX3CR1GRP+CCR2RFP+ double-positive cells in the ipsilateral hemispheres in all time points. (F) At 72 hours after stroke, CCR2RFP+ monocytes (d and d′), CX3CR1GFP+ ameboid microglia (e and e′), and CX3CR1GRP+CCR2RFP+ cells (f and f′) were concentrated at the infarct border (asterisk) but absent in the contralateral hemisphere (a, b, and c). Many invading CCR2RFP+ monocytes expressed MHC-II (g and h) (n = 15 from both genders). (G) Flow cytometry of the R/G mouse brains at 72 hours after stroke. The CX3CR1GFP+ cells in the sham and contralateral hemisphere were negative for MHC-II and Ly6C. The CX3CR1GFP+CCR2RFP- cells in the ipsilateral hemisphere included few MHC-II+Ly6C macrophages and MHC-IILy6C+ monocytes. In contrast, more CX3CR1GFP+CCR2RFP+ cells expressed the macrophage and monocyte markers. (n = 3 from 3 males for each). Data are presented as means ± SEM; analyses were performed using one-way ANOVA with Tukey’s post hoc test. Scale bars, 100 μm. Ctx, cerebral cortex; EC, entorhinal cortex; NS, not significant.
Fig. 2
Fig. 2. Generation of CCR2-CreER(T2) mice for detecting monocytes and the monocyte derivatives.
(A) Diagram of the BAC construct for transgenic CCR2-CreER(T2) mice, which includes the CCR2 promoter, CreERT2 cDNA, and the SV40 polyA signal. PCR genotyping confirmed the three founders used to established transgenic lines (#21, #49, and #50). (B) Bitransgenic CCR2-CreER mice (after being crossed with the R26R-EGFP, Ai6 mice) exhibited copious GFP+ cells in the BM, spleen, and PB after daily tamoxifen dosing for 5 days, but no GFP+ cells without tamoxifen. (C and D) Flow cytometry comparison of the efficiency (CCR2+GFP+/CCR2+) and specificity (CCR2+GFP+/GFP+) of monocyte-labeling in tamoxifen-dosed bitransgenic CCR2-CreER mice. Shown are means ± SEM (n = 3 for each line). (E and F) Flow cytometry showed high efficiency for labeling Ly6Chigh (88 ± 5%) and Ly6Clow monocytes (78 ± 8%) in bitransgenic CCR2-CreER mice (line #21). Data are presented as means ± SEM (n = 3). (G to I) Bitransgenic CCR2-CreER mice received tamoxifen induction at P14 and P15, and those analyzed at P16 showed no GFP+ cells in the brain parenchyma (n = 4). Magnified areas of squares (Ctx and CPx) are shown in (H) and (I). Scale bars, 100 μm.
Fig. 3
Fig. 3. The surge of PVMs after cerebral ischemia.
(A) Schematic diagram of the MCA-targeted photothrombotic stroke model. (B) Intravital imaging of the contralateral hemisphere in bitransgenic CCR2-CreER mice at 24 hours after stroke. See movie S1 (n = 3 from 3 males). Scale bar, 100 μm. (C) Immunostaining showed near absence of GFP+ monocyte derivatives outside the isolectin B4 (IB4)+ blood vessels in the contralateral hemisphere at 24 hours after stroke (n = 3 males). Scale bar, 100 μm. (D and E) Intravital imaging and videos of the peri-infarct area in bitransgenic CCR2-CreER mice at 24 hours after stroke [n = 3 males; D, a to c, movie S2; d to f, movie S3) or 72 hours (n = 3 males; E, a to f, movie S4). Note the minuscule perivascular leakage of Rhodamine 6G at 72 hours (E), but not 24 hours after stroke (D). Asterisks indicate intravascular blood clots. Scale bars, 100 μm (D) and 200 μm (E). (F and G) Immunostaining of GFP+ monocytes and IB4+ blood vessels at 24 hours (F) and 72 hours (G) in the peri-infarct area after stroke. Note the presence of intravascular (arrows) and extravascular GFP+ cells (arrowheads), and the more complex morphology of extravascular monocyte derivatives at 72 hours after stroke. n = 3 males for (F) and n = 4 males for (G). Scale bars, 100 μm. M, mobile cells; SE, stationary-exploring cells; S, stationary cells; R, resident PVMs; E, exiting cells.
Fig. 4
Fig. 4. The progeny of fetal CCR2+ monocytes in bitransgenic CCR2-CreER mice.
(A to E) Fate mapping CCR2+ monocytes in P2 mouse brains after tamoxifen dosing at E14 (n = 5). No GFP+ cells were labeled without tamoxifen dosing (A; n = 4). With tamoxifen, GFP+ cells were present in the CPx, the subdural meninges, and the fornix (arrows in B and C). GFP+ monocyte derivatives include Ki67+ cells in subdural meninges (arrowhead in D) and ramified microglial cells (arrows in D and E). The ramified monocyte derivatives were P2RY12+ (arrows in E). (F to H) With tamoxifen at E17, GFP+ cells were seen in the fetal liver and CP in E18 embryos (n = 6). (I to L) Fate mapping in P2 brains after tamoxifen induction at E17 (n = 5) showed GFP+ cells in the CPx and subdural meninges (arrowhead in I and J), and few ramified GFP+ cells (arrows in I to L). The progeny of CCR2+ monocytes included Ki67+ cells in subdural meninges (K) and P2RY12+ microglia (arrows in L). (M) Quantification of round- versus ramified-shaped progeny of fetal monocytes in E14tam-P2, E17tam-P2, and E17tam-P24 fate mapping (n = 5 for each). Data are shown as means ± SEM, one-way ANOVA with Tukey’s post hoc test. (N to W) Fate mapping monocyte derivatives in P24 brains after tamoxifen dosing at E17 showed Iba1+GFP+ microglia in the cingulate cortex, piriform cortex, striatum, and the hippocampus (N to Q and T; n = 5). Meningeal macrophages (R and S) and perivascular microglia (U) were visible. GFP+ ramified monocyte derivatives were Tmem119+ (V) and P2RY12+ (W). Scale bars, 200 μm (F to H), 100 μm (A to E, (I to L, and N to W).
Fig. 5
Fig. 5. Morphological changes of monocyte derivatives from 3 to 62 days after neonatal stroke.
Bitransgenic CCR2-CreER mice received tamoxifen at P14 and P15 and photothrombosis at P16, followed by detection of the monocyte derivatives at 3 days (A to G; n = 6, 5 males and 1 female), 30 days (H to N; n = 6 males), or 62 days after stroke (O to U; n = 6 males). (A to G) At 3 days, GFP+ cells were absent in contralateral cortex (A) but populated in the ischemic border (arrows in B) and distant areas including hippocampus (arrows in C). Many GFP+ cells expressed the proliferative cell marker Ki67 (arrows in D), Iba1 (arrows in E), and the proinflammatory markers CD68 (F) and TNFα (G). (H to N) At 30 days, GFP+ monocyte derivatives were still restricted in the ipsilateral hemisphere (H to K). Many large round GFP+ monocyte derivatives coalesced and showed CD68 (arrowhead in M) and TNFα (arrowhead in N), but some showed a ramified morphology and anti-Iba1+ (arrows in L). (O to U) At 62 days, GFP+ monocyte derivatives were still restricted in the ipsilateral hemisphere (O to R). Many GFP+ monocyte derivatives expressed Ki67 (arrowhead in R). Fewer round-shaped monocyte derivatives coalesced or showed CD68 (arrowhead in T) and TNFα (arrowhead in U), but some showed a ramified microglial morphology and anti-Iba1 staining (arrows in S). Scale bars, 100 μm. Asterisk denotes the infarct core.
Fig. 6
Fig. 6. Profiling the microglia and macrophage signature gene expression by monocyte derivatives in bitransgenic CCR2-CreER mouse brains.
(A and B) GFP+ monocyte derivatives showed ascending Tmem119 and P2RY12 expression from 3 to 30 days after stroke (five males and one female for 3 days; six males for 30 days). (C) Mean fluorescence intensity (MFI) on CCR2+ derivatives from (A) and (B) (n = 6). Data are shown as means ± SEM, and the P value was determined by Student’s t test. (D) Sall1 mRNAs were present in GFP+ monocyte derivatives at 30 days after neonatal stroke (n = 3 males). (E) TRAP analysis showed amplification of monocyte-specific transcripts in the BM of tamoxifen-induced adult CCR2-CreERtg/+; R26R-EGFP/Rpl10Atg/+ mice (n = 3 males). (F) TRAP analysis of CCR2 mRNA levels in BM, PB, and brain at P16 (n = 3 males). (G to J) TRAP-based qPCR analysis showed gradual decline of CCR2 mRNAs and an inverse increase in Sall1, P2RY12, and Tmem119 mRNAs in monocyte derivatives in tamoxifen-dosed mouse brains from 48 hours to 7 days to 14 days after stroke compared with monocytes in BM and PB. Dare are shown as means ± SEM (n = 3 males), one-way ANOVA with Tukey’s post hoc test. (K) TRAP analysis showed gradual decline of M1-like cytokine and an inverse increase in M2-like mRNAs in brain monocyte derivatives from 48 hours to 7 days to 14 days after stroke, compared with monocytes in BM and PB. Data are shown as means ± SEM (n = 3 males), one-way ANOVA with Tukey’s post hoc test. Scale bars, 100 μm.

References

    1. Sierra A., Paolicelli R. C., Kettenmann H., Cien Años de Microglía: Milestones in a century of microglial research. Trends Neurosci. 42, 778–792 (2019). - PubMed
    1. Ginhoux F., Greter M., Leboeuf M., Nandi S., See P., Gokhan S., Mehler M. F., Conway S. J., Ng L. G., Stanley E. R., Samokhvalov I. M., Merad M., Fate mapping analysis reveals that adult microglia derive from primitive macrophages. Science 330, 841–845 (2010). - PMC - PubMed
    1. Hoeffel G., Chen J., Lavin Y., Low D., Almeida F. F., See P., Beaudin A. E., Lum J., Low I., Forsberg E. C., Poidinger M., Zolezzi F., Larbi A., Ng L. G., Chan J. K. Y., Greter M., Becher B., Samokhvalov I. M., Merad M., Ginhoux F., C-Myb+ erythro-myeloid progenitor-derived fetal monocytes give rise to adult tissue-resident macrophages. Immunity 42, 665–678 (2015). - PMC - PubMed
    1. Prinz M., Jung S., Priller J., Microglia biology: One century of evolving concepts. Cell 179, 292–311 (2019). - PubMed
    1. Ginhoux F., Guilliams M., Tissue-resident macrophage ontogeny and homeostasis. Immunity 44, 439–449 (2016). - PubMed

Publication types

LinkOut - more resources