. 2018;4(2):9.
doi: 10.18590/mjm.2018.vol4.iss2.9.

Effect of removing outliers on statistical inference: implications to interpretation of experimental data in medical research

Affiliations

Effect of removing outliers on statistical inference: implications to interpretation of experimental data in medical research

Todd W Gress et al. Marshall J Med. 2018.

Abstract

Background: Data editing with elimination of "outliers" is commonly performed in the biomedical sciences. The effects of this type of data editing could influence study results, and with the vast and expanding amount of research in medicine, these effects would be magnified.

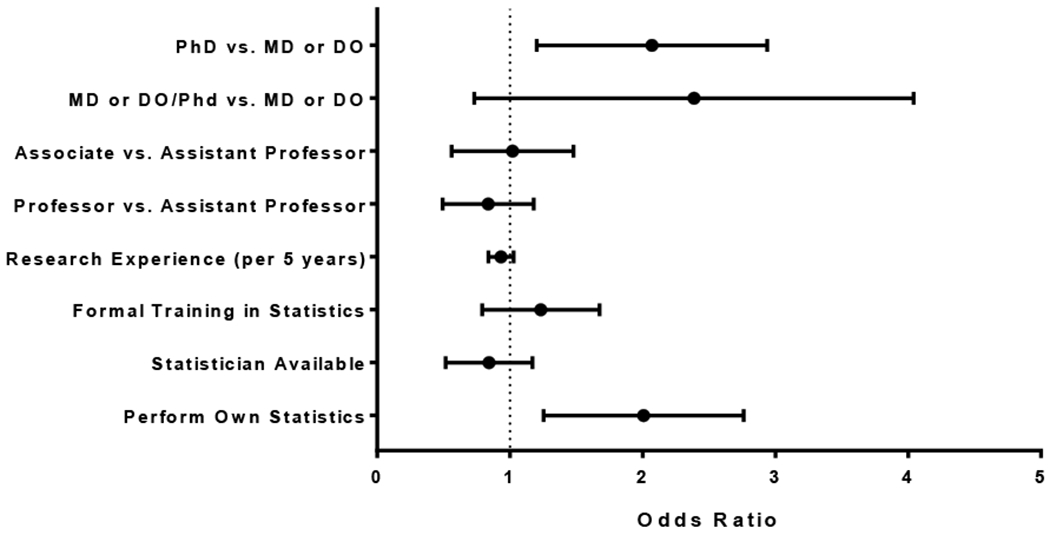
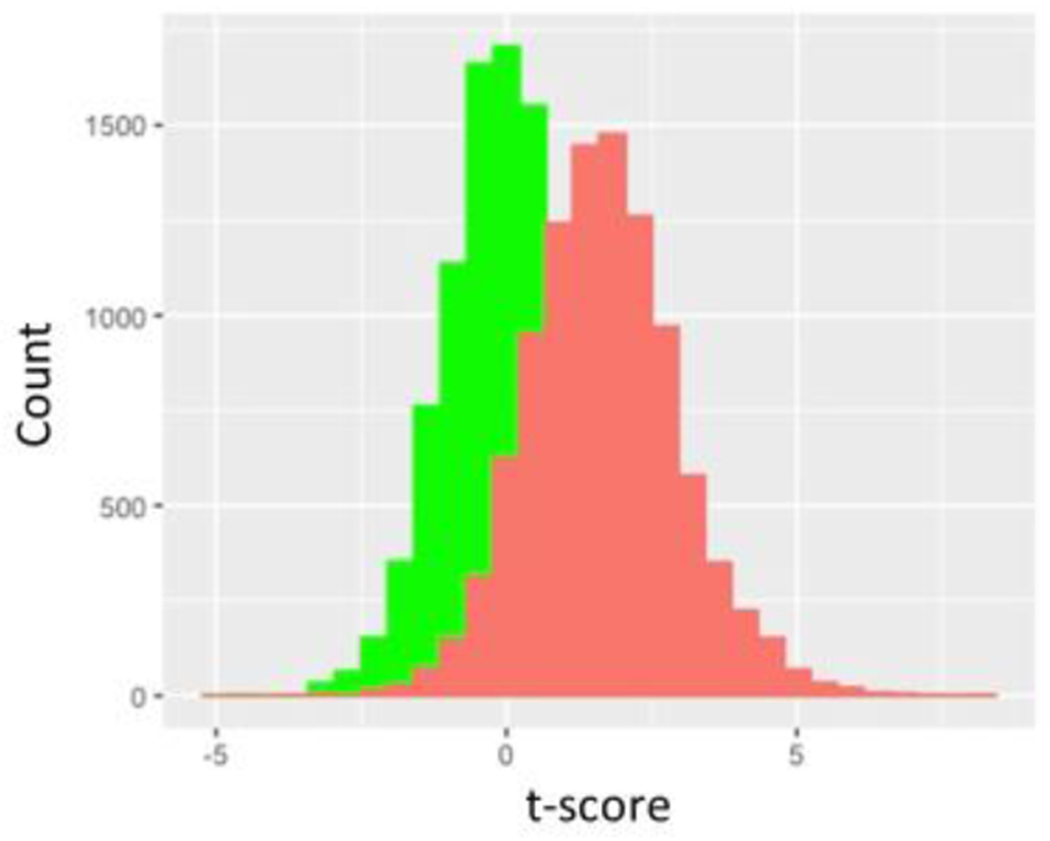
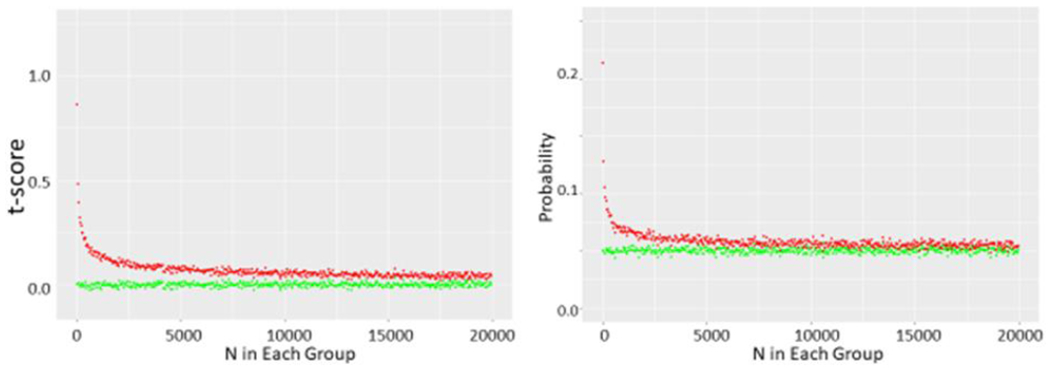
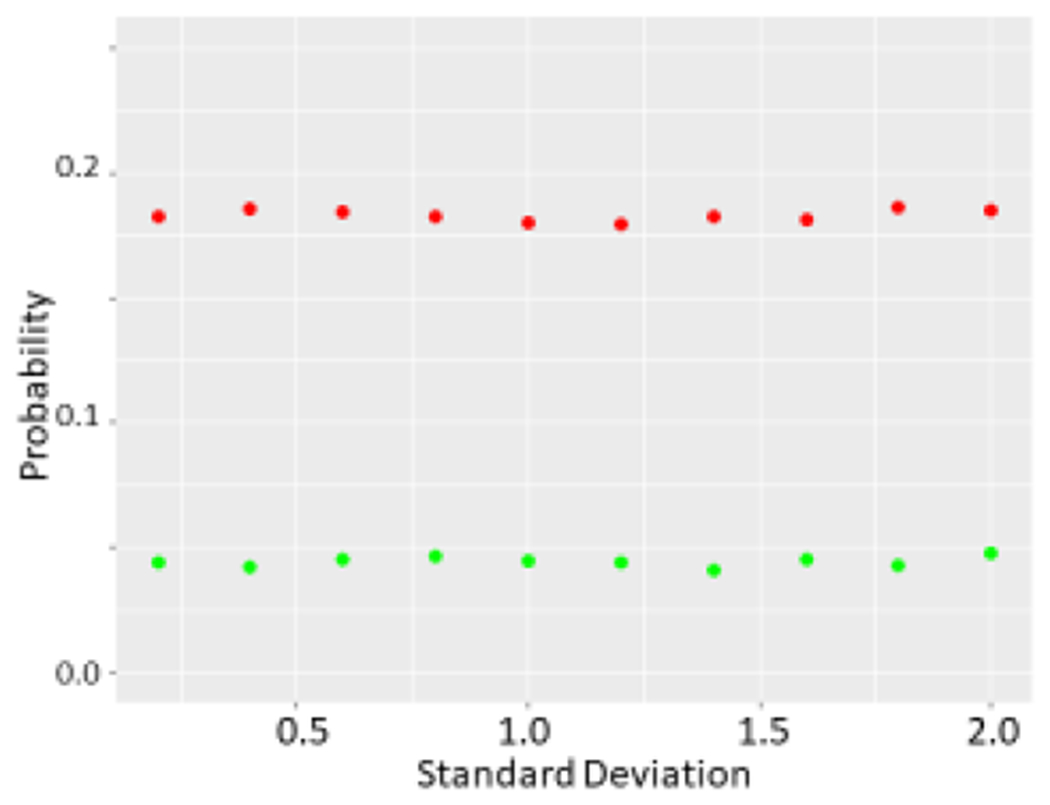
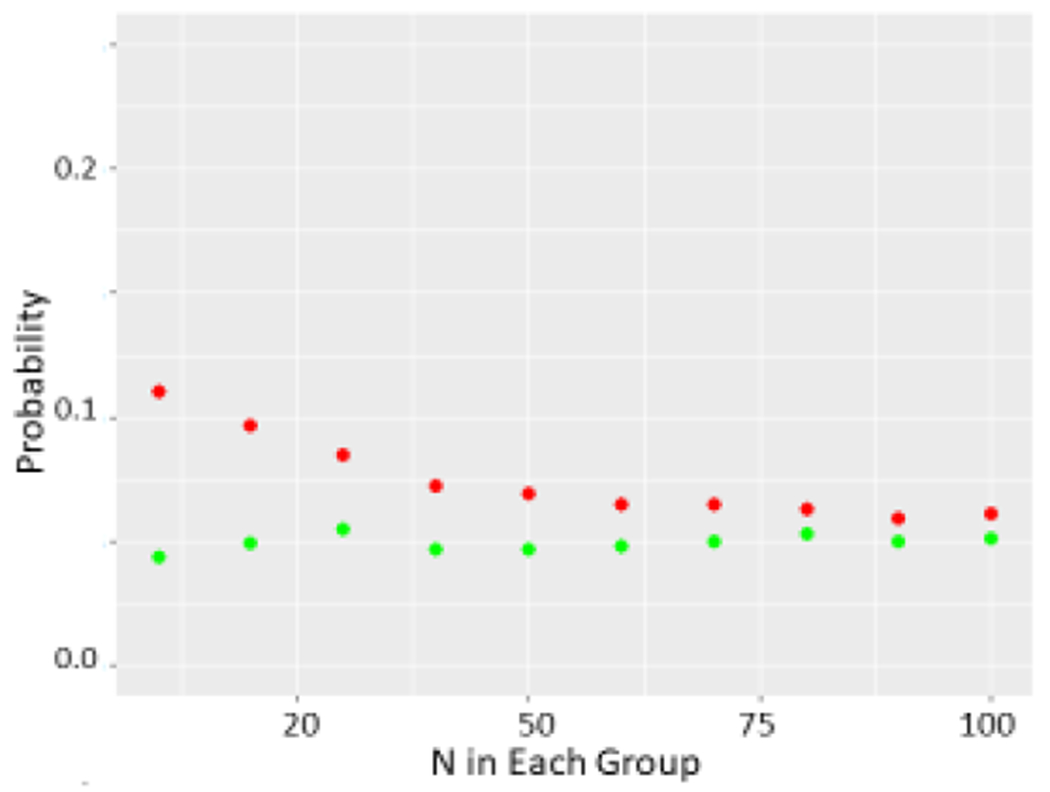
Methods and results: We first performed an anonymous survey of medical school faculty at institutions across the United States and found that indeed some form of outlier exclusion was performed by a large percentage of the respondents to the survey. We next performed Monte Carlo simulations of excluding high and low values from samplings from the same normal distribution. We found that removal of one pair of "outliers", specifically removal of the high and low values of the two samplings, respectively, had measurable effects on the type I error as the sample size was increased into the thousands. We developed an adjustment to the t score that accounts for the anticipated alteration of the type I error (tadj=tobs-2(log(n)^0.5/n^0.5)), and propose that this be used when outliers are eliminated prior to parametric analysis.

Conclusion: Data editing with elimination of outliers that includes removal of high and low values from two samples, respectively, can have significant effects on the occurrence of type 1 error. This type of data editing could have profound effects in high volume research fields, particularly in medicine, and we recommend an adjustment to the t score be used to reduce the potential for error.

Keywords: experimental design; non-parametric; normal distribution; outliers; parametric.


Conflict of interest statement

The authors have no financial disclosures to declare and no conflicts of interest to report.

Figures

Figure 1.
Figure 1.
Odds of Excluding Outlier Values in Bivariate Analysis using the Student’s T Test by Self-Reported Characteristics of Survey Respondents. Error bars represent the 95% confidence interval.
Figure 2
Figure 2
a shows green histogram for 10,000 t-scores determined by drawing two N=10 samples from a normal distribution with mean of 1 and SD of 1. Red histogram is also 10,000 t-scores determined by these same pairs of N=10 samples from same underlying distribution except highest value of one sampling and lowest value of the other sampling are systematically eliminated. b shows t scores and corresponding p values obtained from running 10,000 t-tests on N samples drawn from this same normal distribution and corresponding p values where N ranges from 5 to 25. Green circles represent unmodified pairs of samples whereas red circles represent sets where top value of one and bottom value of other sample are dropped. c shows data obtained as N ranges from 10 to 20,000 in each set.
Figure 2
Figure 2
a shows green histogram for 10,000 t-scores determined by drawing two N=10 samples from a normal distribution with mean of 1 and SD of 1. Red histogram is also 10,000 t-scores determined by these same pairs of N=10 samples from same underlying distribution except highest value of one sampling and lowest value of the other sampling are systematically eliminated. b shows t scores and corresponding p values obtained from running 10,000 t-tests on N samples drawn from this same normal distribution and corresponding p values where N ranges from 5 to 25. Green circles represent unmodified pairs of samples whereas red circles represent sets where top value of one and bottom value of other sample are dropped. c shows data obtained as N ranges from 10 to 20,000 in each set.
Figure 3
Figure 3
a The effect of varying SD on probability of a p<0.05 difference determined by the t-test. Again green refers to unmodified sets whereas red refers to sets where top value of one and bottom value of other are dropped. N=10 was used for unmodified sets. b Wilcoxon test performed on two sets as described previously as N was allowed to range from 10 to 100. c Probability of obtaining a p<0.05 value with initial N=10 in each group (green) as the number of pairs of top and bottom values which are dropped (red) is increased from 1 to 5.
Figure 3
Figure 3
a The effect of varying SD on probability of a p<0.05 difference determined by the t-test. Again green refers to unmodified sets whereas red refers to sets where top value of one and bottom value of other are dropped. N=10 was used for unmodified sets. b Wilcoxon test performed on two sets as described previously as N was allowed to range from 10 to 100. c Probability of obtaining a p<0.05 value with initial N=10 in each group (green) as the number of pairs of top and bottom values which are dropped (red) is increased from 1 to 5.
Figure 4.
Figure 4.
Fit of formula 2*(log(n)^.5/(n^0.5) (purple small dots) to mean t-values determined with 10,000 simulations performed as N was increased from 10-20,000 with no modification (green) or single top and bottom values from data set pairs dropped (red).

References

    1. Altman DG. The scandal of poor medical research. BMJ. 1994;308(6924):283–4. 10.1136/bmj.308.6924.283 - DOI - PMC - PubMed
    1. Hanin L Why statistical inference from clinical trials is likely to generate false and irreproducible results. BMC Med Res Methodol. 2017;17(1):127 10.1186/s12874-017-0399-0 - DOI - PMC - PubMed
    1. Ioannidis JP. Why most published research findings are false. PLoS Med. 2005;2(8):e124 10.1371/journal.pmed.0020124 - DOI - PMC - PubMed
    1. Wade N, Broad WJ. Betrayers of the truth. First ed: New York: Simon and Schuster; 1983.
    1. Altman N, Krzywinski M. Analyzing outliers: influential or nuisance? Nat Methods. 2016;13(4):281–2. 10.1038/nmeth.3812 - DOI - PubMed

LinkOut - more resources