

A multivariate analysis on spatiotemporal evolution of Covid-19 in Brazil
- PMID: 32923749
- PMCID: PMC7474832
- DOI: 10.1016/j.idm.2020.08.012
A multivariate analysis on spatiotemporal evolution of Covid-19 in Brazil
Abstract
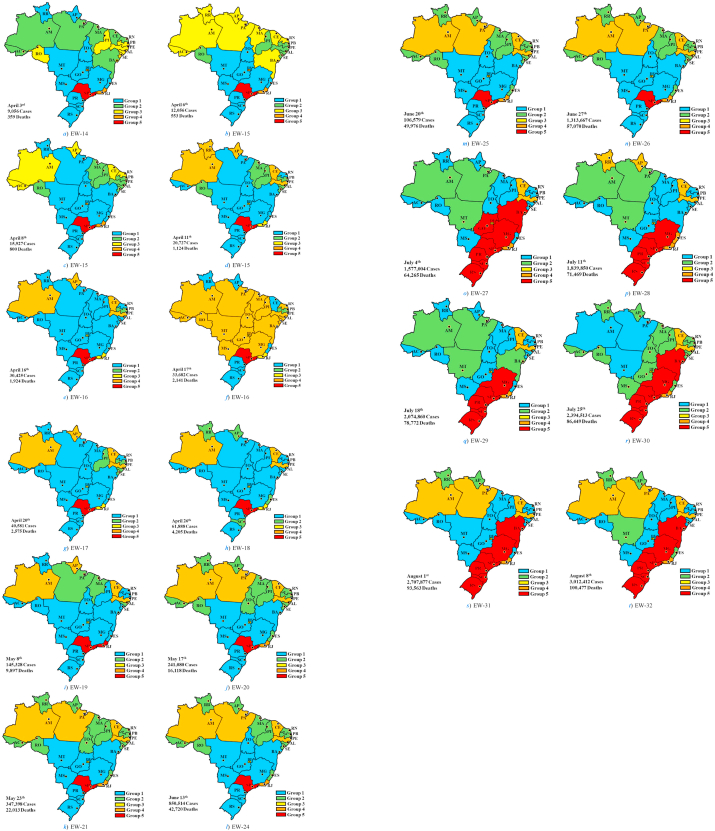
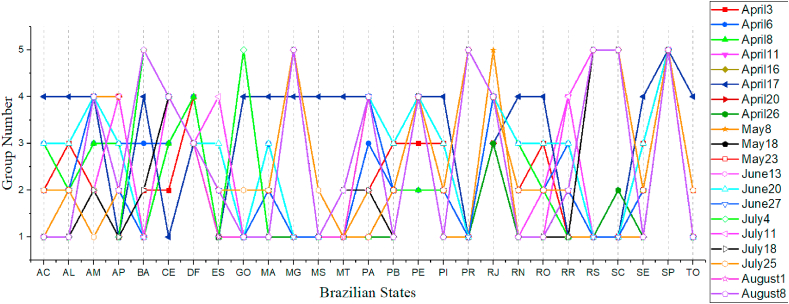
This data-driven work aims to analyze and classify the spatiotemporal distribution of all Brazilian states considering data so diverse as the number of Covid-19 cases, deaths, confirmed cases per 100 k inhabitants, mortality per 100 k inhabitants and case fatality rates as health indicators. We also considered population, area and population density as geographic indicators. Finally, GDP and HDI were taken into account as economic and social criteria. For this task data were collected from April 3rd until August 8th, 2020, corresponding to epidemiological weeks 14-32, reaching three million cases and a hundred thousand deaths. With this data it was possible to classify Brazilian states using multivariate methods into possible groups by means of non-hierarchical (k-means) cluster as well as factor analysis. It was possible to group all states plus the Federal District into five clusters, taking into account these 10 variables over the first five months of the epidemic. Group changes between states were observed over time and clusters, and between three and four factors were found. However, even with great difference on health indicators during days, the number of clusters remains fixed. Also, São Paulo and Rio de Janeiro states were ranked at top list taking into account all epidemiological weeks. Correlations were observed between variables, such as the number of Covid cases and deaths with GDP for most of epidemiological weeks. Some clusters were more critical due to specific variables, including cities that are main hotspots. These multivariate findings would provide a comprehensive description of the ongoing Covid-19 epidemic and may help to guide subsequent studies to understand and control virus transmission.
Keywords: COVID-19; Coronavirus; Factor analysis; K-means clustering; Pandemic; Spatiotemporal analysis.
© 2020 The Authors. Production and hosting by Elsevier B.V. on behalf of KeAi Communications Co., Ltd.
Figures


Similar articles
-
[The social geography of AIDS in Brazil].Rev Saude Publica. 1995 Feb;29(1):52-62. doi: 10.1590/s0034-89101995000100009. Rev Saude Publica. 1995. PMID: 8525314 Review. Portuguese.
-
Multicity study of air pollution and mortality in Latin America (the ESCALA study).Res Rep Health Eff Inst. 2012 Oct;(171):5-86. Res Rep Health Eff Inst. 2012. PMID: 23311234
-
Factors associated with the spatial heterogeneity of the first wave of COVID-19 in France: a nationwide geo-epidemiological study.Lancet Public Health. 2021 Apr;6(4):e222-e231. doi: 10.1016/S2468-2667(21)00006-2. Epub 2021 Feb 6. Lancet Public Health. 2021. PMID: 33556327 Free PMC article.
-
Unsupervised analysis of COVID-19 pandemic evolution in brazilian states.Procedia Comput Sci. 2022;196:655-662. doi: 10.1016/j.procs.2021.12.061. Epub 2022 Jan 10. Procedia Comput Sci. 2022. PMID: 35035625 Free PMC article.
-
Predicting the number of total COVID-19 cases and deaths in Brazil by the Gompertz model.Nonlinear Dyn. 2020;102(4):2951-2957. doi: 10.1007/s11071-020-06056-w. Epub 2020 Nov 3. Nonlinear Dyn. 2020. PMID: 33162673 Free PMC article.
Cited by
-
Covid-19 Outbreak in Brazil: Health, Social, Political, and Economic Implications.Int J Health Serv. 2022 Oct;52(4):442-454. doi: 10.1177/00207314221122658. Epub 2022 Sep 4. Int J Health Serv. 2022. PMID: 36062608 Free PMC article. Review.
-
Unsupervised analysis of COVID-19 pandemic evolution in brazilian states: Vaccination Scenario.Procedia Comput Sci. 2023;219:1453-1461. doi: 10.1016/j.procs.2023.01.435. Epub 2023 Mar 22. Procedia Comput Sci. 2023. PMID: 36968662 Free PMC article.
-
Using hierarchical clustering analysis to evaluate COVID-19 pandemic preparedness and performance in 180 countries in 2020.BMJ Open. 2021 Nov 9;11(11):e049844. doi: 10.1136/bmjopen-2021-049844. BMJ Open. 2021. PMID: 34753756 Free PMC article.
-
Psychological distress among Brazilian workers during the initial stage of the COVID-19 pandemic: a descriptive study.Front Public Health. 2024 Feb 19;12:1283310. doi: 10.3389/fpubh.2024.1283310. eCollection 2024. Front Public Health. 2024. PMID: 38439755 Free PMC article.
References
-
- Ahlqvist E., Storm P., Käräjämäki A., Martinell M., Dorkhan M., Carlsson A., Vikman P., Prasad R.B., Aly D.M., Almgren P., Wessman Y., Shaat N., Spégel P., Mulder H., Lindholm E., Melander O., Hansson O., Malmqvist U., Lernmark Å.…Groop L. Novel subgroups of adult-onset diabetes and their association with outcomes: A data-driven cluster analysis of six variables. Lancet Diabetes Endocrinol. 2018;6:361–369. - PubMed
-
- Alger B.E. Oxford University Press; New York: 2019. Defense of the scientific hypothesis: From reproducibility crisis to Big data.
-
- Bartlett M.S. A note on the multiplying factors for various χ2 approximations. Journal of the Royal Statistical Society: Series B. 1954;16:296–298.
-
- Borba M.G.S., Val F.F.A., Sampaio V.S., Alexandre M.A.A., Melo G.C., Brito M., Mourão M.P.G., Brito-Sousa J.D., Baía-da-Silva D., Guerra M.V.F., Hajjar L.A., Pinto R.C., Balieiro A.A.S., Pacheco A.G.F., Santos J.D.O., Jr., Naveca F.G., Xavier M.S., Siqueira A.M., Schwarzbold A.…Lacerda M.V.G. Effect of high vs low doses of chloroquine diphosphate as adjunctive therapy for patients hospitalized with severe acute respiratory syndrome coronavirus 2 (SARS-CoV-2) infection A randomized clinical trial. JAMA Network Open. 2020;3:1–14. - PubMed
LinkOut - more resources
Full Text Sources
Miscellaneous
