. 2020 Jul 28;4(9):1302-1315.
doi: 10.1002/hep4.1558. eCollection 2020 Sep.

The Selective Peroxisome Proliferator-Activated Receptor Gamma Modulator CHS-131 Improves Liver Histopathology and Metabolism in a Mouse Model of Obesity and Nonalcoholic Steatohepatitis

Affiliations

The Selective Peroxisome Proliferator-Activated Receptor Gamma Modulator CHS-131 Improves Liver Histopathology and Metabolism in a Mouse Model of Obesity and Nonalcoholic Steatohepatitis

Nikolaos Perakakis et al. Hepatol Commun. .

Abstract

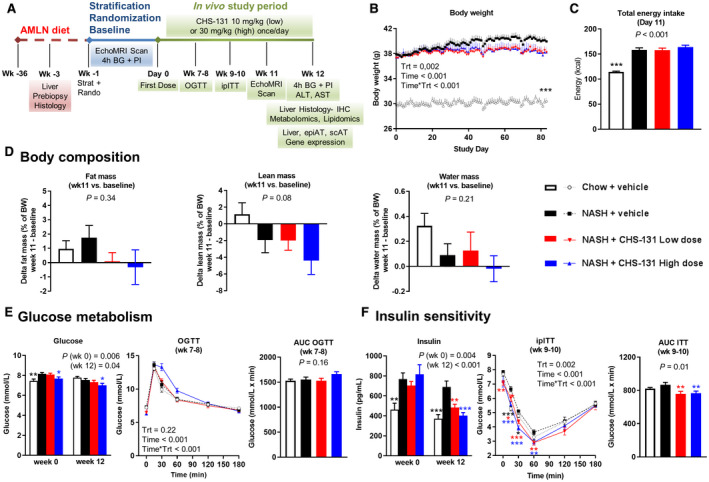
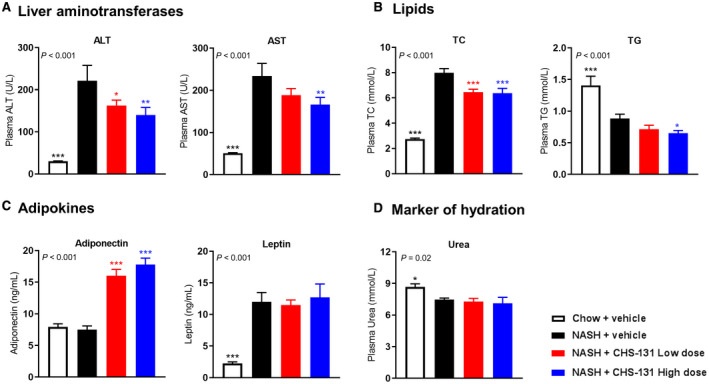
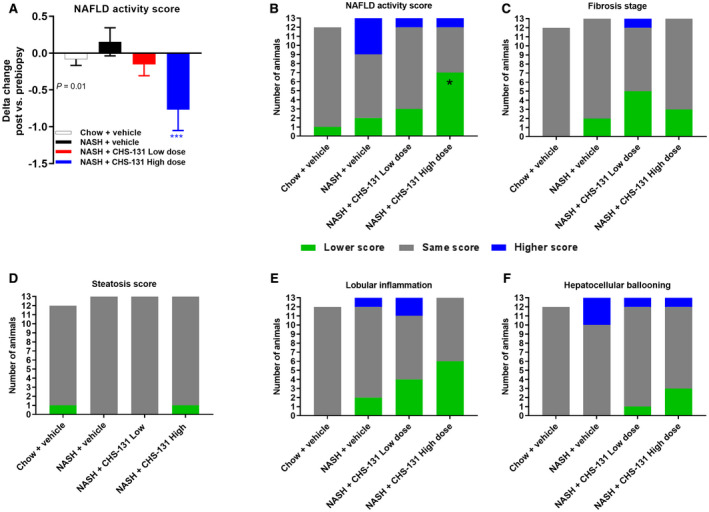
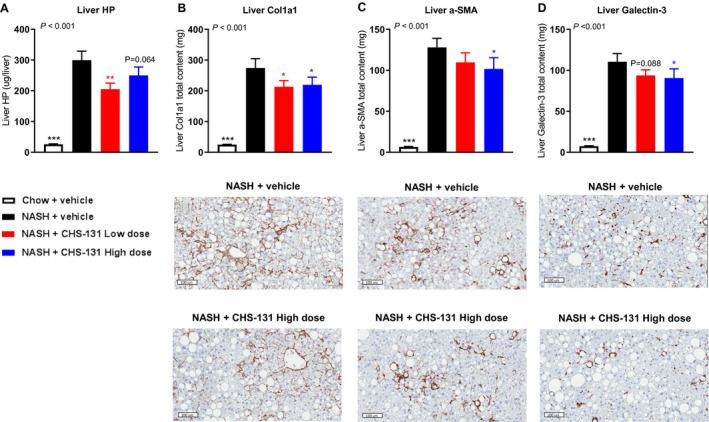
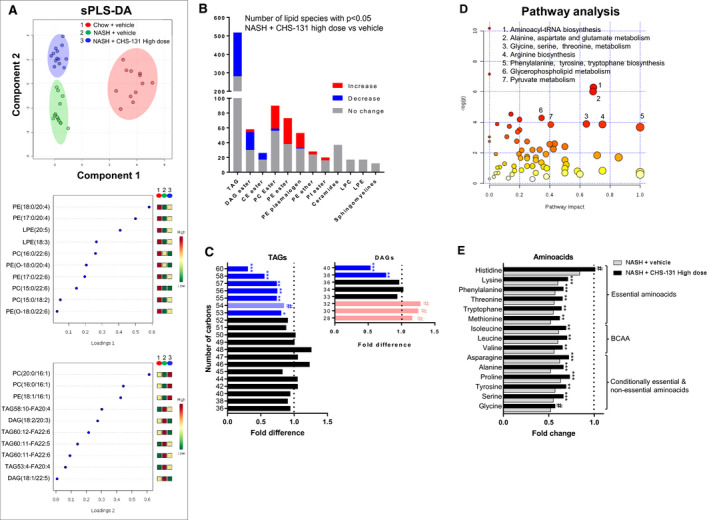
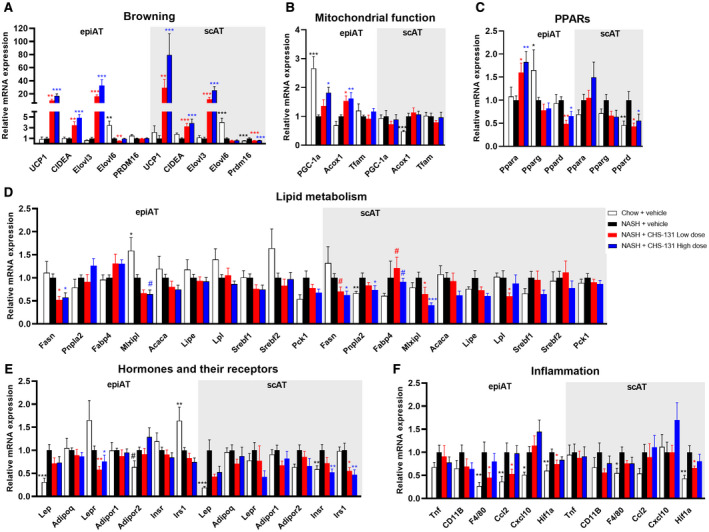
CHS-131 is a selective peroxisome proliferator-activated receptor gamma modulator with antidiabetic effects and less fluid retention and weight gain compared to thiazolidinediones in phase II clinical trials. We investigated the effects of CHS-131 on metabolic parameters and liver histopathology in a diet-induced obese (DIO) and biopsy-confirmed mouse model of nonalcoholic steatohepatitis (NASH). Male C57BL/6JRj mice were fed the amylin liver NASH diet (40% fat with trans-fat, 20% fructose, and 2% cholesterol). After 36 weeks, only animals with biopsy-confirmed steatosis and fibrosis were included and stratified into treatment groups (n = 12-13) to receive for the next 12 weeks (1) low-dose CHS-131 (10 mg/kg), (2) high-dose CHS-131 (30 mg/kg), or (3) vehicle. Metabolic parameters, liver pathology, metabolomics/lipidomics, markers of liver function and liver, and subcutaneous and visceral adipose tissue gene expression profiles were assessed. CHS-131 did not affect body weight, fat mass, lean mass, water mass, or food intake in DIO-NASH mice with fibrosis. CHS-131 improved fasting insulin levels and insulin sensitivity as assessed by the intraperitoneal insulin tolerance test. CHS-131 improved total plasma cholesterol, triglycerides, alanine aminotransferase, and aspartate aminotransferase and increased plasma adiponectin levels. CHS-131 (high dose) improved liver histology and markers of hepatic fibrosis. DIO-NASH mice treated with CHS-131 demonstrated a hepatic shift to diacylglycerols and triacylglycerols with a lower number of carbons, increased expression of genes stimulating fatty acid oxidation and browning, and decreased expression of genes promoting fatty acid synthesis, triglyceride synthesis, and inflammation in adipose tissue. Conclusion: CHS-131 improves liver histology in a DIO and biopsy-confirmed mouse model of NASH by altering the hepatic lipidome, reducing insulin resistance, and improving lipid metabolism and inflammation in adipose tissue.


Figures

FIG. 1
FIG. 1
CHS‐131 improves insulin sensitivity without affecting body weight, body composition, energy intake, and glucose levels. (A) Schematic representation of the study design. (B) Body weight during the 12 weeks of treatment. Time is shown in minutes; Time*Trt indicates the interaction of parameters. (C) Total energy intake after 11 days of treatment. (D) Changes in body composition as percentage of body weight from baseline (start of treatment) up to week 11. (E) Glucose levels after 4 hours of fasting at start (week 0) and end (week 12) of treatment and during an OGTT at weeks 7‐8 (AUC of OGTT is also shown). (F) Insulin levels after 4 hours of fasting at start (week 0) and end (week 12) of treatment and during an ipITT at weeks 9‐10 (AUC of ipITT is also shown). One‐way ANOVA was performed for all single time‐point parameters (including body weight, which was analyzed only for the last study day) and two‐way ANOVA for parameters with multiple time points (OGTT, ipITT). For P < 0.05 (one‐way ANOVA) and for P < 0.05 for Trt (in two‐way ANOVA), one‐tailed *P < 0.05, **P < 0.01, ***P < 0.001, respectively, for post‐hoc LSD test for chow+vehicle (black stars) or NASH‐CHS‐131 low dose (red stars) or NASH‐CHS‐131 high dose (blue stars) compared to NASH+vehicle. Data show means ± SEMs. Abbreviations: AUC, area under the curve; BG, blood glucose; BW, body weight; PI, plasma insulin; min, minutes; Rando, randomized; Strat, stratification; Trt, treatment.
FIG. 2
FIG. 2
CHS‐131 reduces aminotransferases and TC and increases adiponectin levels. Plasma levels of (A) liver aminotransferases (ALT and AST), (B) lipids (TC and TG), (C) adipokines (adiponectin and leptin), and (D) urea (as marker of hydration) after 12 weeks of treatment. For P < 0.05 (one‐way ANOVA), one‐tailed *P < 0.05, **P < 0.01, ***P < 0.001 for post‐hoc LSD test for chow+vehicle (black stars) or NASH‐CHS‐131 low dose (red stars) or NASH‐CHS‐131 high dose (blue stars) compared to NASH+vehicle,. Data represent means ± SEMs.
FIG. 3
FIG. 3
CHS‐131 reduces the NAFLD activity score mainly by improving lobular inflammation. (A) Comparison of histologic outcomes in posttreatment versus pretreatment biopsy. (B) Delta change of the NAS; number of animals with lower, same, or higher scores. NAS (C) fibrosis stage, (D) steatosis, (E) lobular inflammation, (F) hepatocellular ballooning. *** (blue stars) in (A) indicates P < 0.001 for post‐hoc LSD by one‐tailed ANOVA P = 0.01 and * (black star) in (B) indicates P < 0.05 for one‐tailed Fischer’s exact test compared to NASH+vehicle.
FIG. 4
FIG. 4
CHS‐131 does not affect the fibrosis stage but reduces markers of fibrosis, stellate cell activation, and inflammation. Liver content in (A) hydroxyproline, (B) Col1a1, (C) α‐SMA, and (D) Gal‐3. Images below (B‐D) represent IHC from NASH+vehicle and NASH+CHS‐131 high dose. For P < 0.05 (one‐tailed ANOVA), *P < 0.05, **P < 0.01, ***P < 0.001 for post‐hoc LSD test for chow+vehicle (black stars) or NASH‐CHS‐131 low dose (red stars) or NASH‐CHS‐131 high dose (blue stars) compared to NASH+vehicle. Data represent means ± SEMs.
FIG. 5
FIG. 5
Effects of CHS‐131 treatment on hepatic lipidomic and metabolomic profile. (A) Scoreplot and loadings of the two main components in sPLS‐DA analysis. (B) Number of lipid species with significant increase, decrease, or no change in their hepatic concentrations after treatment with high‐dose CHS‐131 compared to vehicle. (C) Mean fold changes in hepatic concentrations of TAGs and DAGs according to the number of carbons after treatment with high‐dose CHS‐131 (columns) compared to vehicle (dotted line) in mice with NASH. (D) Score plot of pathway analysis indicating pathway impact (x axis) in relation to the P value (y axis) in metabolites in CHS‐131 versus vehicle‐treated mice with NASH. (E) Mean fold changes in amino acid concentrations in CHS‐131 (black columns) or vehicle‐treated (gray columns) NASH mice compared to non‐NASH chow‐fed mice (dotted line). # P = 0.05‐0.1, *P < 0.05, **P < 0.01, ***P < 0.001, two‐tailed Student t test or Mann‐Whitney test (for TAGs and DAGs) or Welch’s two‐sample t test (for amino acids) for the comparison with the NASH mice group treated with vehicle. Abbreviations: CE, cholesterol ester; LPC, lysophosphatidylcholine; LPE, lysophosphatidylethanolamine; PI, phosphatidylinositol; tRNA, transfer RNA.
FIG. 6
FIG. 6
Effects of CHS‐131 treatment on the gene expression profile in epiAT and scAT. Relative mRNA expression levels of genes involved in (A) browning, (B) mitochondrial function, (C) PPARs, (D) lipid metabolism, (E) hormones and their receptors, (F) inflammation. For P < 0.05 with ANOVA or Kruskal‐Wallis test, # P = 0.05‐0.1, *P < 0.05, **P < 0.01, ***P < 0.001 for two‐tailed Fischer’s LSD or Dunn’s test for the comparison of each group (chow; NASH treated with CHS‐131 low dose or high dose) versus the NASH mice group treated with vehicle. Data represent means ± SEMs. Abbreviations: Acaca, acetyl‐coenzyme A carboxylase alpha; Adipoq, adiponectin, C1Q and collagen domain containing; Adipor, adiponectin receptor; CIDEA, cell death‐inducing DNA fragmentation factor alpha‐like effector; Cxcl10, C‐X‐C motif chemokine 10; Elovl, elongation of very long‐chain fatty acids‐like; Hif1a, hypoxia inducible factor 1 subunit alpha; Insr, insulin receptor; Irs1, insulin receptor substrate 1; Lep, leptin; Lepr, leptin receptor; Lipe, lipase, hormone sensitive; Lpl, lipoprotein lipase; mRNA, messenger RNA; Pck1, phosphoenolpyruvate carboxykinase 1; Pnpla2, patatin‐like phospholipase domain‐containing protein 2; PRDM, PR domain containing 16; Srebf, sterol regulatory element binding transcription factor; Tfam, transcription factor A, mitochondrial; Tnf, tumor necrosis factor; UCP1, uncoupling protein 1.

References

    1. Younossi Z, Tacke F, Arrese M, Chander Sharma B, Mostafa I, Bugianesi E, et al. Global perspectives on nonalcoholic fatty liver disease and nonalcoholic steatohepatitis. Hepatology 2019;69:2672‐2682. - PubMed
    1. Younossi ZM, Golabi P, de Avila L, Paik JM, Srishord M, Fukui N, et al. The global epidemiology of NAFLD and NASH in patients with type 2 diabetes: a systematic review and meta‐analysis. J Hepatol 2019;71:793‐801. - PubMed
    1. Buzzetti E, Pinzani M, Tsochatzis EA. The multiple‐hit pathogenesis of non‐alcoholic fatty liver disease (NAFLD). Metabolism 2016;65:1038‐1048. - PubMed
    1. Sanyal AJ, Chalasani N, Kowdley KV, McCullough A, Diehl AM, Bass NM, et al.; NASH CRN . Pioglitazone, vitamin E, or placebo for nonalcoholic steatohepatitis. N Engl J Med 2010;362:1675‐1685. - PMC - PubMed
    1. Cusi K, Orsak B, Bril F, Lomonaco R, Hecht J, Ortiz‐Lopez C, et al. Long‐term pioglitazone treatment for patients with nonalcoholic steatohepatitis and prediabetes or type 2 diabetes mellitus: a randomized trial. Ann Intern Med 2016;165:305‐315. - PubMed