

PEBP1 suppresses HIV transcription and induces latency by inactivating MAPK/NF-κB signaling
- PMID: 32924251
- PMCID: PMC7645261
- DOI: 10.15252/embr.201949305
PEBP1 suppresses HIV transcription and induces latency by inactivating MAPK/NF-κB signaling
Abstract
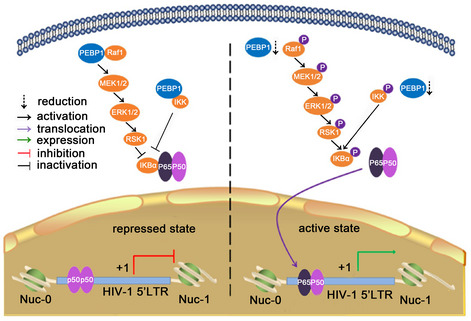
The latent HIV-1 reservoir is a major barrier to viral eradication. However, our understanding of how HIV-1 establishes latency is incomplete. Here, by performing a genome-wide CRISPR-Cas9 knockout library screen, we identify phosphatidylethanolamine-binding protein 1 (PEBP1), also known as Raf kinase inhibitor protein (RKIP), as a novel gene inducing HIV latency. Depletion of PEBP1 leads to the reactivation of HIV-1 in multiple models of latency. Mechanistically, PEBP1 de-phosphorylates Raf1/ERK/IκB and IKK/IκB signaling pathways to sequestrate NF-κB in the cytoplasm, which transcriptionally inactivates HIV-1 to induce latency. Importantly, the induction of PEBP1 expression by the green tea compound epigallocatechin-3-gallate (EGCG) prevents latency reversal by inhibiting nuclear translocation of NF-κB, thereby suppressing HIV-1 transcription in primary CD4+ T cells isolated from patients receiving antiretroviral therapy (ART). These results suggest a critical role for PEBP1 in the regulation of upstream NF-κB signaling pathways governing HIV transcription. Targeting of this pathway could be an option to control HIV reservoirs in patients in the future.
Keywords: CRISPR-Cas9; HIV latency; NF-κB; PEBP1; genome-wide screening.
© 2020 The Authors. Published under the terms of the CC BY NC ND 4.0 license.
Conflict of interest statement
The authors declare that they have no conflict of interest.
Figures
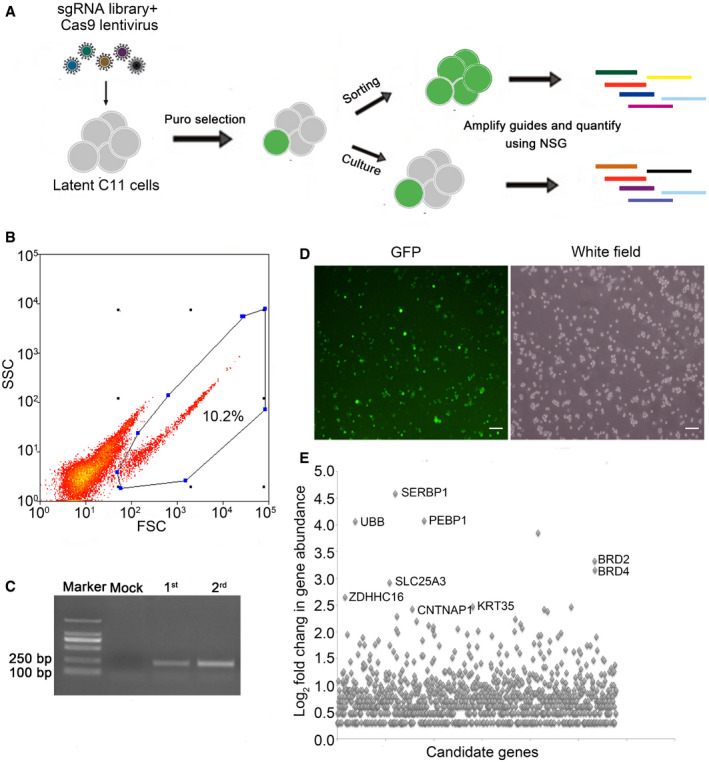
The outline of the genome‐wide CRISPR screen strategy. C11 cells were infected with a lentiviral library containing Cas9 proteins and sgRNAs that target 19,050 human genes. After fourteen days of puromycin selection, genomic DNA was extracted from GFP‐positive cells after two rounds of sorting. The candidate genes were then identified by next generation sequencing.
Flow cytometry of cells infected with the lentiCRISPR v2.0 library where the expression of GFP indicates latency reactivation. Target genes were enriched through two‐round sorting. Continuously cultured C11 latent cells infected with the lentiCRISPRv2.0 served as control. Blue dots and the encircled area represent the GFP‐positive cells for flow cytometry analysis.
Validation of sgRNAs in unsorted and sorted C11 cells by PCR after lentiCRISPR v2.0 library infection.
Before next generation sequencing, the GFP expression in two‐round sorted C11 cells was confirmed by fluorescence microscopy. Scale bar, 100 μm.
Fold change (Log2) of the abundance of target genes in sorted C11 cells. Enriched sgRNA genes are highlighted.
- A
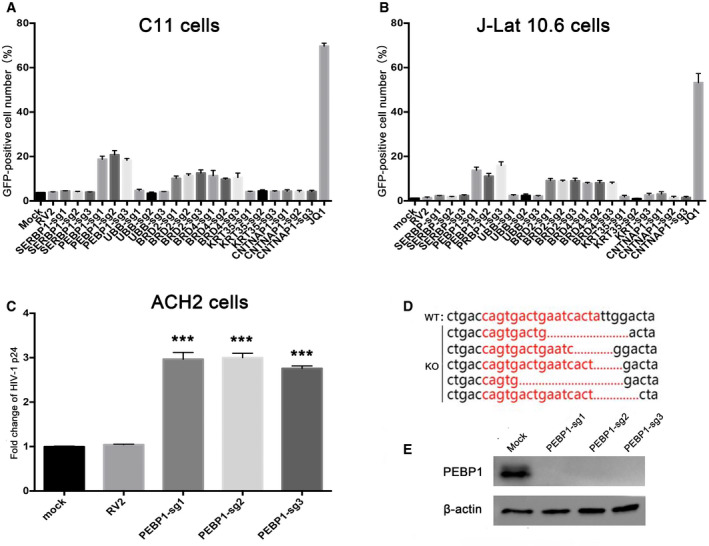
Validation of the top candidate genes in the C11 cell line. C11 cells were infected by lentiCRISPR v2.0 packaged lentiviruses with sgRNA following by screening for 14 days with 2 μg/ml puromycin. The percentage of GFP‐positive cells was measured by flow cytometry to determine the level of HIV‐1 reactivation.
- B, C
The effect of candidate genes on HIV latency was further verified in J‐Lat 10.6 (B) and ACH2 (C) models of HIV latency. GFP expression in J‐Lat 10.6 cells and p24 in ACH2 cells was analyzed by flow cytometry and ELISA, respectively.
- D
PEBP1 was deleted after CRISPR/Cas9 knockout. PCR products related to PEBP1 from control or PEBP1 knockout cells were cloned and then sequenced. PEBP1‐sg1 target sites are shown in red letters. Dashes indicate the deleted bases relative to the wild‐type PEBP1 gene sequence.
- E
PEBP1 protein levels were measured by Western blot after knock out in C11 cells by LvPEBP1‐sg1. Mock C11 cells served as control.
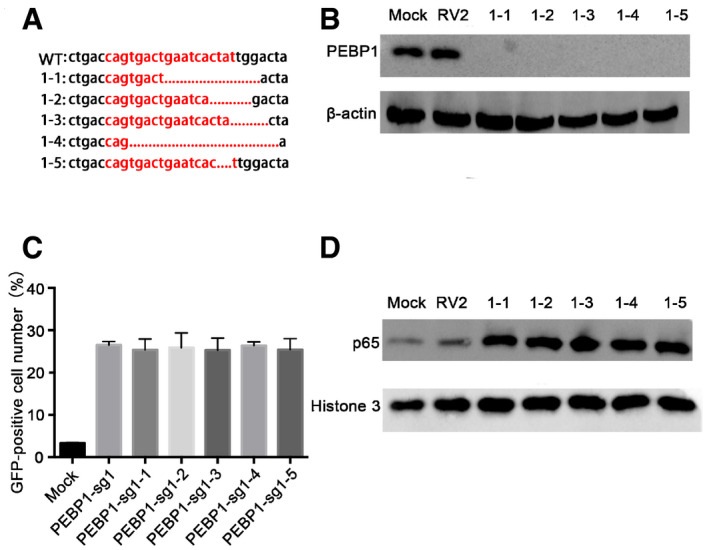
Sequencing of PEBP1 PCR products after monoclonal sorting. The PCR products of PEBP1 gene were cloned then sequenced. PEBP1‐sg1 target sites were shown in red letters. Dashes indicate the deleted bases relative to the wild‐type sequence. 1‐1, 1-2, 1‐3, 1-4, and 1‐5 represent different monoclonal cell lines, respectively.
The expression of PEBP1 was detected by Western blot in individual monoclonal cell lines.
The proportion of GFP‐positive cells was detected by flow cytometry after PEBP1 knockout.
The levels of nuclear NF‐κB/p65 protein were analyzed by Western blot in different monoclonal cell lines and the mock C11 cells.
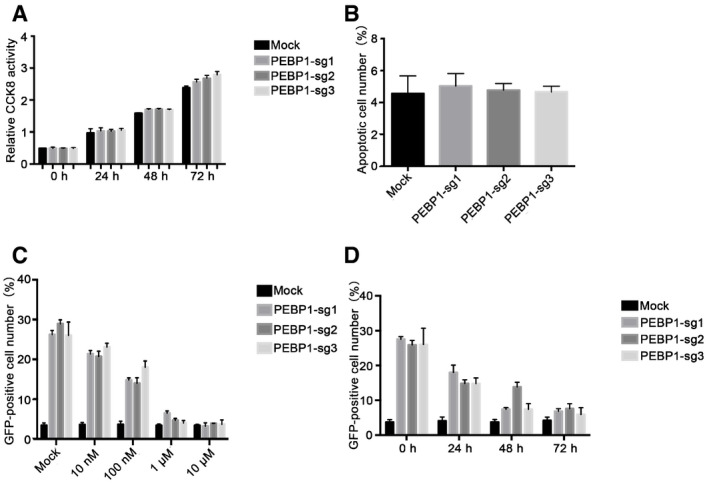
Cell proliferation of PEBP1‐KO-C11 cells and mock C11 cells was analyzed by CCK‐8 levels.
Apoptosis of PEBP1‐KO-C11 cells and mock C11 cells was measured by TUNEL staining followed by flow cytometry.
The expression of GFP in the cells was measured by flow cytometry in C11‐PEBP1‐KO and mock C11 cells after treatment with NF‐κB inhibitor SC75741 for 48 h.
The expression of GFP in the cells was detected by flow cytometry in C11‐PEBP1‐KO and mock C11 cells after treatment with 1 μM of NF‐κB inhibitor SC75741 at different time points.
- A
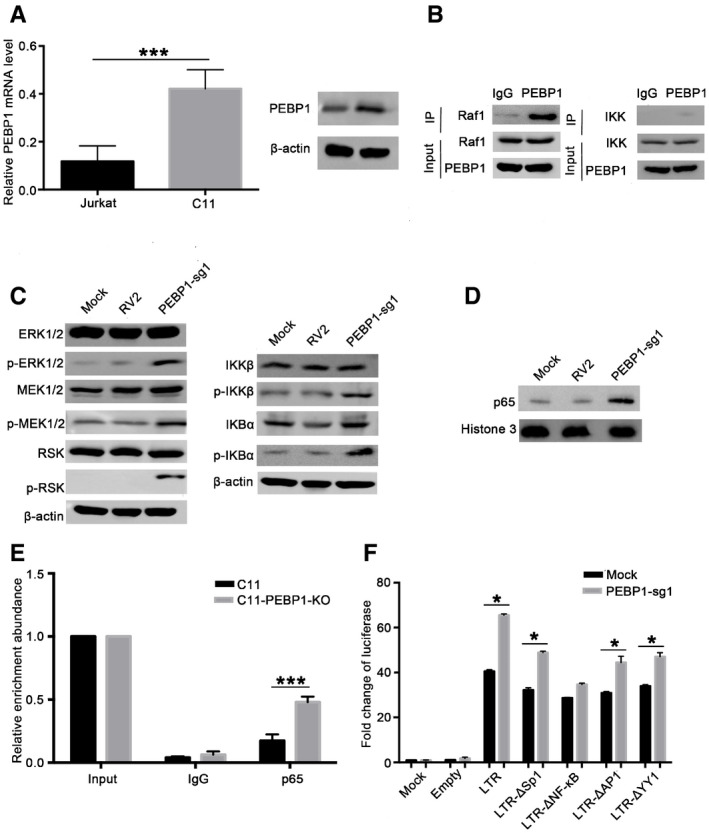
PEBP1 expression was measured by qPCR (left panel) and Western blot (right panel) in the latently infected C11 cells and the parental Jurkat cells.
- B
The immunoprecipitation assay was performed in C11 cell lysates with anti‐PEBP1 antibody followed by Western blot with anti‐Raf1 or anti‐IKK antibodies.
- C, D
Effect of PEBP1 on the Raf1/ERK/IκB and IKK/IκB/NF-κB signaling pathways. The levels of indicated proteins in total protein lysates (C) or the levels of NF‐κB/p65 protein in nucleus (D) were analyzed by Western blot in C11‐PEBP1‐KO cells and mock C11 cells.
- E
NF‐κB/p65 protein recruitment into HIV LTR was analyzed by ChIP‐qPCR with specific primers targeting the HIV LTR after normalization to the input.
- F
The impact of PEBP1 on the activation of the HIV LTR was explored by luciferase reporter assay in 293T cells. 293T cells were co‐transfected with PEBP1‐sg1 alone or PEBP1‐sg1 with HIV‐1 LTR‐empty plasmids, HIV‐1 wild‐type LTR‐luciferase plasmids, HIV‐1 LTR‐Δsp1‐luciferase, HIV‐1 LTR‐ΔNF‐κB‐luciferase, HIV‐1 LTR‐ΔAp1‐luciferase, or HIV‐1 LTR‐ΔYY1‐luciferase. Transcription of HIV‐1 was determined by luciferase reporter assay.
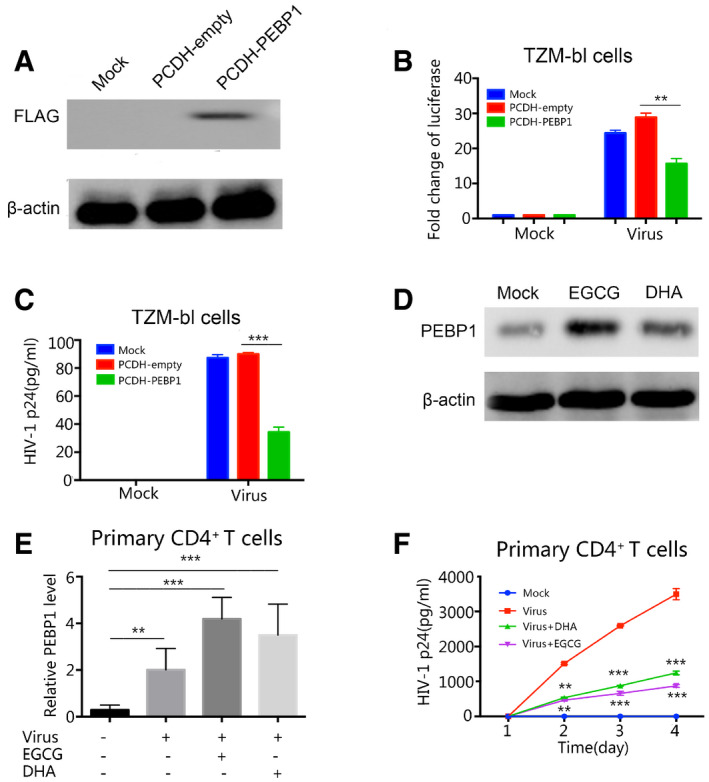
- A
The expression of PEBP1 was analyzed by Western blot in TZM‐bl cells infected with mock, Lv‐PCDH-empty, or Lv‐PCDH-PEBP1 plasmids.
- B, C
Overexpression of PEBP1 suppressed HIV‐1 replication. TZM‐bl cells were transfected with Lv-PCDH‐empty or Lv‐PCDH-PEBP1 followed by infection of HIV derived from patient plasma whose viral load is 129 copies/ml. The transcription of HIV‐1 was evaluated 72 h post‐infection by luciferase activity (B) and levels of p24 in the supernatants (C).
- D
The expression level of PEBP1 was detected by Western blot using the whole cell lysate of C11 cells treated with 10 μM EGCG or DHA for 24 h.
- E
Induction of PEBP1 by EGCG or DHA in HIV‐1 infected primary CD4+ T cells. Primary CD4+ T cells from healthy donors were treated with 10 μM EGCG or DHA during HIV‐1 infection. Similar to Panel B, HIV‐1 was isolated from the blood supernatants of patients receiving ART with a viral load of 129 copies/ml. Seventy‐two hours post‐treatment with 10 μM EGCG or DHA, the expression of PEBP1 was detected by qPCR.
- F
The induction of PEBP1 by EGCG or DHA suppressed HIV replication in the primary CD4+ T cells. The primary CD4+ T cells from healthy donors were treated with 10 μM EGCG or DHA during HIV‐1 infection. Similar to Panel B and E, HIV‐1 was isolated from the blood supernatants of patients receiving ART with a viral load of 129 copies/ml. The supernatants from HIV‐1-infected CD4+ T cell were collected 1, 2, 3 or 4 days post‐infection. Replication of HIV‐1 was analyzed by p24 ELISA.
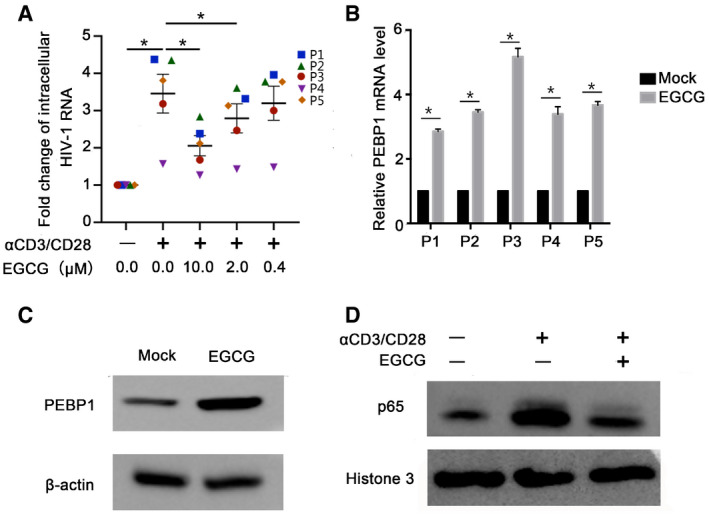
EGCG inhibited α‐CD3/CD28 reactivation of latent HIV‐1. Primary CD4+ T cells were isolated from HIV‐1-positive patients on antiretroviral therapy (n = 5, P1–P5). Primary CD4+ T cells were treated with α‐CD3/CD28 alone or α‐CD3/CD28 and 10 μM EGCG. Cell‐associated RNA was extracted 7 days post‐treatment. The transcription of HIV‐1 was determined by real‐time qPCR.
PEBP1 mRNA was induced by EGCG in patient primary CD4+ T cells. Primary CD4+ T cells were treated with 10 μM EGCG. The expression of PEBP1 in the cells was measured by qPCR.
PEBP1 protein was induced by EGCG in patient primary CD4+ T cells, which was determined by Western blot of whole cell lysate from primary CD4+ T cells.
EGCG‐induced PEBP1 suppressed nuclear entry of NF‐κB/p65. This was measured by Western blot of nuclear protein of primary CD4+ T cells treated with α‐CD3/CD28 or α‐CD3/CD28 plus 10 μM EGCG.
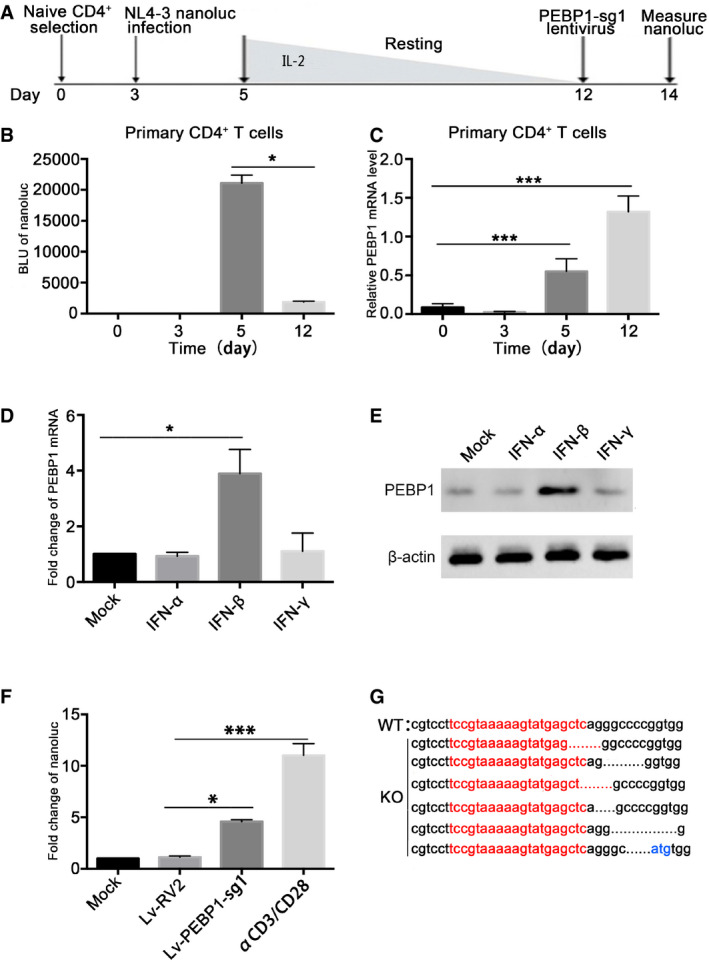
- A
Outline of latency establishment in the primary CD4+ T cells. Human primary CD4+ T cells were activated and expanded with α‐CD3/CD28 beads at day 1. The α‐CD3/CD28 beads were removed at day 3. Cells were then infected with HIV‐1 NL4.3‐nanoluc at 3rd day after expansion and maintained over 7 days with a decreasing concentration of IL‐2 to establish latency until day 12. At day 12, cells were infected with CRISPR/Cas9 and PEBP1‐sgRNA lentivirus.
- B
Transcription of HIV‐1 in the primary CD4+ T cells was determined by nanoluc‐luciferase assays during HIV‐1 infection.
- C
After infection with VSVG pseudotyped HIV‐1 NL4.3‐nanoluc, the mRNA expression of PEBP1 was measured by qPCR.
- D, E
Jurkat CD4+ T cells were treated with IFN‐α, IFN‐β, and IFN‐γ for 24 h. The mRNA (A) or protein (B) expression levels of PEBP1 were measured by qPCR or Western blot.
- F
PEBP1 knockout enhanced HIV‐1 transcription in the primary CD4+ T‐cell model of latency. The expression of HIV‐1 was measured by nanoluc after gene knockout where α‐CD3/CD28 stimulation served as a positive control.
- G
PEBP1 gene deletion after Lv‐PEBP1‐sg1 knockout in the primary CD4+ T cells. The PCR products of PEBP1 were cloned and then sequenced. PEBP1‐sg1 target gene sequences are shown in red letters. Dashes indicate deleted bases relative to the wild‐type sequence.
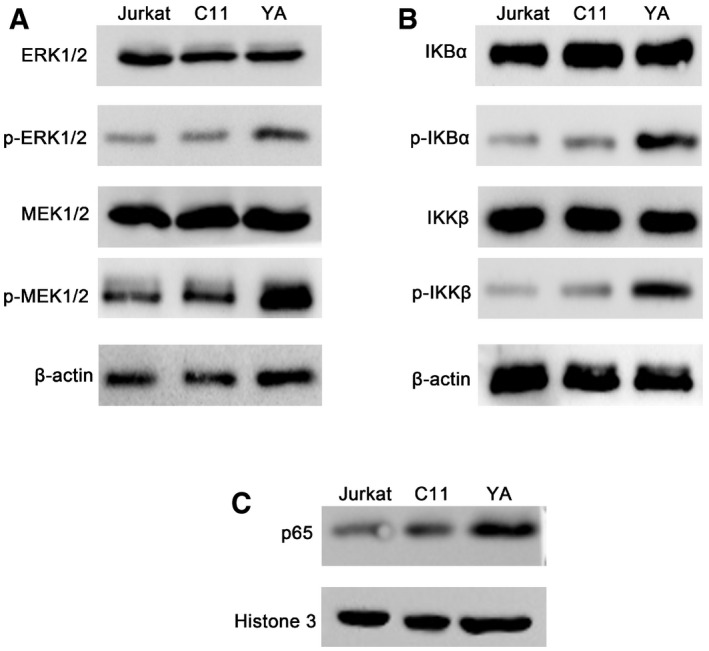
- A, B
Activation of Raf1/ERK/IκB (A) or IKK/IκB (B) signaling pathway was analyzed in total protein lysates by Western blot in Jurkat, C11, and YA cells.
- C
Nuclear levels of NF‐κB/p65 protein were analyzed by Western blot in Jurkat, C11, and YA cells.
Similar articles
-
NF-κB sub-pathways and HIV cure: A revisit.EBioMedicine. 2021 Jan;63:103159. doi: 10.1016/j.ebiom.2020.103159. Epub 2020 Dec 16. EBioMedicine. 2021. PMID: 33340992 Free PMC article. Review.
-
Maraviroc Is Associated with Latent HIV-1 Reactivation through NF-κB Activation in Resting CD4+ T Cells from HIV-Infected Individuals on Suppressive Antiretroviral Therapy.J Virol. 2018 Apr 13;92(9):e01931-17. doi: 10.1128/JVI.01931-17. Print 2018 May 1. J Virol. 2018. PMID: 29444937 Free PMC article.
-
Naf1 Regulates HIV-1 Latency by Suppressing Viral Promoter-Driven Gene Expression in Primary CD4+ T Cells.J Virol. 2016 Dec 16;91(1):e01830-16. doi: 10.1128/JVI.01830-16. Print 2017 Jan 1. J Virol. 2016. PMID: 27795436 Free PMC article.
-
Alternate NF-κB-Independent Signaling Reactivation of Latent HIV-1 Provirus.J Virol. 2019 Aug 28;93(18):e00495-19. doi: 10.1128/JVI.00495-19. Print 2019 Sep 15. J Virol. 2019. PMID: 31243131 Free PMC article.
-
Efficient Non-Epigenetic Activation of HIV Latency through the T-Cell Receptor Signalosome.Viruses. 2020 Aug 8;12(8):868. doi: 10.3390/v12080868. Viruses. 2020. PMID: 32784426 Free PMC article. Review.
Cited by
-
PD-1 suppression enhances HIV reactivation and T-cell immunity via MAPK/NF-κB signaling.Eur J Med Res. 2025 Apr 4;30(1):237. doi: 10.1186/s40001-025-02427-4. Eur J Med Res. 2025. PMID: 40186291 Free PMC article.
-
Targeting and Understanding HIV Latency: The CRISPR System against the Provirus.Pathogens. 2021 Sep 28;10(10):1257. doi: 10.3390/pathogens10101257. Pathogens. 2021. PMID: 34684206 Free PMC article. Review.
-
NF-κB sub-pathways and HIV cure: A revisit.EBioMedicine. 2021 Jan;63:103159. doi: 10.1016/j.ebiom.2020.103159. Epub 2020 Dec 16. EBioMedicine. 2021. PMID: 33340992 Free PMC article. Review.
-
Crotonylation sensitizes IAPi-induced disruption of latent HIV by enhancing p100 cleavage into p52.iScience. 2021 Dec 18;25(1):103649. doi: 10.1016/j.isci.2021.103649. eCollection 2022 Jan 21. iScience. 2021. PMID: 35024584 Free PMC article.
-
MTHFD2 promotes esophageal squamous cell carcinoma progression via m6A modification‑mediated upregulation and modulation of the PEBP1‑RAF1 interaction.Int J Mol Med. 2025 May;55(5):68. doi: 10.3892/ijmm.2025.5509. Epub 2025 Mar 7. Int J Mol Med. 2025. PMID: 40052596 Free PMC article.
References
-
- Alexaki A, Quiterio SJ, Liu Y, Irish B, Kilareski E, Nonnemacher MR, Wigdahl B (2007) PMA‐induced differentiation of a bone marrow progenitor cell line activates HIV‐1 LTR‐driven transcription. DNA Cell Biol 26: 387–394 - PubMed
Publication types
MeSH terms
Substances
Grants and funding
LinkOut - more resources
Full Text Sources
Medical
Research Materials
Miscellaneous
