

Catch-up growth is a better indicator of undernutrition than thresholds for stunting
- PMID: 32924910
- PMCID: PMC7754567
- DOI: 10.1017/S1368980020003067
Catch-up growth is a better indicator of undernutrition than thresholds for stunting
Abstract
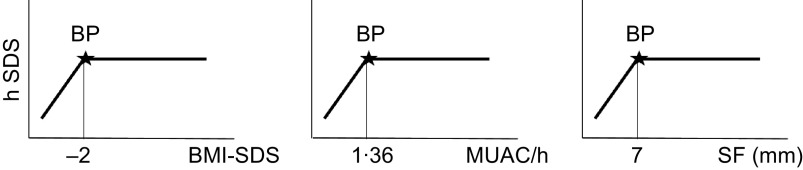
Objective: Stunting (height-for-age < -2 sd) is one of the forms of undernutrition and is frequent among children of low- and middle-income countries. But stunting perse is not a synonym of undernutrition. We investigated association between body height and indicators of energetic undernutrition at three critical thresholds for thinness used in public health: (1) BMI SDS < -2; (2) mid-upper arm circumference divided by height (MUAC (mm) × 10/height (cm) < 1·36) and (3) mean skinfold thickness (SF) < 7 mm and to question the reliability of thresholds as indicators of undernutrition.
Design: Cross-sectional study; breakpoint analysis.
Setting: Rural and urban regions of Indonesia and Guatemala - different socio-economic status (SES).
Participants: 1716 Indonesian children (6·0-13·2 years) and 3838 Guatemalan children (4·0-18·9 years) with up to 50 % stunted children.
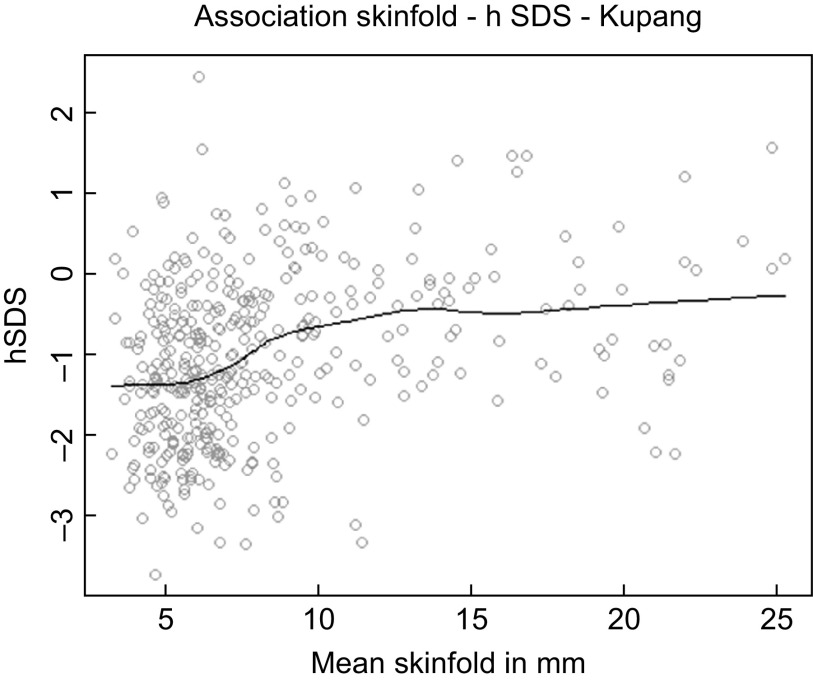
Results: When separating the regression of BMI, MUAC or SF, on height into distinguishable segments (breakpoint analysis), we failed to detect relevant associations between height, and BMI, MUAC or SF, even in the thinnest and shortest children. For BMI and SF, the breakpoint analysis either failed to reach statistical significance or distinguished at breakpoints above critical thresholds. For MUAC, the breakpoint analysis yielded negative associations between MUAC/h and height in thin individuals. Only in high SES Guatemalan children, SF and height appeared mildly associated with R2 = 0·017.
Conclusions: Currently used lower thresholds of height-for-age (stunting) do not show relevant associations with anthropometric indicators of energetic undernutrition. We recommend using the catch-up growth spurt during early re-feeding instead as immediate and sensitive indicator of past undernourishment. We discuss the primacy of education and social-economic-political-emotional circumstances as responsible factors for stunting.
Keywords: Catch-up growth; No threshold for stunting; Social-economic-political-emotional (SEPE) factors.
Figures
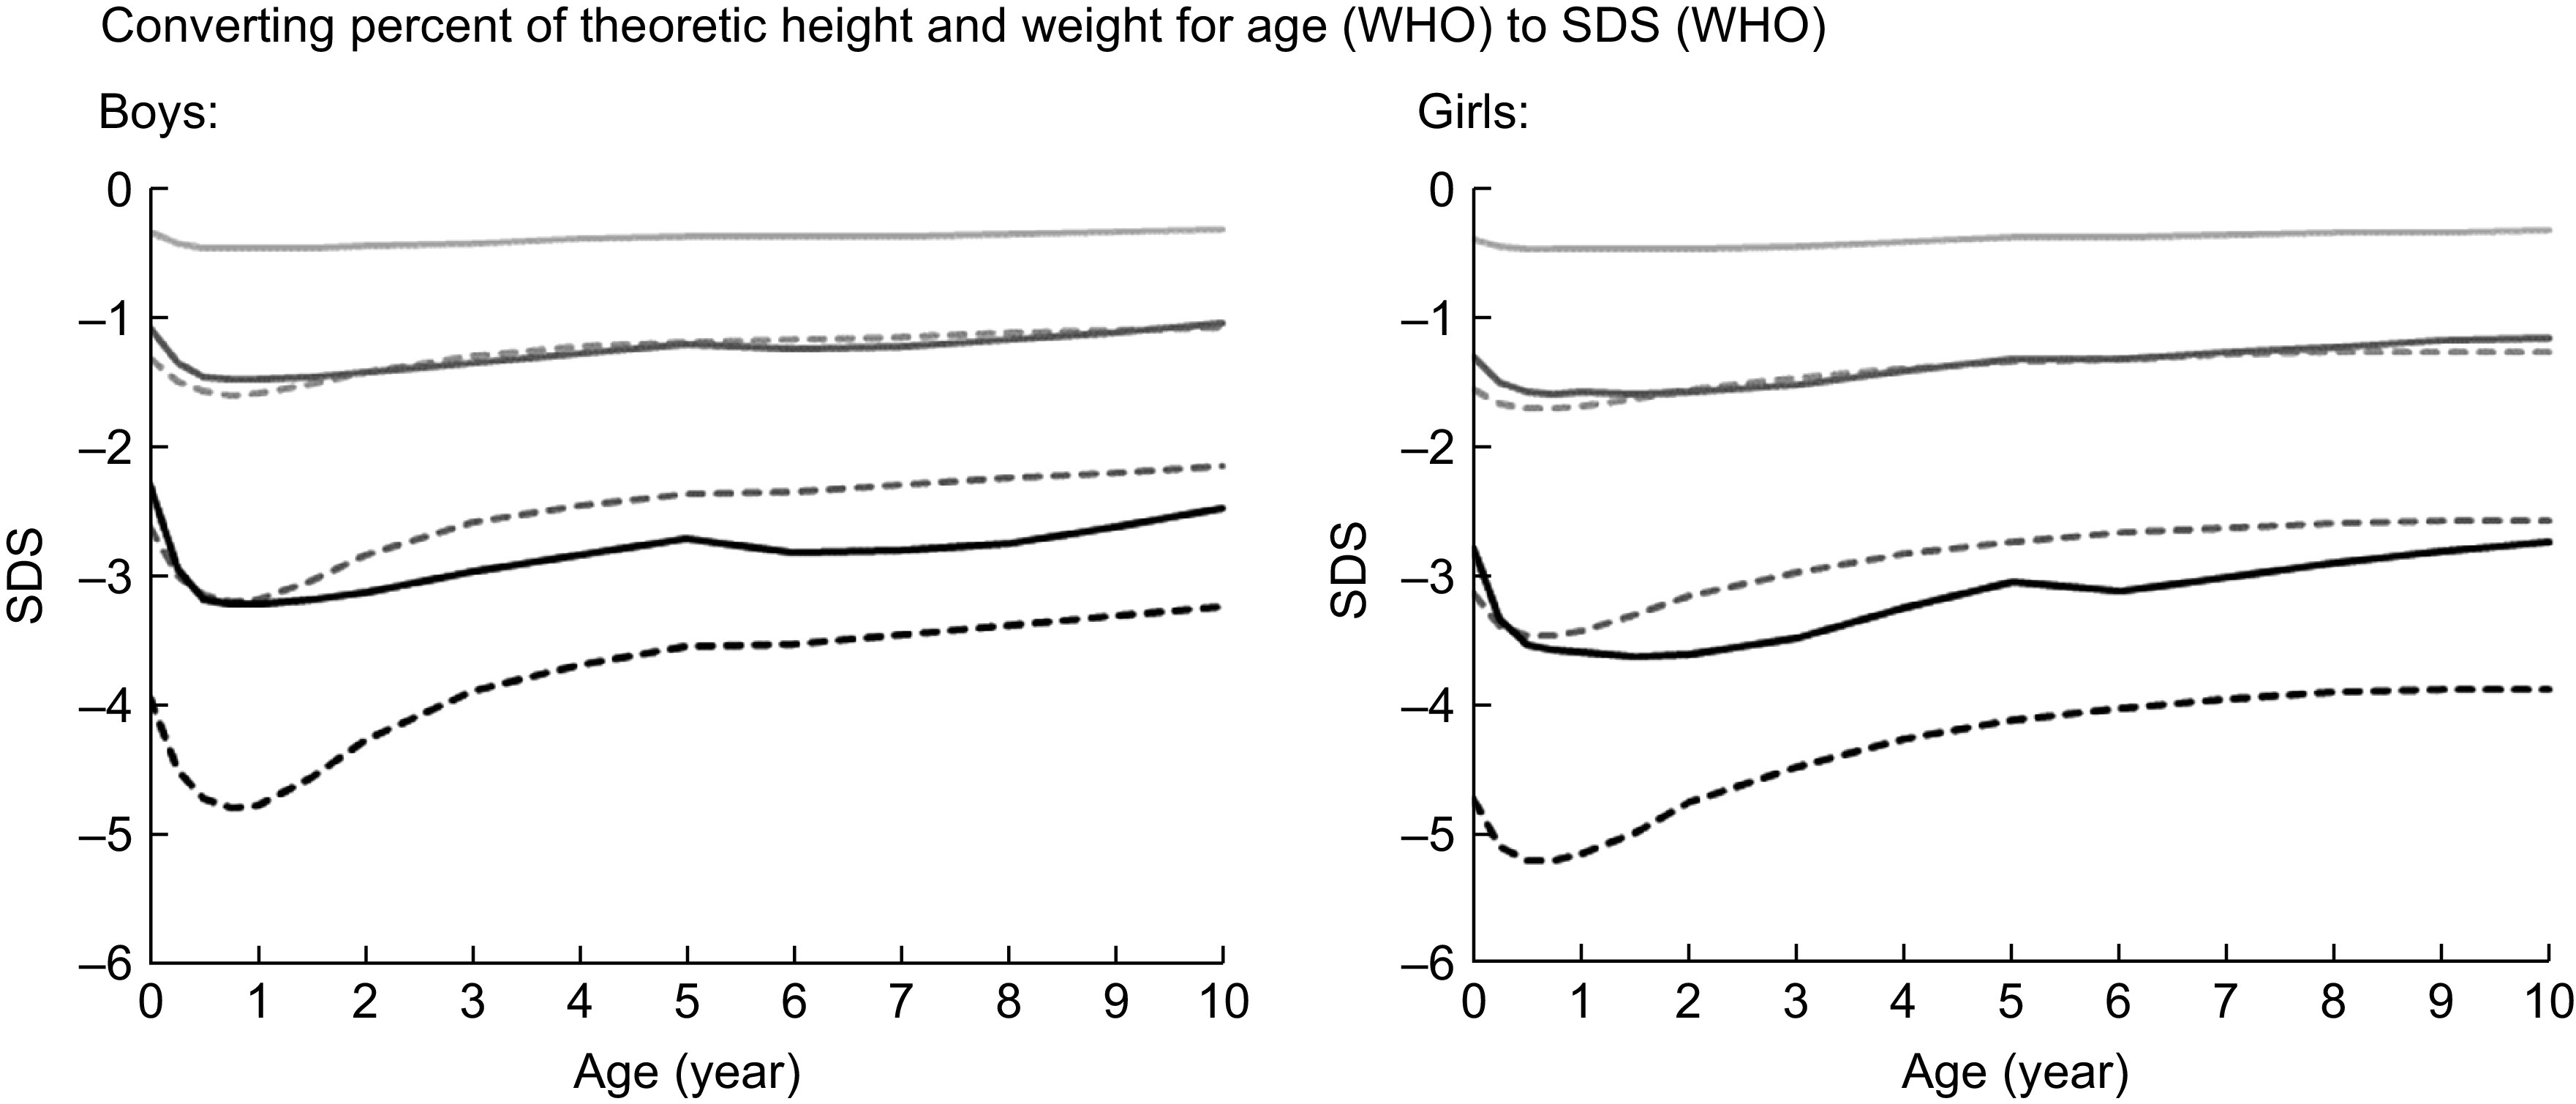
 , Weight 95 %;
  , height 95 %;
  , weight 85 %;
  , height 90 %;
  , weight 70 %;
  , height 85 %
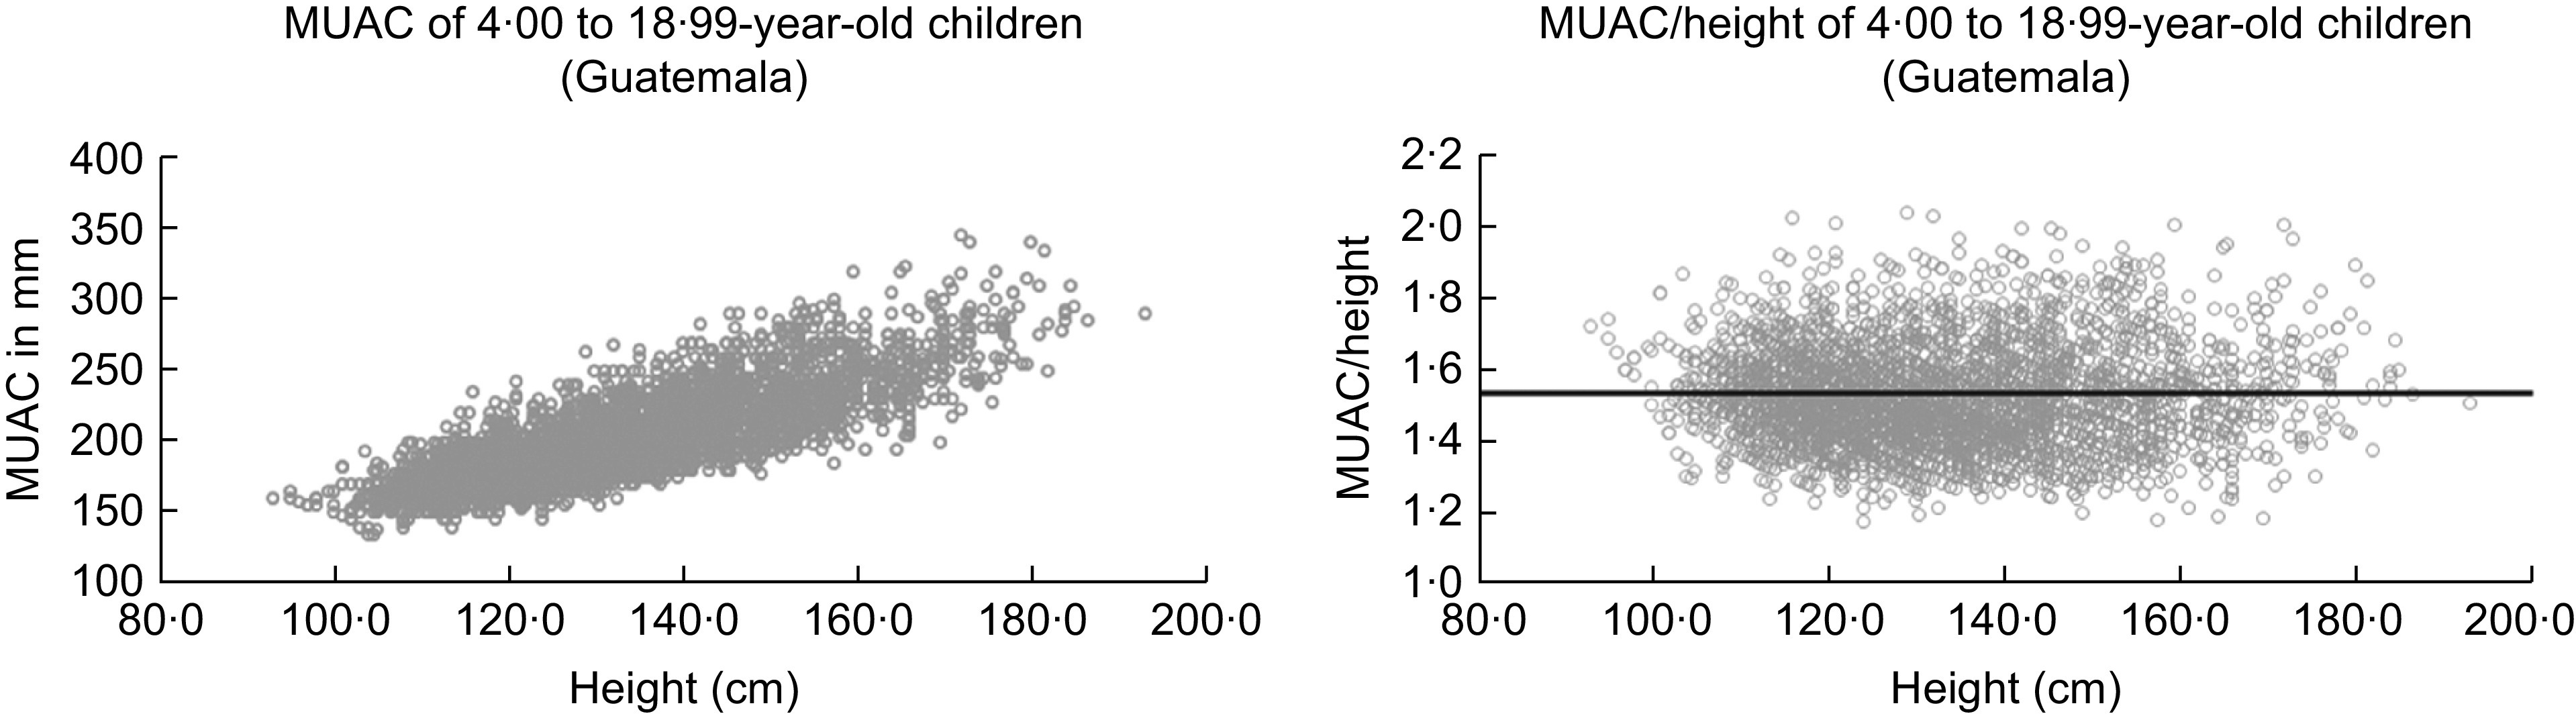
Similar articles
-
Stunting as a Synonym of Social Disadvantage and Poor Parental Education.Int J Environ Res Public Health. 2021 Feb 2;18(3):1350. doi: 10.3390/ijerph18031350. Int J Environ Res Public Health. 2021. PMID: 33540885 Free PMC article.
-
Public Health Implications of Wasting and Stunting Relationship in Children under Five Years Highly Vulnerable to Undernutrition in Guatemala: The REDAC Study.Nutrients. 2022 Sep 23;14(19):3945. doi: 10.3390/nu14193945. Nutrients. 2022. PMID: 36235598 Free PMC article.
-
Stunting is not a synonym of malnutrition.Eur J Clin Nutr. 2020 Mar;74(3):377-386. doi: 10.1038/s41430-019-0439-4. Epub 2019 May 29. Eur J Clin Nutr. 2020. PMID: 31142828
-
Is early puberty triggered by catch-up growth following undernutrition?Int J Environ Res Public Health. 2012 May;9(5):1791-809. doi: 10.3390/ijerph9051791. Epub 2012 May 9. Int J Environ Res Public Health. 2012. PMID: 22754473 Free PMC article. Review.
-
Beyond Boundaries: A Comprehensive Review of Anthropometric Indices in Urban and Rural India.Cureus. 2024 Feb 9;16(2):e53944. doi: 10.7759/cureus.53944. eCollection 2024 Feb. Cureus. 2024. PMID: 38468989 Free PMC article. Review.
Cited by
-
Longitudinal assessments of child growth: A six-year follow-up of a cluster-randomized maternal education trial.Clin Nutr. 2021 Sep;40(9):5106-5113. doi: 10.1016/j.clnu.2021.08.007. Epub 2021 Aug 20. Clin Nutr. 2021. PMID: 34461584 Free PMC article. Clinical Trial.
-
The body as a mirror of inequality in México during the second half of the twentieth century.Hist Cienc Saude Manguinhos. 2024 Jun 10;31:e2024018. doi: 10.1590/S0104-59702024000100018en. eCollection 2024. Hist Cienc Saude Manguinhos. 2024. PMID: 38865560 Free PMC article.
-
Impact of integrated preventive and curative health package on nutritional status of children under 2 years of age in the health area of Tama, Tahoua region (Niger).Front Nutr. 2023 Oct 23;10:1259706. doi: 10.3389/fnut.2023.1259706. eCollection 2023. Front Nutr. 2023. PMID: 37941771 Free PMC article.
-
Stunting as a Synonym of Social Disadvantage and Poor Parental Education.Int J Environ Res Public Health. 2021 Feb 2;18(3):1350. doi: 10.3390/ijerph18031350. Int J Environ Res Public Health. 2021. PMID: 33540885 Free PMC article.
References
-
- Keys A, Brozek J, Henschel A et al. (1950) The Biology of Starvation. Minneapolis: The University of Minnesota Press.
-
- Gomez F, Galvan RR, Cravioto J et al. (1955) Malnutrition in infancy and childhood, with special reference to Kwashiorkor. Adv Pediatr 7, 131–169. - PubMed
-
- Waterlow JC (1973) Note on the assessment and classification of protein-energy malnutrition in children. Lancet 302, 87–89. - PubMed
-
- Pelletier DL (1994) The relationship between child anthropometry and mortality in developing countries: implications for policy, programs and future research. J Nutr 124, 2047S–2081S. - PubMed
MeSH terms
LinkOut - more resources
Full Text Sources
Medical
Miscellaneous
