. 2020 Nov;6(11):mgen000429.
doi: 10.1099/mgen.0.000429.

Ancestral state reconstruction of metabolic pathways across pangenome ensembles

Affiliations

Ancestral state reconstruction of metabolic pathways across pangenome ensembles

Fotis E Psomopoulos et al. Microb Genom. 2020 Nov.

Abstract

As genome sequencing efforts are unveiling the genetic diversity of the biosphere with an unprecedented speed, there is a need to accurately describe the structural and functional properties of groups of extant species whose genomes have been sequenced, as well as their inferred ancestors, at any given taxonomic level of their phylogeny. Elaborate approaches for the reconstruction of ancestral states at the sequence level have been developed, subsequently augmented by methods based on gene content. While these approaches of sequence or gene-content reconstruction have been successfully deployed, there has been less progress on the explicit inference of functional properties of ancestral genomes, in terms of metabolic pathways and other cellular processes. Herein, we describe PathTrace, an efficient algorithm for parsimony-based reconstructions of the evolutionary history of individual metabolic pathways, pivotal representations of key functional modules of cellular function. The algorithm is implemented as a five-step process through which pathways are represented as fuzzy vectors, where each enzyme is associated with a taxonomic conservation value derived from the phylogenetic profile of its protein sequence. The method is evaluated with a selected benchmark set of pathways against collections of genome sequences from key data resources. By deploying a pangenome-driven approach for pathway sets, we demonstrate that the inferred patterns are largely insensitive to noise, as opposed to gene-content reconstruction methods. In addition, the resulting reconstructions are closely correlated with the evolutionary distance of the taxa under study, suggesting that a diligent selection of target pangenomes is essential for maintaining cohesiveness of the method and consistency of the inference, serving as an internal control for an arbitrary selection of queries. The PathTrace method is a first step towards the large-scale analysis of metabolic pathway evolution and our deeper understanding of functional relationships reflected in emerging pangenome collections.

Keywords: ancestral reconstruction; comparative genomics; metabolic pathways; parsimony method; phylogenetic profiling.


Conflict of interest statement

The authors declare that there are no conflicts of interest.

Figures

Fig. 1.
Fig. 1.
Overview of the main steps of PathTrace, including input, output and parameter set. The PathTrace method encompasses three main computational steps, surrounded by two steps for input/output. During the input phase, the algorithm extracts the protein sequences from the provided BioPAX files, through direct API calls to BioCyc. The next three steps include the construction of both the homology matrix and the corresponding fuzzy pathway profiles, leading to the reconstruction of the gene and pathway content, using GeneTrace. Finally, the produced output is bundled as a set of BioPAX-formated files, one for each node of the corresponding tree.
Fig. 2.
Fig. 2.
The homology matrix constructed for the 24 protein (enzyme) sequences involved in the Leucine biosynthesis pathway (six enzymes, rows 1–6) and the TCA Cycle (18 enzymes, rows 7–24) – separated by a purple horizontal line, across ten genomes, one from each of the 10 collections used (Table 1). Each row of the matrix corresponds to the profile of a single enzyme, whereas each column corresponds to the homology patterns for a single genome. It is evident that the quasi-random selection of the ten distinct genomes leads to a very heterogeneous form of the matrix, e.g. column 3 ( Streptococcus ) would generally mean absence of both pathways while column 8 ( Escherichia ) would correspondingly indicate presence. In this example, the contrast is too sharp, thus making the decision for pathway presence or absence highly uncertain. Scale from 0 to 9 (the number of homologues, arbitrary value) is shown on the right.
Fig. 3.
Fig. 3.
The homology matrix of the same set of 24 enzymes as in Fig. 2 (Leucine biosynthesis in rows 1–6 and TCA Cycle in rows 7–24), using the pangenome approach. In this instance, the columns correspond to the 46 strains present in the entire Escherichia/Shigella collection (Table 1). In this case, the crisp choice of a single pangenome of multiple, highly related strains, produces a homogeneous pattern (e.g. presence) of the two pathway examples. Using this strategy, the contrast can be low resulting in a biassed result, thus confounding the assessment of pathway presence or absence, regardless of the accuracy of the phylogeny for the pangenome. Scale from 0 to 6 (the number of homologues, arbitrary value) is shown on the right.
Fig. 4.
Fig. 4.
The homology matrix of the same set of 24 enzymes (Leucine biosynthesis in rows 1–6 and TCA Cycle in rows 7–24) – as in Figs 2 and 3, using several pangenomes as the target set. In this instance, the 249 columns correspond to the entire set of available genomes in the Bacteria EnsemblGenomes database (release 12), organized as a set of ten pangenomes (Table 1), outlined by the vertical purple lines. The mixture of representative genomes and pangenomes maintains the required heterogeneity of pathway information with an ‘optimum’ contrast, thus providing evidence of loss (i.e. absence) of reactions across entire pangenomes. This information is consequently used to construct the fuzzy-pathway profiles, even with a coarse-grained phylogeny. Scale from 0 to 9 (the number of homologues, arbitrary value) is shown on the right.
Fig. 5.
Fig. 5.
Comparison of three different representations of pathway status (presence/absence), using the Leucine biosynthesis pathway as a case study. The top panel (identical to rows 1–6 of Fig. 4 – including scale) shows the plain homology matrix of the six enzymes involved in the pathway (rows), across the entire complement of the 249 genomes in the Bacteria EnsemblGenomes database (release 12) organized in ten pangenomes (Table 1), outlined with the red vertical lines for all panels. The bottom panel corresponds to the metric produced by NeAT [39], using a greyscale representation of values ranging from white (presence) to black (absence). The middle panel corresponds to the PathTrace representation of fuzzy-pathway profiles, with the horizontal purple line indicating the threshold for presence (above threshold) or absence (below threshold). It is evident that, although all three representations capture the essence of pathway absence or presence across all genomes and pangenomes, the fuzzy-profile approach of PathTrace (middle panel) provides increased sensitivity in the subtle variations within a single pangenome while still capturing the robust classification between absence and presence. See text for details.
Fig. 6.
Fig. 6.
Comparison of three different representations of pathway status (presence/absence), using the TCA Cycle pathway as a case study. The top panel (identical to rows 7–24 of Fig. 4 – including scale) shows the homology matrix of the 18 enzymes involved in the pathway (rows), across the entire complement of the 249 genomes in the Bacteria EnsemblGenomes database (release 12) as organized in ten pangenomes (Table 1). The bottom panel corresponds to the metric produced by NeAT [39] (as in Fig. 5). The middle panel corresponds to the PathTrace representation (as in Fig. 5). Similarly to the Leucine biosynthesis example, subtle patterns of absence or presence across pangenomes can be seen – in this case, Streptococcus (block 3), Buchnera (block 7) and Borrelia (block 10). See text for details.
Fig. 7.
Fig. 7.
Representation of the entire homology matrix produced for the PathTrace case study. The 86 rows correspond to the enzymes that participate in the nine selected pathways, whereas the 182 columns correspond to the target genome sequences used, constructing an overall matrix of 15 652 cells. Scale from 0 to 14 (number of homologues, arbitrary value) is shown on the right.
Fig. 8.
Fig. 8.
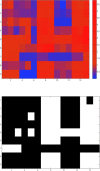
A visual representation of the fuzzy (a, top panel) and discrete (b, bottom panel) profiles of the nine pathways (rows, y-axis) listed in Table 2, across the 15 target genomes (columns, x-axis) listed in Table 3, produced by the equations in Step 3 of the PathTrace algorithm (see Methods). The colour scheme used in the fuzzy (real value) form of the profiles ranges from absence (blue) to presence (red), with intermediate values indicated partial states of the pathway. Through the application of parameter α (α=1.37), the binary profile provides a sharp overview of pathway absence or presence in the selected genomes, in a controlled manner.
Fig. 9.
Fig. 9.
Visual representation of the PathTrace output for the nine pathways listed in Table 2, across the taxonomic tree constructed by the ten selected genomes and including the five corresponding pangenomes (encoded as: ECOL-PNG, BUCH-PNG, BACI-PNG, STRE-PNG and PYRO-PNG, as in Table 3). In each case, the pangenome is included as a ‘virtual’ genome, which includes all genomes of the species, connected to the rest of the strains at the root of the corresponding subtree. The nine pathways are shown at the root node of the subtree using the following colour scheme for parsimony-based ancestral inference: red signifies the gain (genesis) of a pathway in the corresponding subtree, blue signifies the loss of a pathway in the subtree and black denotes presence of a pathway, only evident at the root of the entire tree (in this case ‘Lysine I’). Purple circles correspond to paragraphs in section (iii) of Results, to facilitate interpretation. To assist with interpretation, more details can be found in Table S2.
Fig. 10.
Fig. 10.
Comparison of PathTrace with the Mesquite suite using the selected nine pathways listed in Table 2. The colour scheme used by Mesquite ranges from red (denoting presence) to blue (denoting absence), with intermediate colours defining partial status (see also Fig. S1). The taxonomic tree utilized here is identical to the tree used in the PathTrace use case (Fig. 9), with a 90 degree rotation. Inspection of the nine panels reveals that both Mesquite and PathTrace establish similar evolutionary scenarios of the query pathways.

Similar articles

Cited by

References

    1. Omland KE. The assumptions and challenges of ancestral state reconstructions. Syst Biol. 1999;48:604–611. doi: 10.1080/106351599260175. - DOI
    1. Demuth JP, Hahn MW. The life and death of gene families. Bioessays. 2009;31:29–39. doi: 10.1002/bies.080085. - DOI - PubMed
    1. Gaucher EA, Thomson JM, Burgan MF, Benner SA. Inferring the palaeoenvironment of ancient bacteria on the basis of resurrected proteins. Nature. 2003;425:285–288. doi: 10.1038/nature01977. - DOI - PubMed
    1. Acevedo-Rocha CG, Fang G, Schmidt M, Ussery DW, Danchin A. From essential to persistent genes: a functional approach to constructing synthetic life. Trends Genet. 2013;29:273–279. doi: 10.1016/j.tig.2012.11.001. - DOI - PMC - PubMed
    1. Kunin V, Ouzounis CA. The balance of driving forces during genome evolution in prokaryotes. Genome Res. 2003;13:1589–1594. doi: 10.1101/gr.1092603. - DOI - PMC - PubMed

Publication types

LinkOut - more resources