Review
. 2020;9(3):217-229.
doi: 10.3233/JHD-200394.

The Neurodevelopmental Hypothesis of Huntington's Disease

Affiliations
Review

The Neurodevelopmental Hypothesis of Huntington's Disease

Ellen van der Plas et al. J Huntingtons Dis. 2020.

Abstract

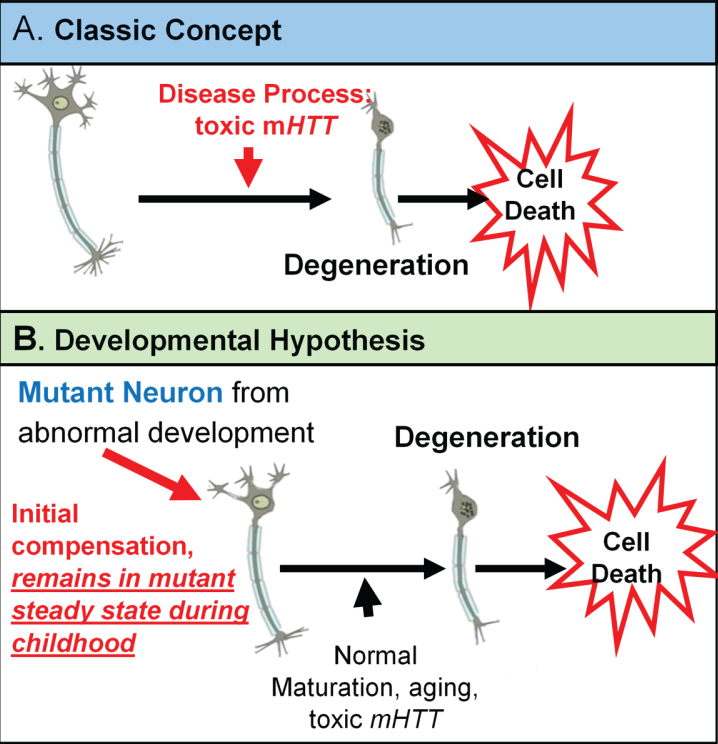
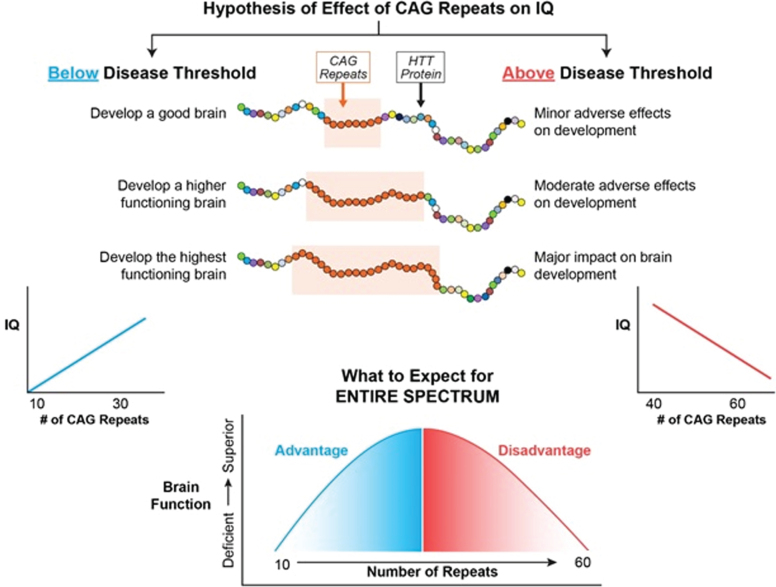
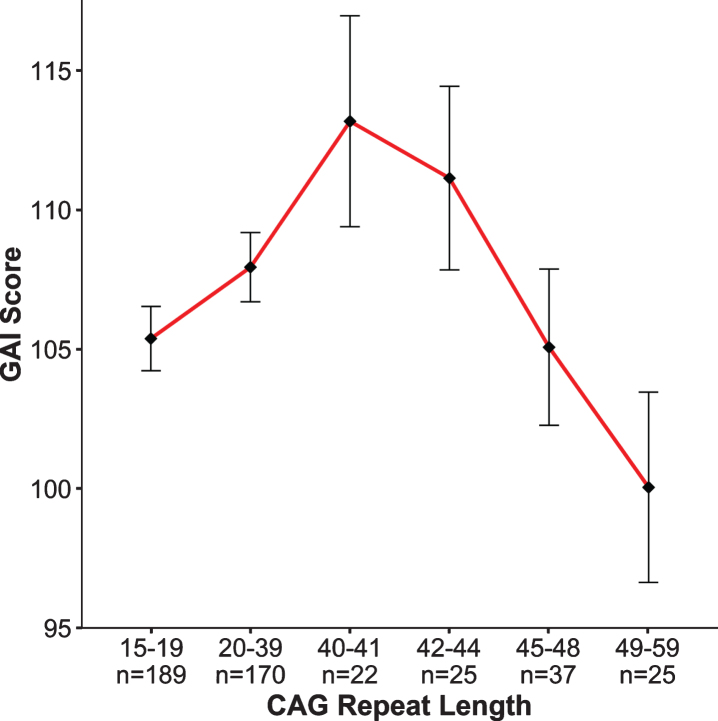
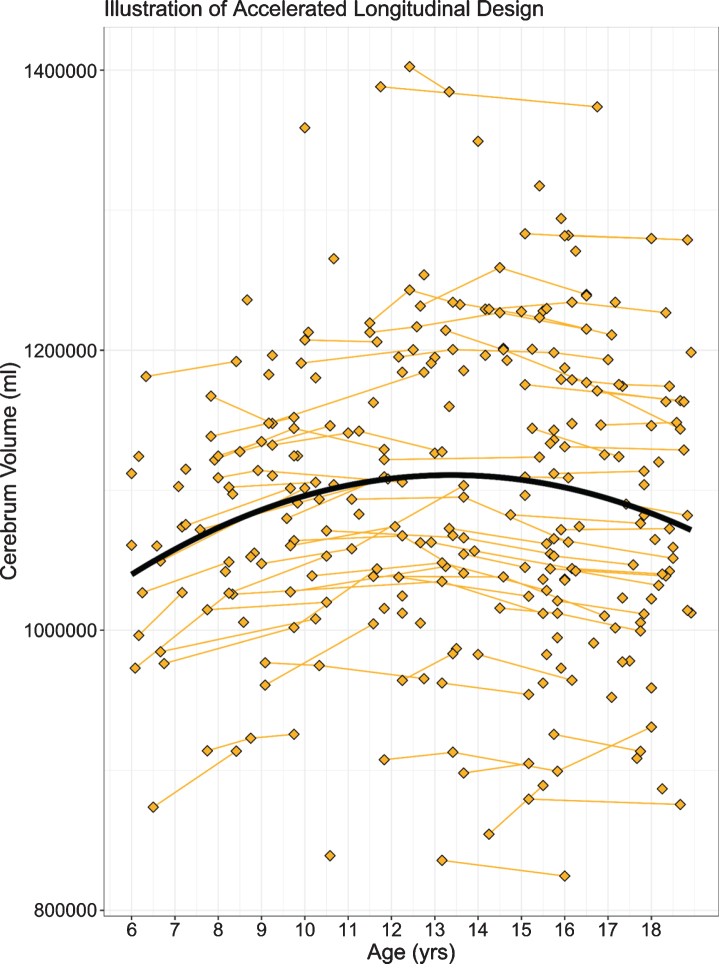
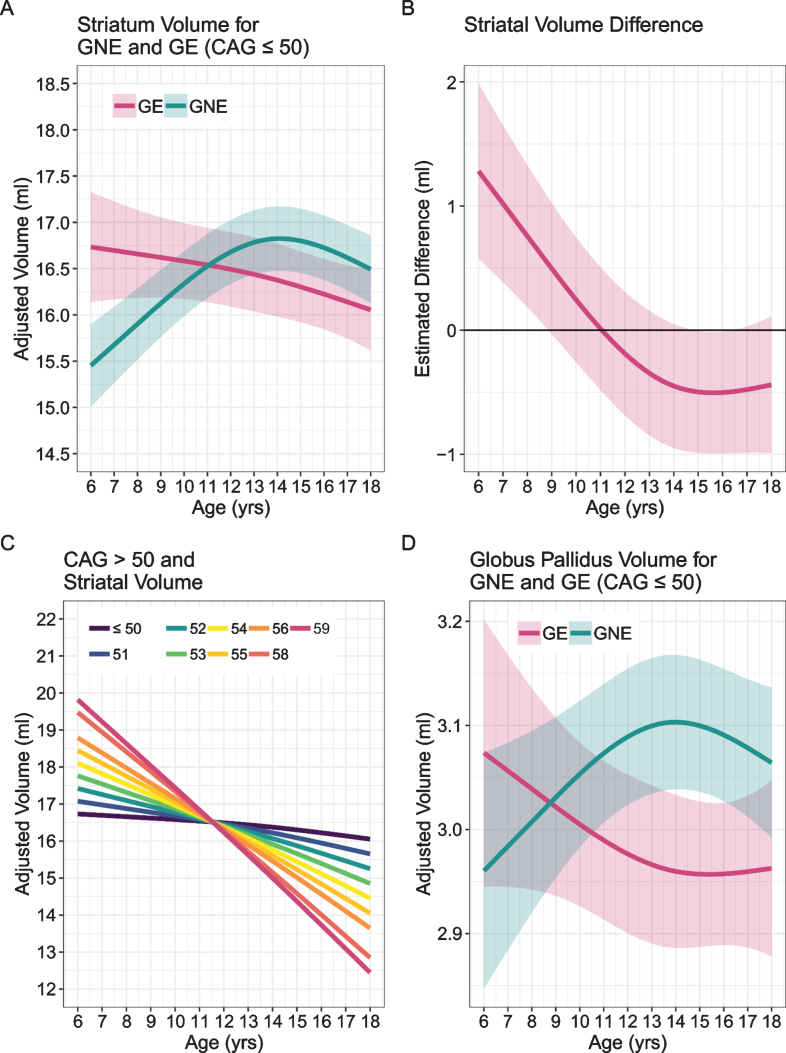
The current dogma of HD pathoetiology posits it is a degenerative disease affecting primarily the striatum, caused by a gain of function (toxicity) of the mutant mHTT that kills neurons. However, a growing body of evidence supports an alternative theory in which loss of function may also influence the pathology.This theory is predicated on the notion that HTT is known to be a vital gene for brain development. mHTT is expressed throughout life and could conceivably have deleterious effects on brain development. The end event in the disease is, of course, neurodegeneration; however the process by which that occurs may be rooted in the pathophysiology of aberrant development.To date, there have been multiple studies evaluating molecular and cellular mechanisms of abnormal development in HD, as well as studies investigating abnormal brain development in HD animal models. However, direct study of how mHTT could affect neurodevelopment in humans has not been approached until recent years. The current review will focus on the most recent findings of a unique study of children at-risk for HD, the Kids-HD study. This study evaluates brain structure and function in children ages 6-18 years old who are at risk for HD (have a parent or grand-parent with HD).

Keywords: Brain development; Huntington’s disease; MRI; children at risk for HD.


Conflict of interest statement

There are no conflicts of interest for any of the authors.

Figures

Fig. 1
Fig. 1
Theories of HD Etiology.
Fig. 2
Fig. 2
The left side of the figure models how CAG repeats might effect IQ below disease threshold where the right side of the figure models how CAG repeats might effect IQ above disease threshold.
Fig. 3
Fig. 3
General Abilities Index (GAI). Graph above shows results of the non-linear model (β= –20.2, p = 0.006) where the x-axis is represented by groups of subjects binned by CAG repeat length of the longest allele, and the y-axis is the mean GAI (bars are standard error) for each group. To obtain mean GAI, ANCOVA was performed between groups, controlling for age, sex, and parental SES.
Fig. 4
Fig. 4
Age is shown on the x-axis and cerebrum volume (gray and white matter combined) is shown on the y-axis. Single diamonds represent a single observation in an individual, while connected diamonds show repeated observations within the same individual. The thick, black line illustrates the growth curve across age based on a combination of cross-sectional and longitudinal components. To preserve gene status confidentiality, the figure illustrates the combined gene-expanded and gene-nonexpanded groups.
Fig. 5
Fig. 5
A) Mean estimated age-dependent change of striatal volume in the GE (red) and GNE (green) groups. Note that the GE curve is based on individuals with CAG < 50, and that results were averaged across sex. B) Striatal volume diference (y-axis) between GE group (red) and GNE group (horizontal black line) across age (x-axis), along with 95% confidence limits of the difference scores. C) The impact of CAG repeat length on striatal volume (y-axis) across age (x-axis). CAG repeats <50 did not affect striatal growth curves (horizontal line labeled <50). For repeats >50, additional repeats were associated with accelerated striatal decline in adolescence, and possibly with greater hypertrophy before age 10. D) Mean estimated age-dependent change of the globus pallidus.
Fig. 6
Fig. 6
The portion of the figure in the green box represents the direct pathway (promotes movement) and the section in the blue box represents the indirect pathway (inhibits movement). In Huntington’s disease, it is the indirect pathway that degenerates first, leading to lack of inhibition and involuntary movements (chorea). The cerebellum is integrated into striatal circuity through the indirect pathway. Thus the cerebellum could compensate for a faulty indirect pathway, restoring balance and preventing the development of involuntary movements. Red arrows indicate where the cerebellum is integrated into the indirect pathway. GPe, globus pallidus externa; GPi, globus pallidus interna; STN, subthalamic nucleus. Figure adapted from Bostan et al. [48].
Fig. 7
Fig. 7
Model of cerebellar compensation of the abnormally developed striatum in HD. The compensation allows for normal motor function and maintains the striatum in mutant steady state.
Fig. 8
Fig. 8
A–C) Predicted values from a linear mixed effects regression model of the functional connectivity (R2) between the striatal–cerebellar regions of interest (dependent variables) over time between groups (age×group interaction term). The model controlled for age, sex, and scanner, and included a sex×group interaction term and a random effect term per the participant’s slope of age, and a random effect term per family to account for participants who were siblings. aCB, anterior lobe of the cerebellum; dPU, dorsocaudal putamen; GE, gene-expanded; GNE, gene nonexpanded; GPE, globus pallidus externus; PN, pontine nucleus; STN, subthalamic nucleus.
Fig. 9
Fig. 9
This figure represents the predicted values from a linear mixed effects regression model of the functional connectivity (R2) between the dentate nucleus and ventrolateral nucleus of the thalamus (dependent variable) over time between groups (age×group interaction term). The model controlled for age, sex, and scanner, and included a sex×group interaction term and a random effect term per participant’s slope of age, and a random effect term per family to account for participants who were siblings. GE, gene expanded; GNE, gene nonexpanded.
Fig. 10
Fig. 10
CAG effect over time in functional correlations between anterior lobe of the cerebellum and subthalamic nucleus. CAG, cytosine-adenine-guanine.
Fig. 11
Fig. 11
Model of proposed mechanism by which changes in Poly Q (glutamine) leads to changes in protein conformation and subsequent functional changes.

References

    1. Leavitt BR, Tabrizi SJ. Antisense oligonucleotides for neurodegeneration. Science. 2020;367(6485):1428–9. - PubMed
    1. Tabrizi SJ, Leavitt BR, Landwehrmeyer GB, Wild EJ, Saft C, Barker RA, et al. Targeting huntingtin expression in patients with Huntington’s disease. N Engl J Med. 2019;380(24):2307–16. - PubMed
    1. Mehler MF, Gokhan S. Mechanisms underlying neural cell death in neurodegenerative diseases: Alterations of a developmentally-mediated cellular rheostat. Trends Neurosci. 2000;23(12):599–605. - PubMed
    1. Gallardo-Orihuela A, Hervas-Corpion I, Hierro-Bujalance C, Sanchez-Sotano D, Jimenez-Gomez G, Mora-Lopez F, et al. Transcriptional correlates of the pathological phenotype in a Huntington’s disease mouse model. Sci Rep. 2019;9(1):18696. - PMC - PubMed
    1. Conforti P, Besusso D, Bocchi VD, Faedo A, Cesana E, Rossetti G, et al. Faulty neuronal determination and cell polarization are reverted by modulating HD early phenotypes. Proc Natl Acad Sci U S A. 2018;115(4):E762–E771. - PMC - PubMed

Publication types

MeSH terms