

Perturbation of in vivo Neural Activity Following α-Synuclein Seeding in the Olfactory Bulb
- PMID: 32925105
- PMCID: PMC8018612
- DOI: 10.3233/JPD-202241
Perturbation of in vivo Neural Activity Following α-Synuclein Seeding in the Olfactory Bulb
Abstract
Background: Parkinson's disease (PD) neuropathology is characterized by intraneuronal protein aggregates composed of misfolded α-Synuclein (α-Syn), as well as degeneration of substantia nigra dopamine neurons. Deficits in olfactory perception and aggregation of α-Syn in the olfactory bulb (OB) are observed during early stages of PD, and have been associated with the PD prodrome, before onset of the classic motor deficits. α-Syn fibrils injected into the OB of mice cause progressive propagation of α-Syn pathology throughout the olfactory system and are coupled to olfactory perceptual deficits.
Objective: We hypothesized that accumulation of pathogenic α-Syn in the OB impairs neural activity in the olfactory system.
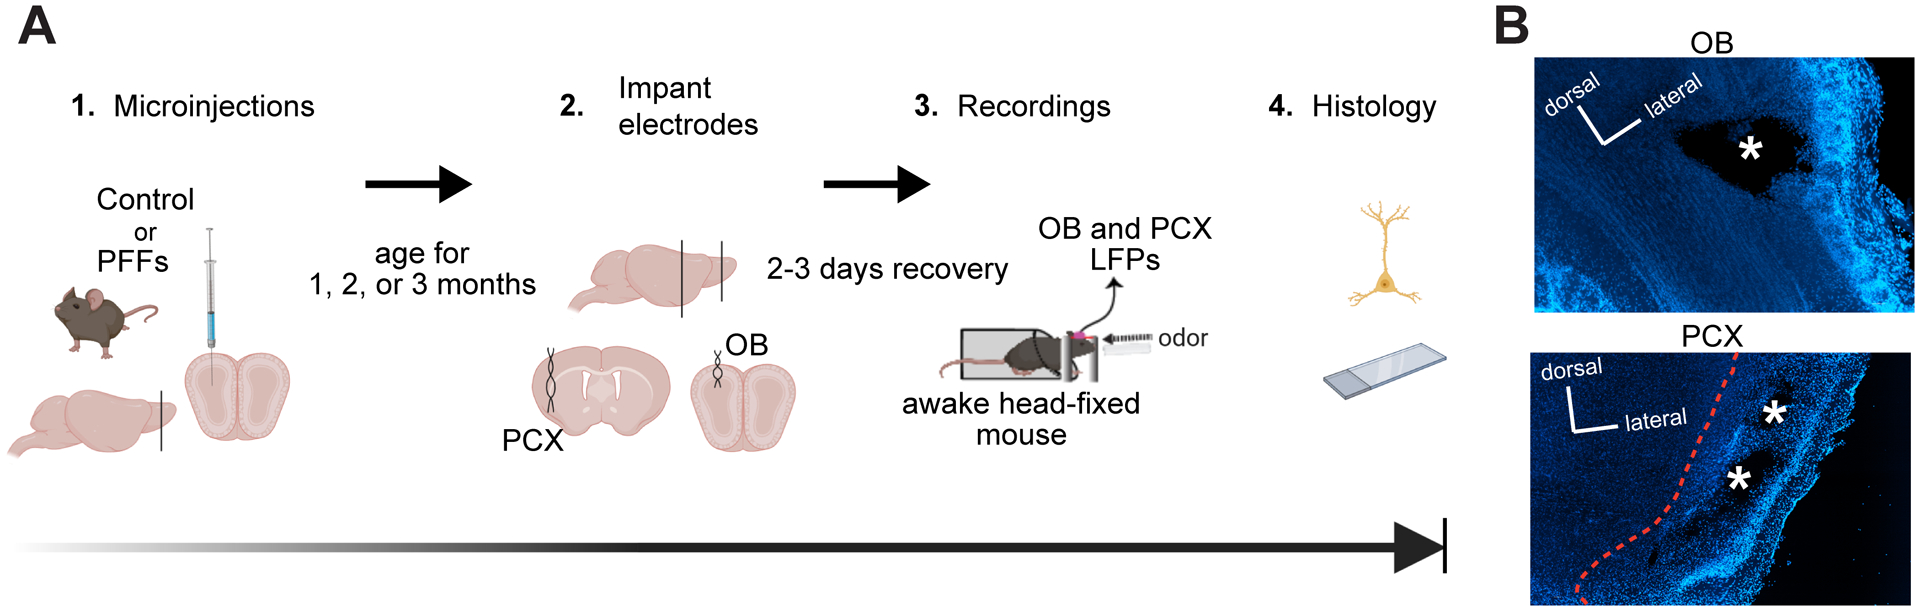
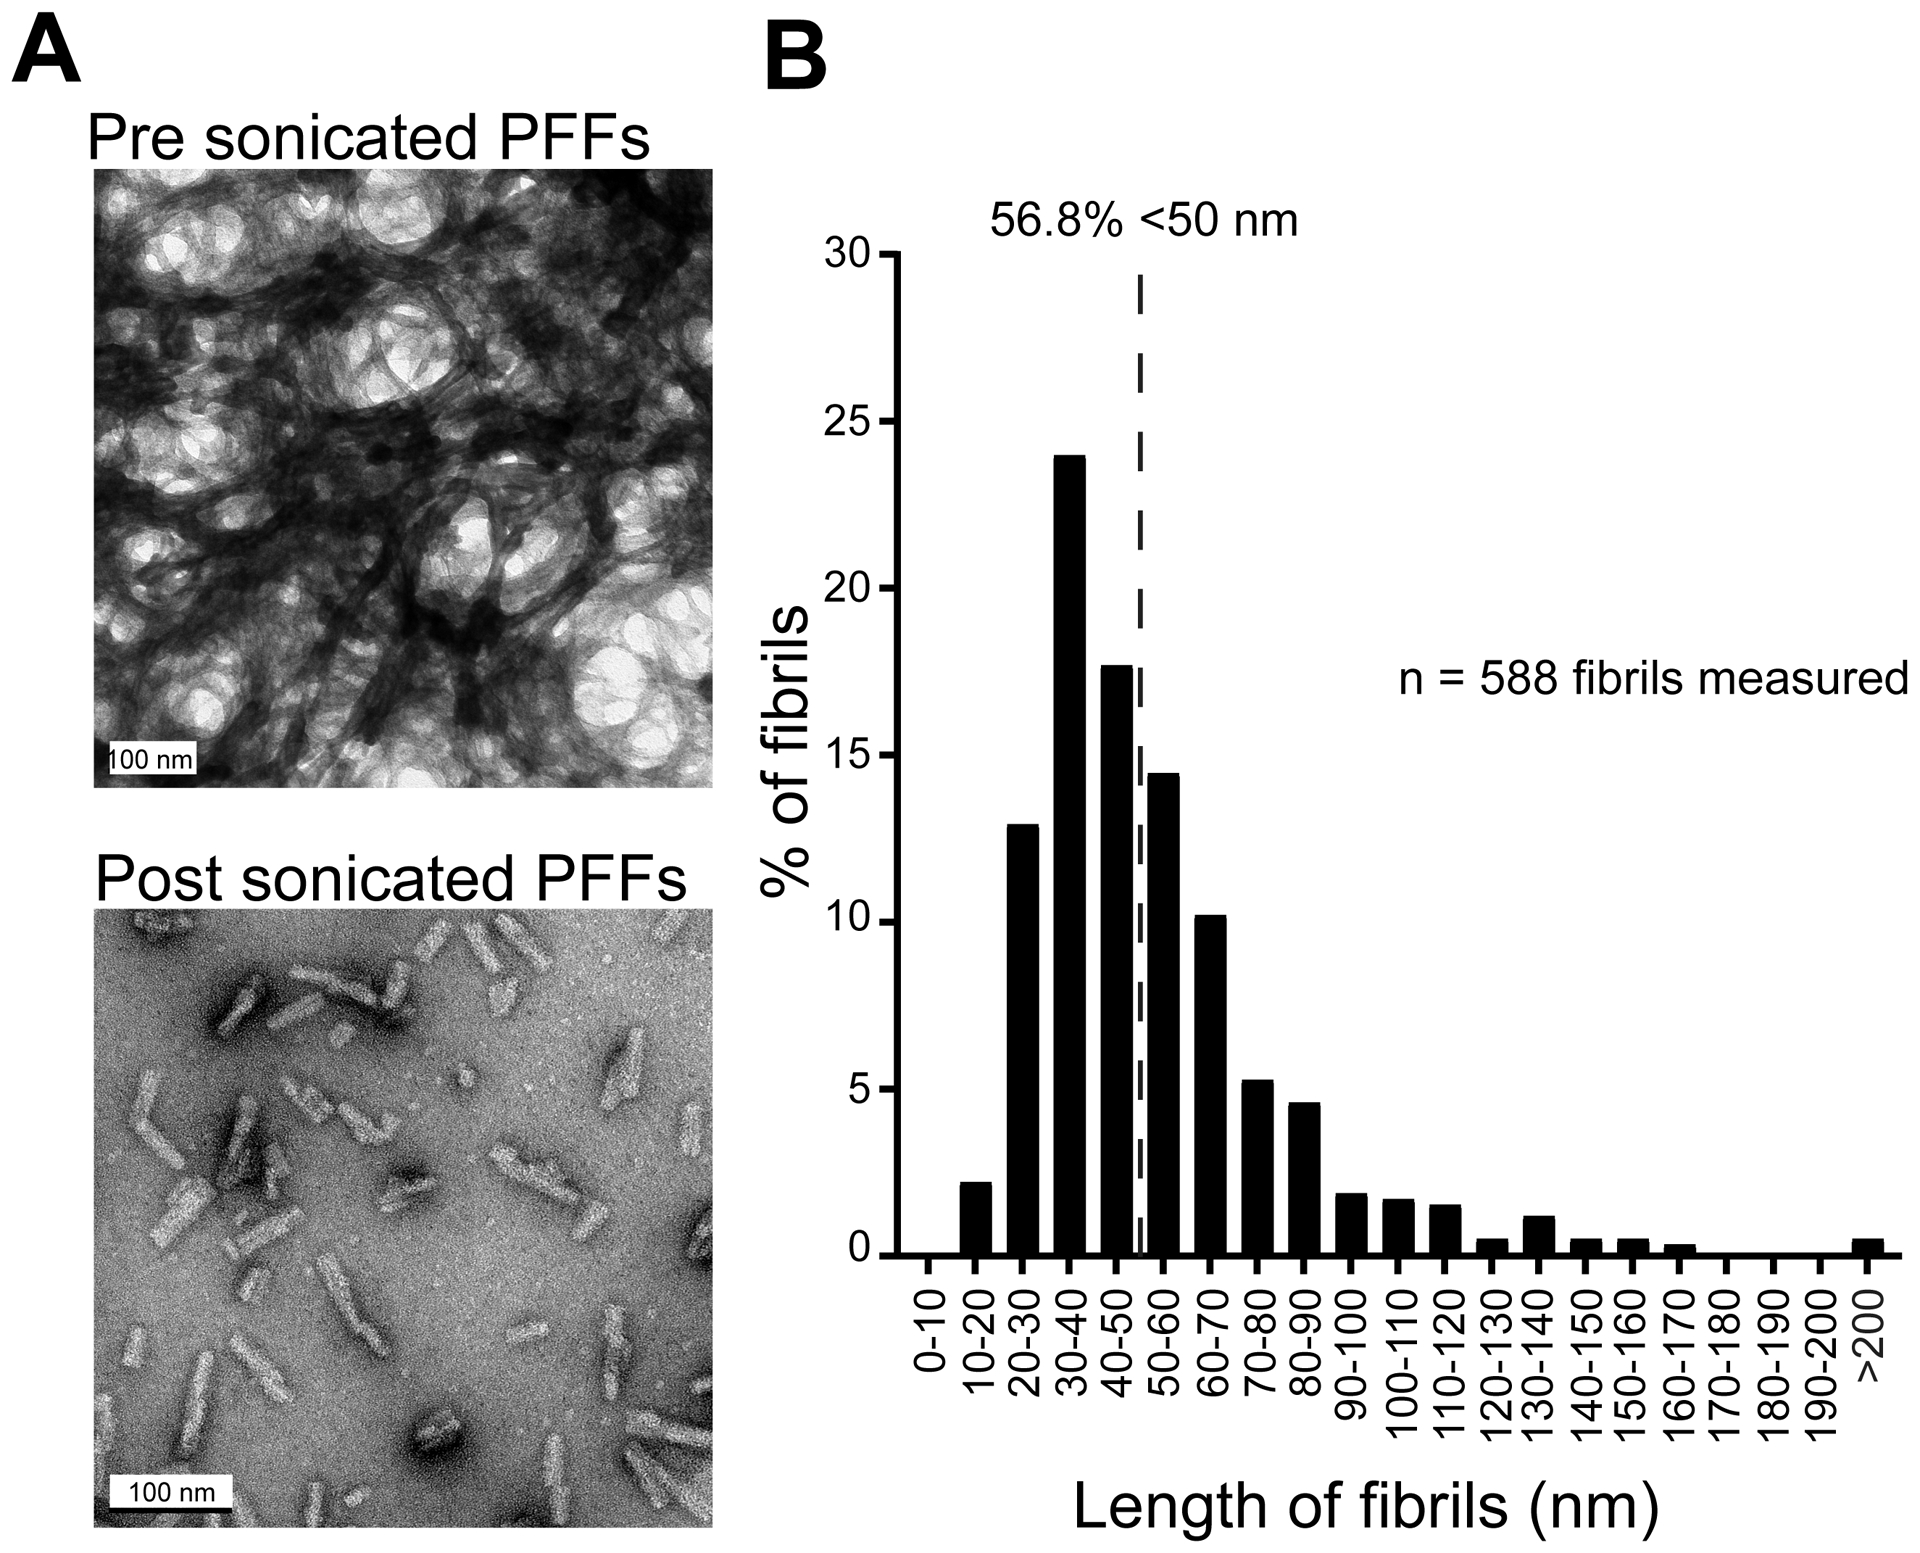
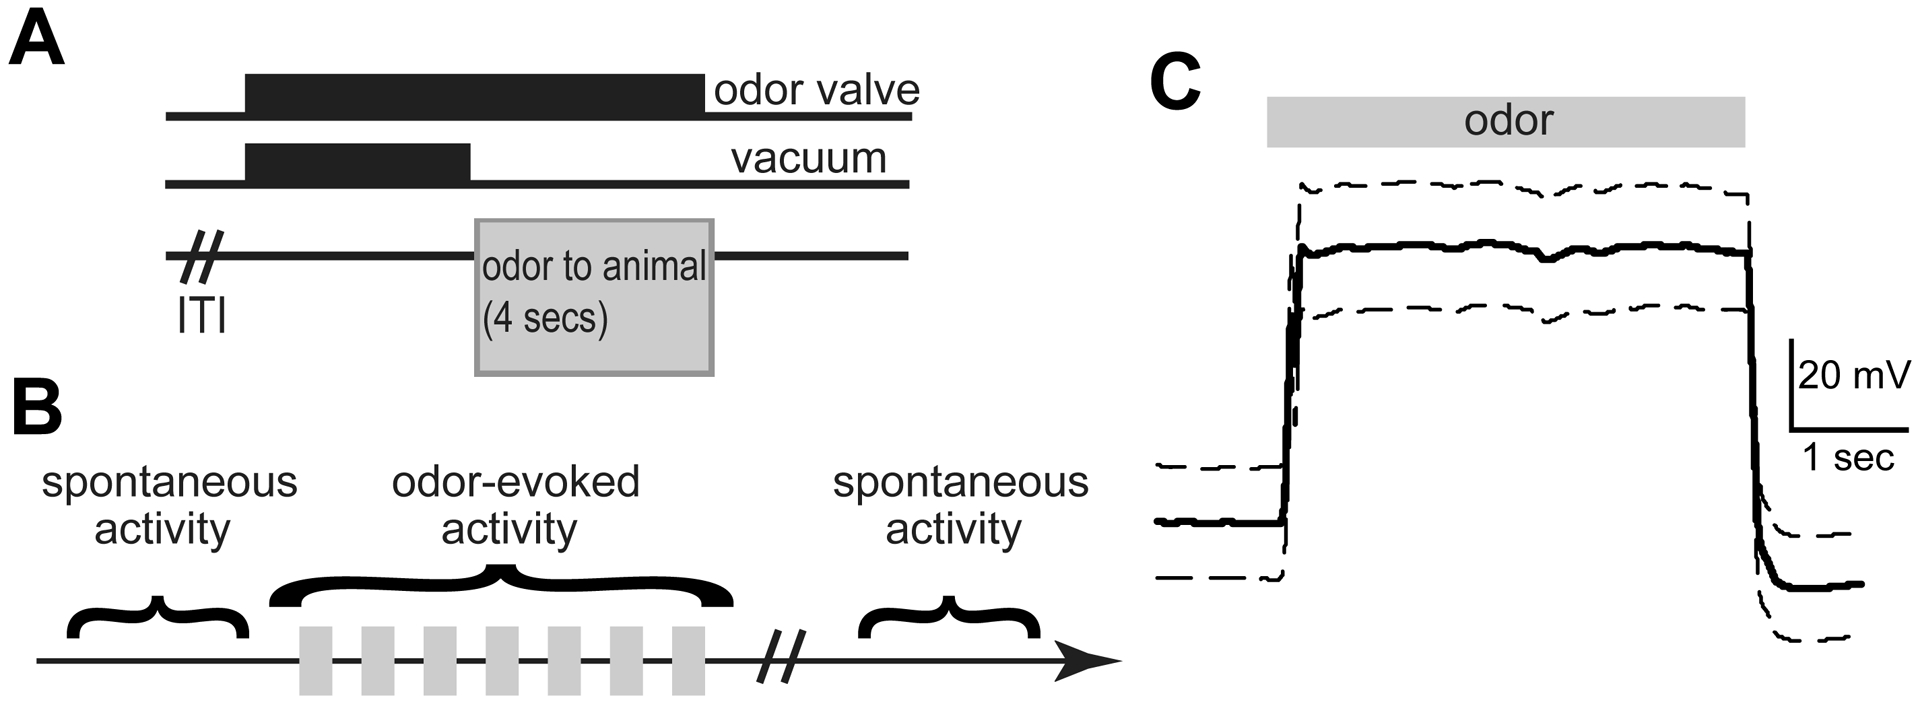
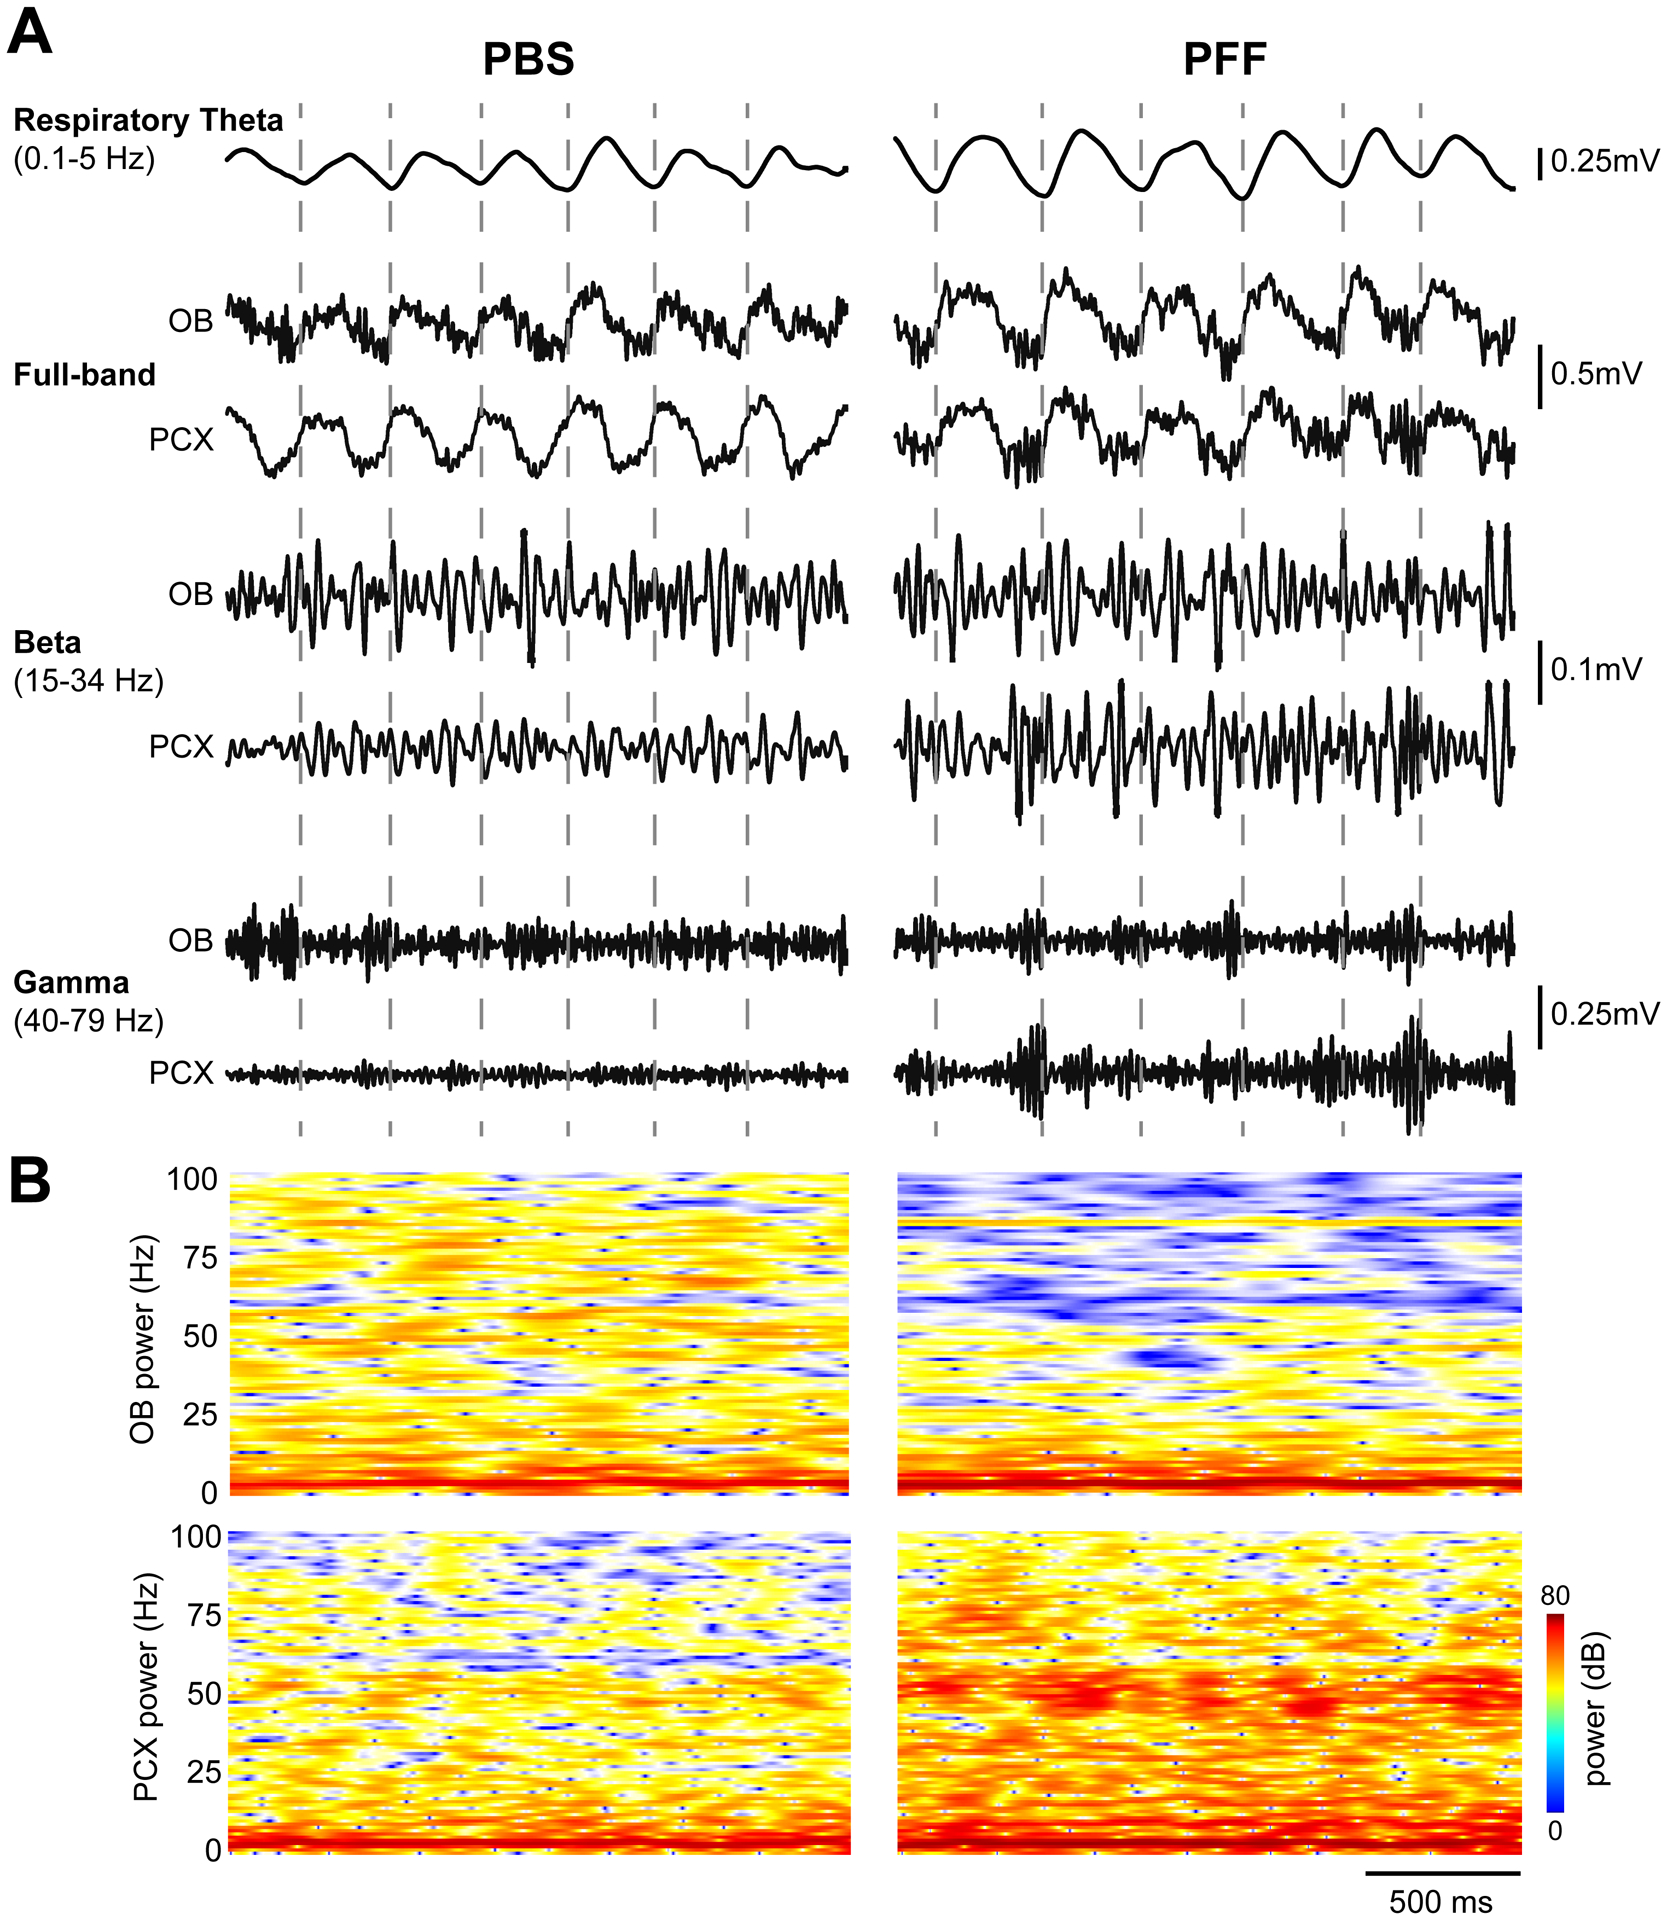
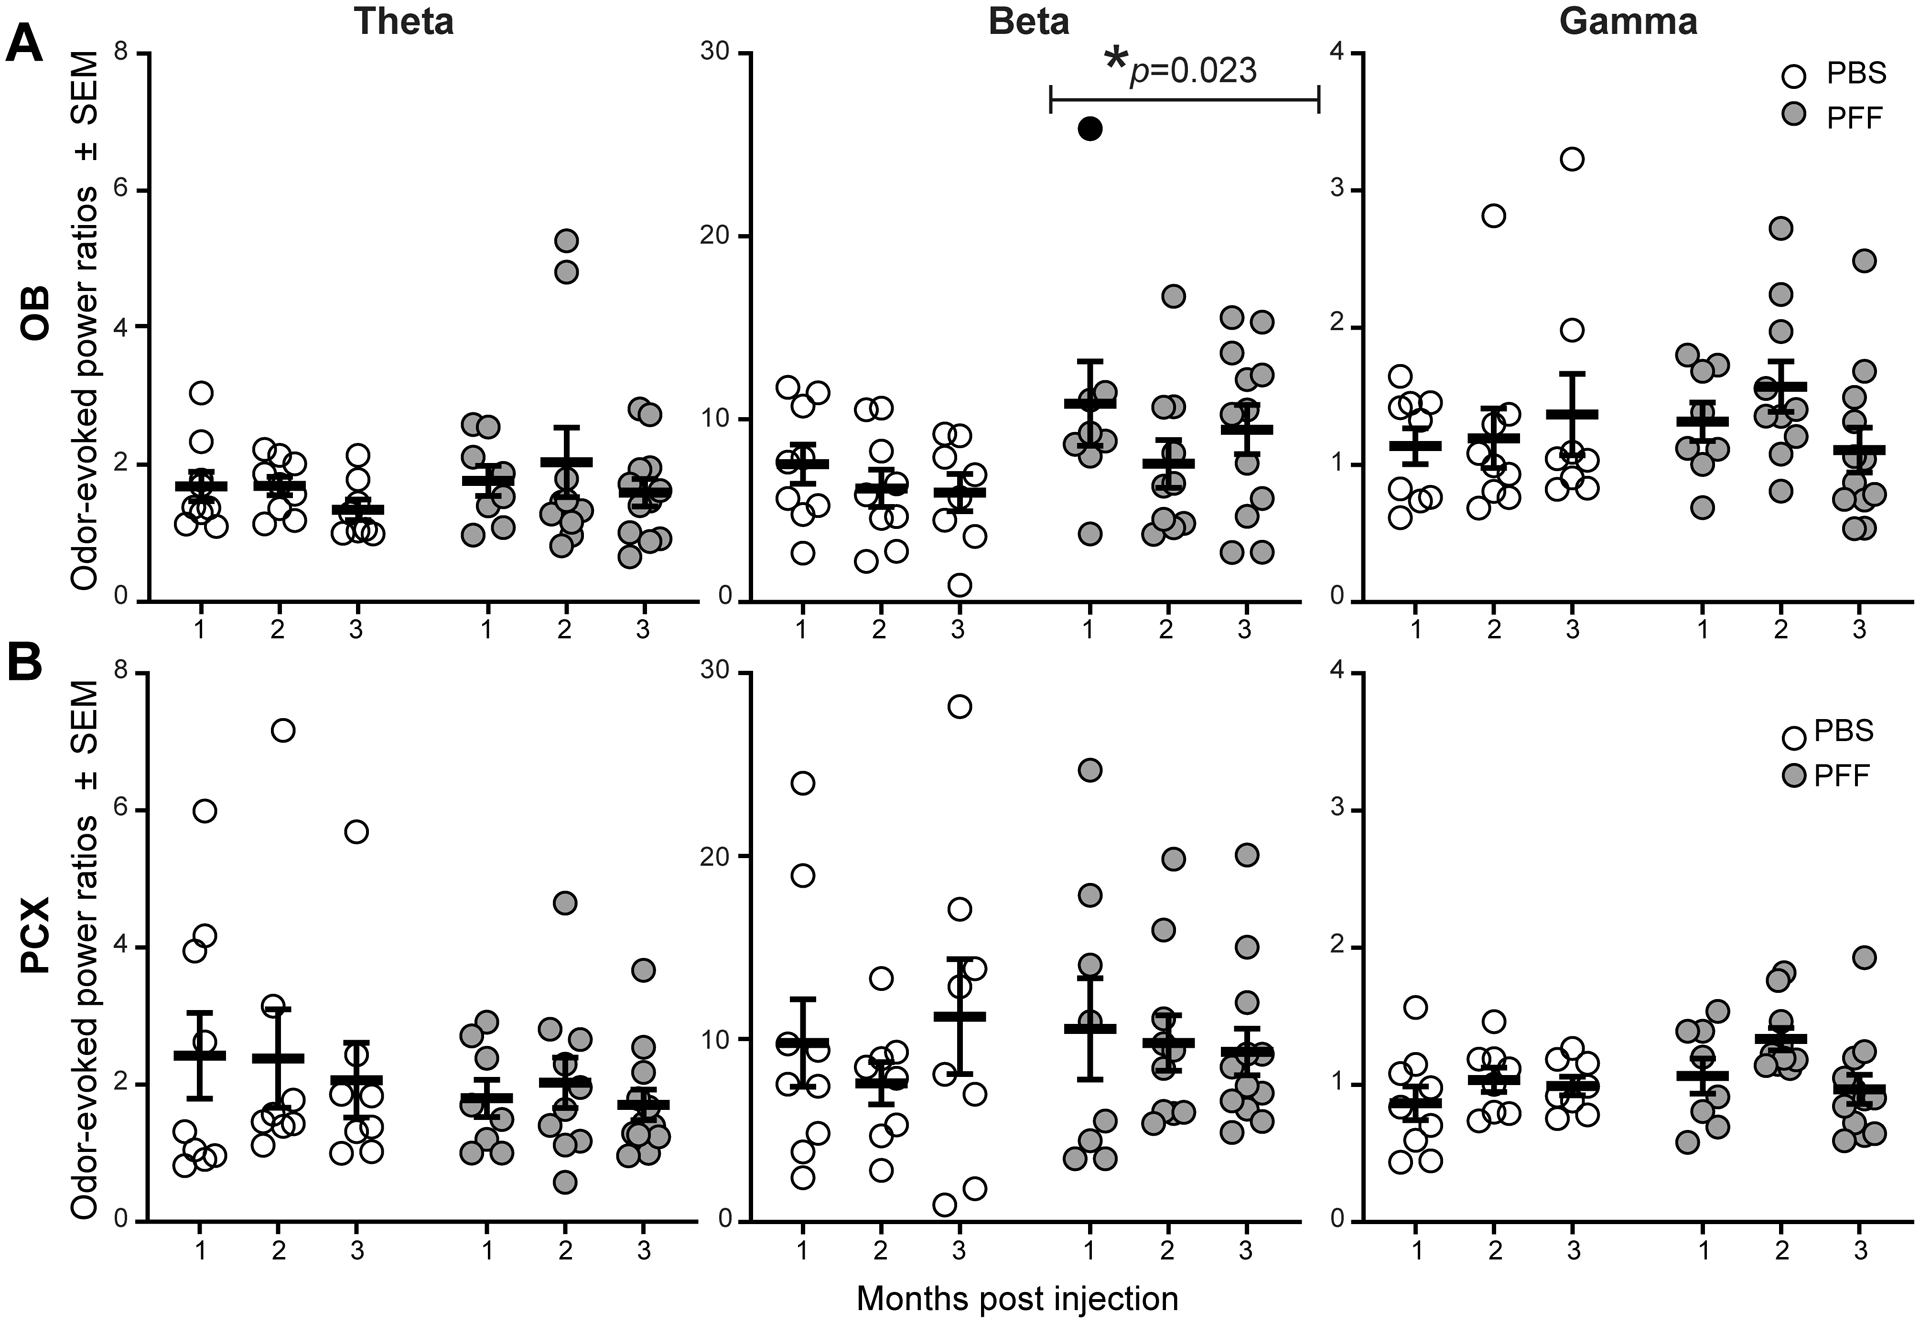
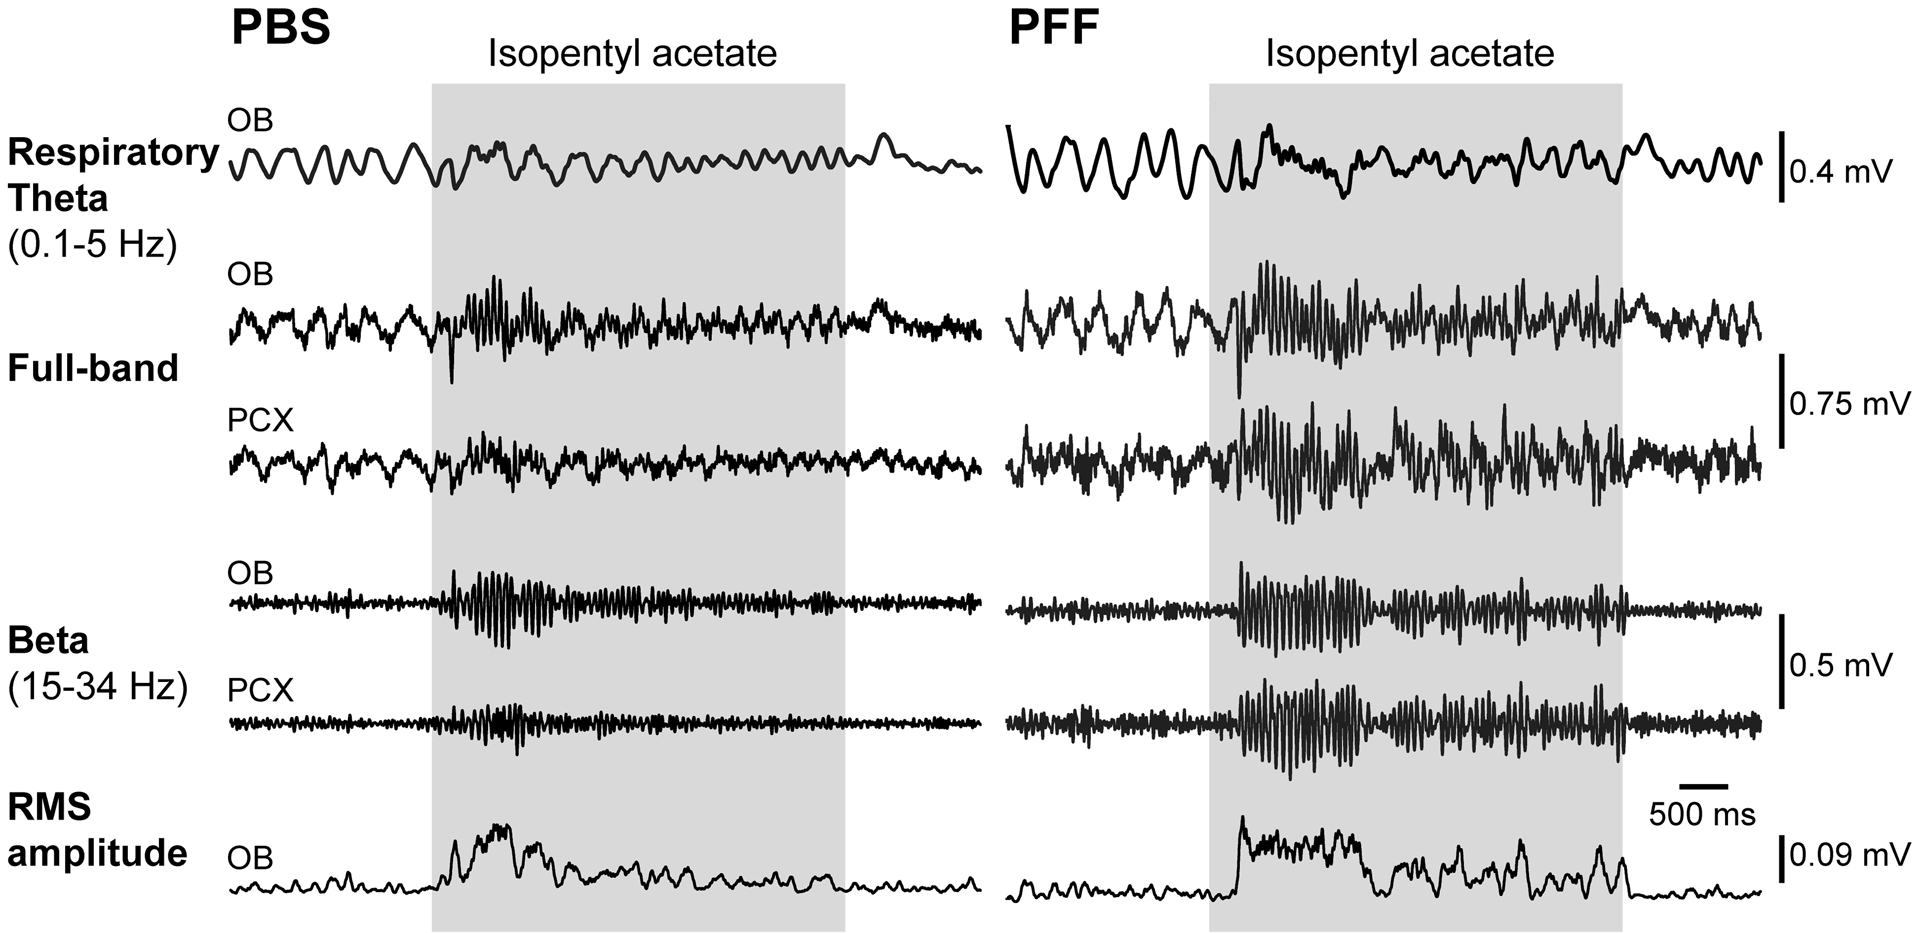
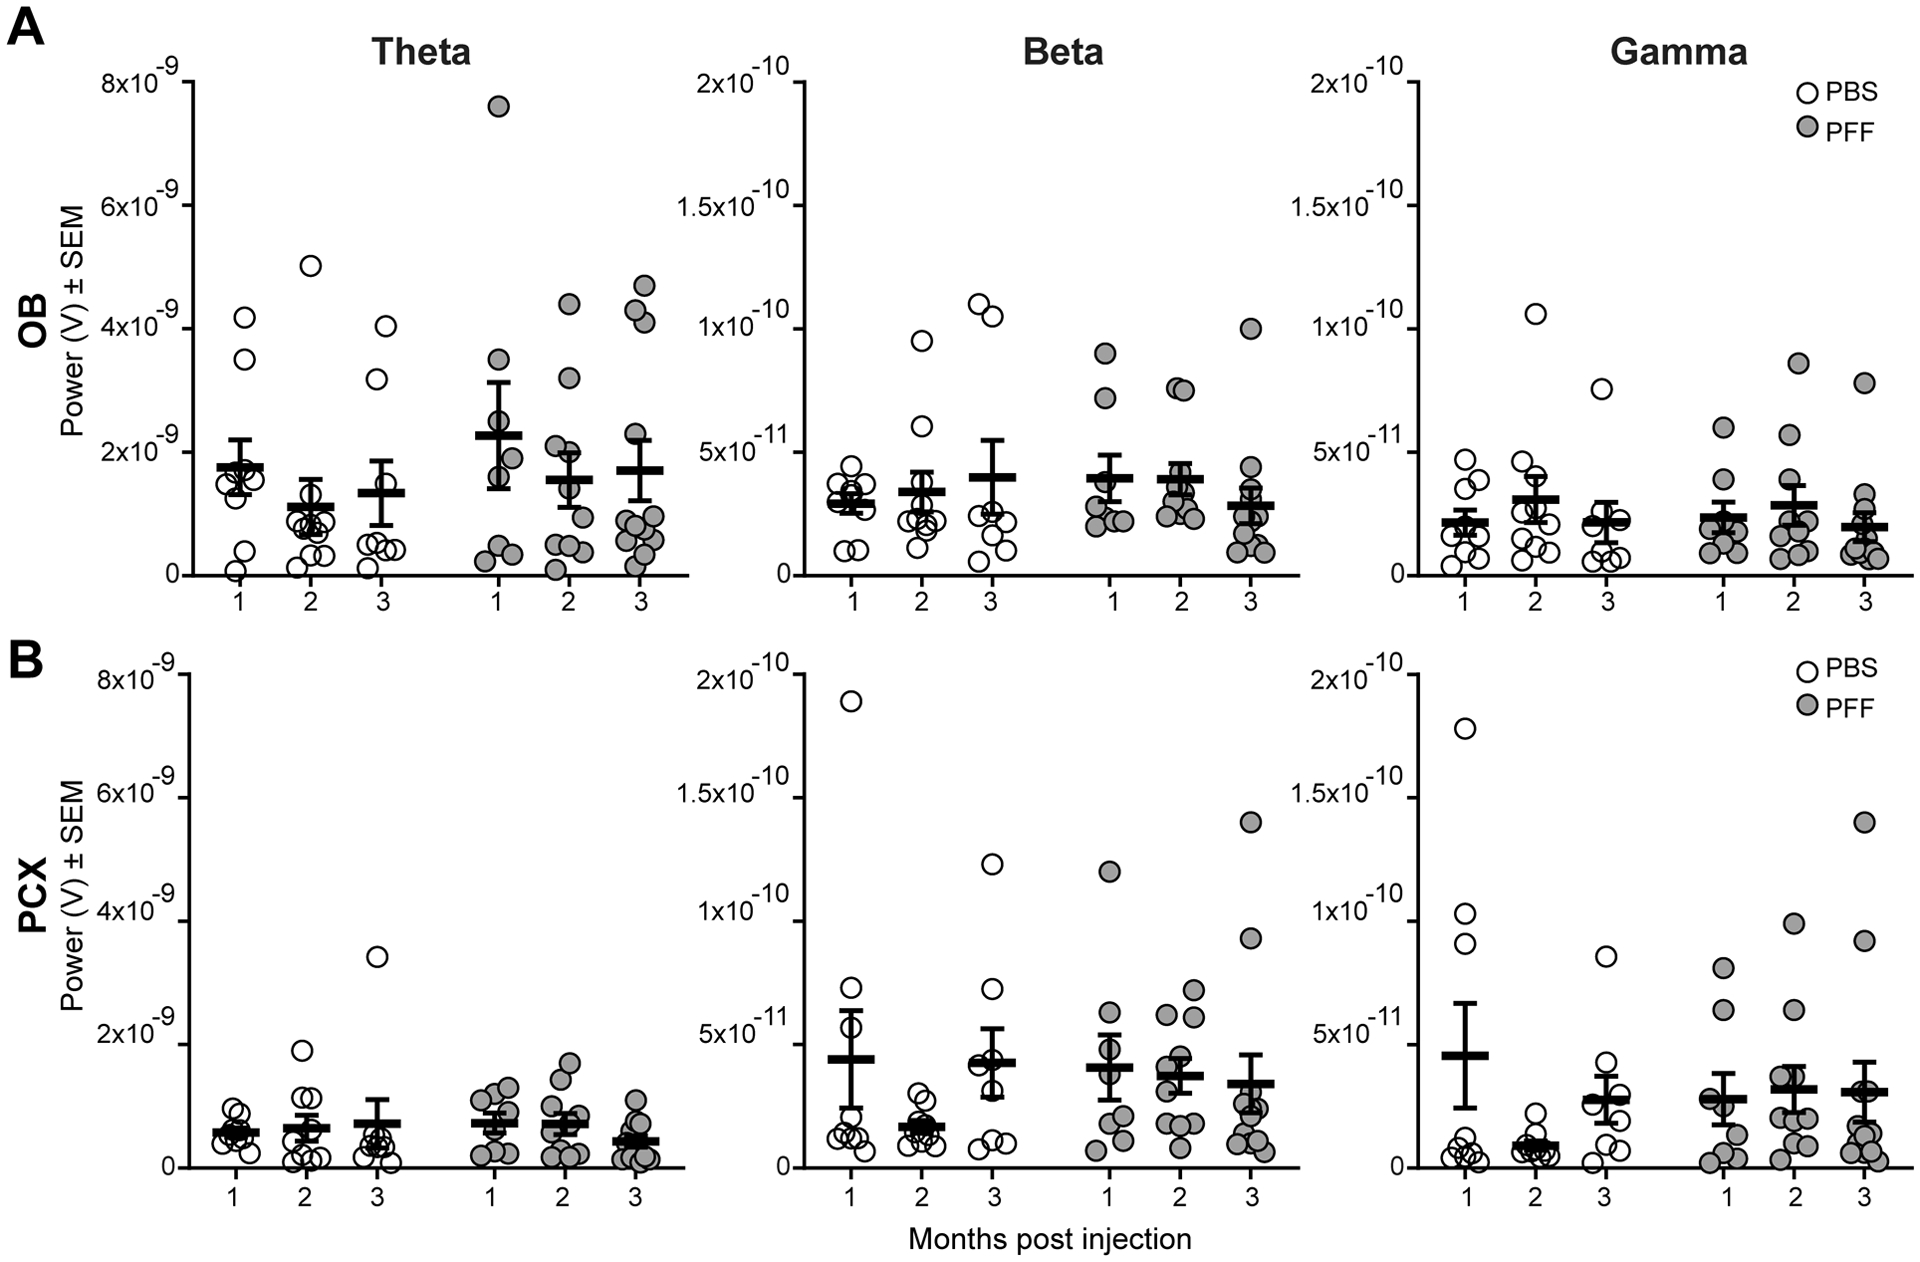
Methods: To address this, we monitored spontaneous and odor-evoked local field potential dynamics in awake wild type mice simultaneously in the OB and piriform cortex (PCX) one, two, and three months following injection of pathogenic preformed α-Syn fibrils in the OB.
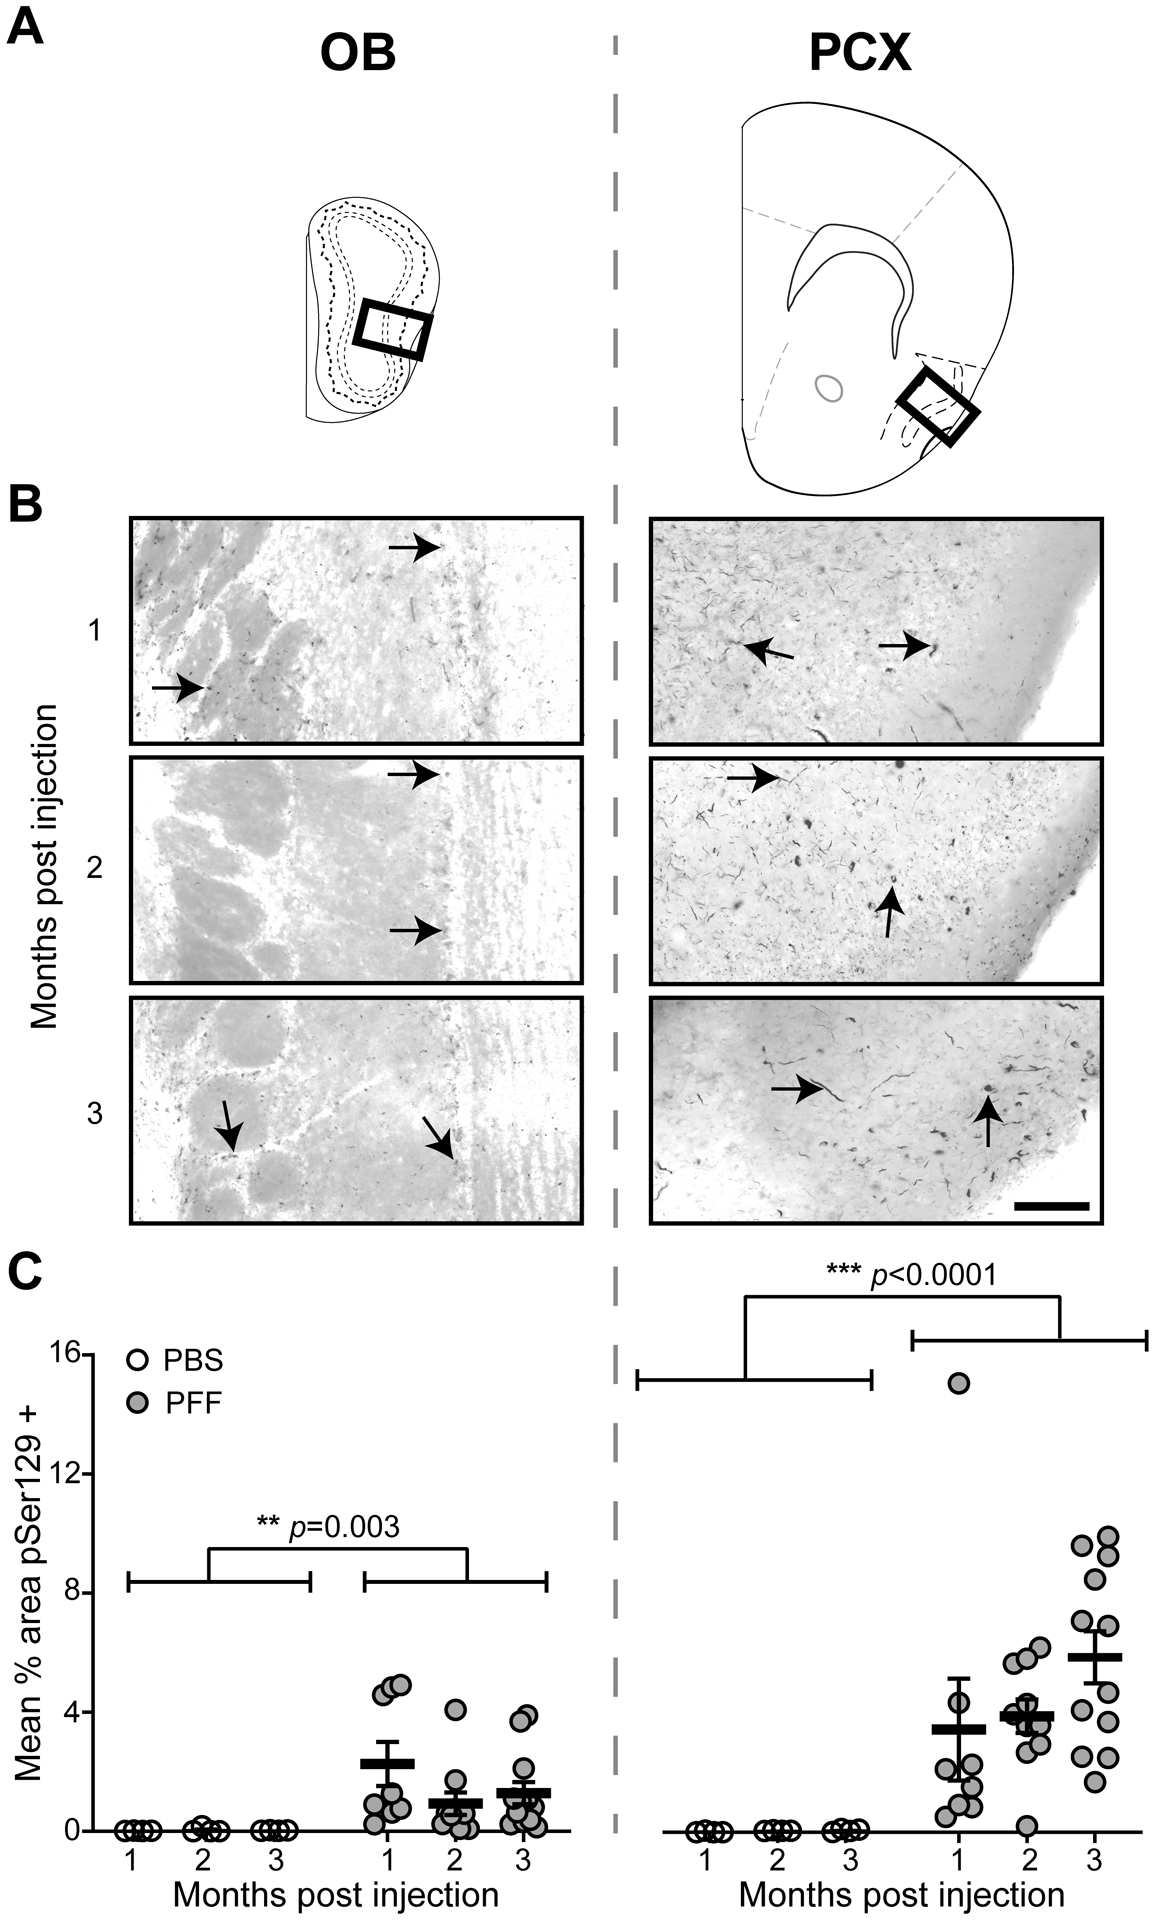
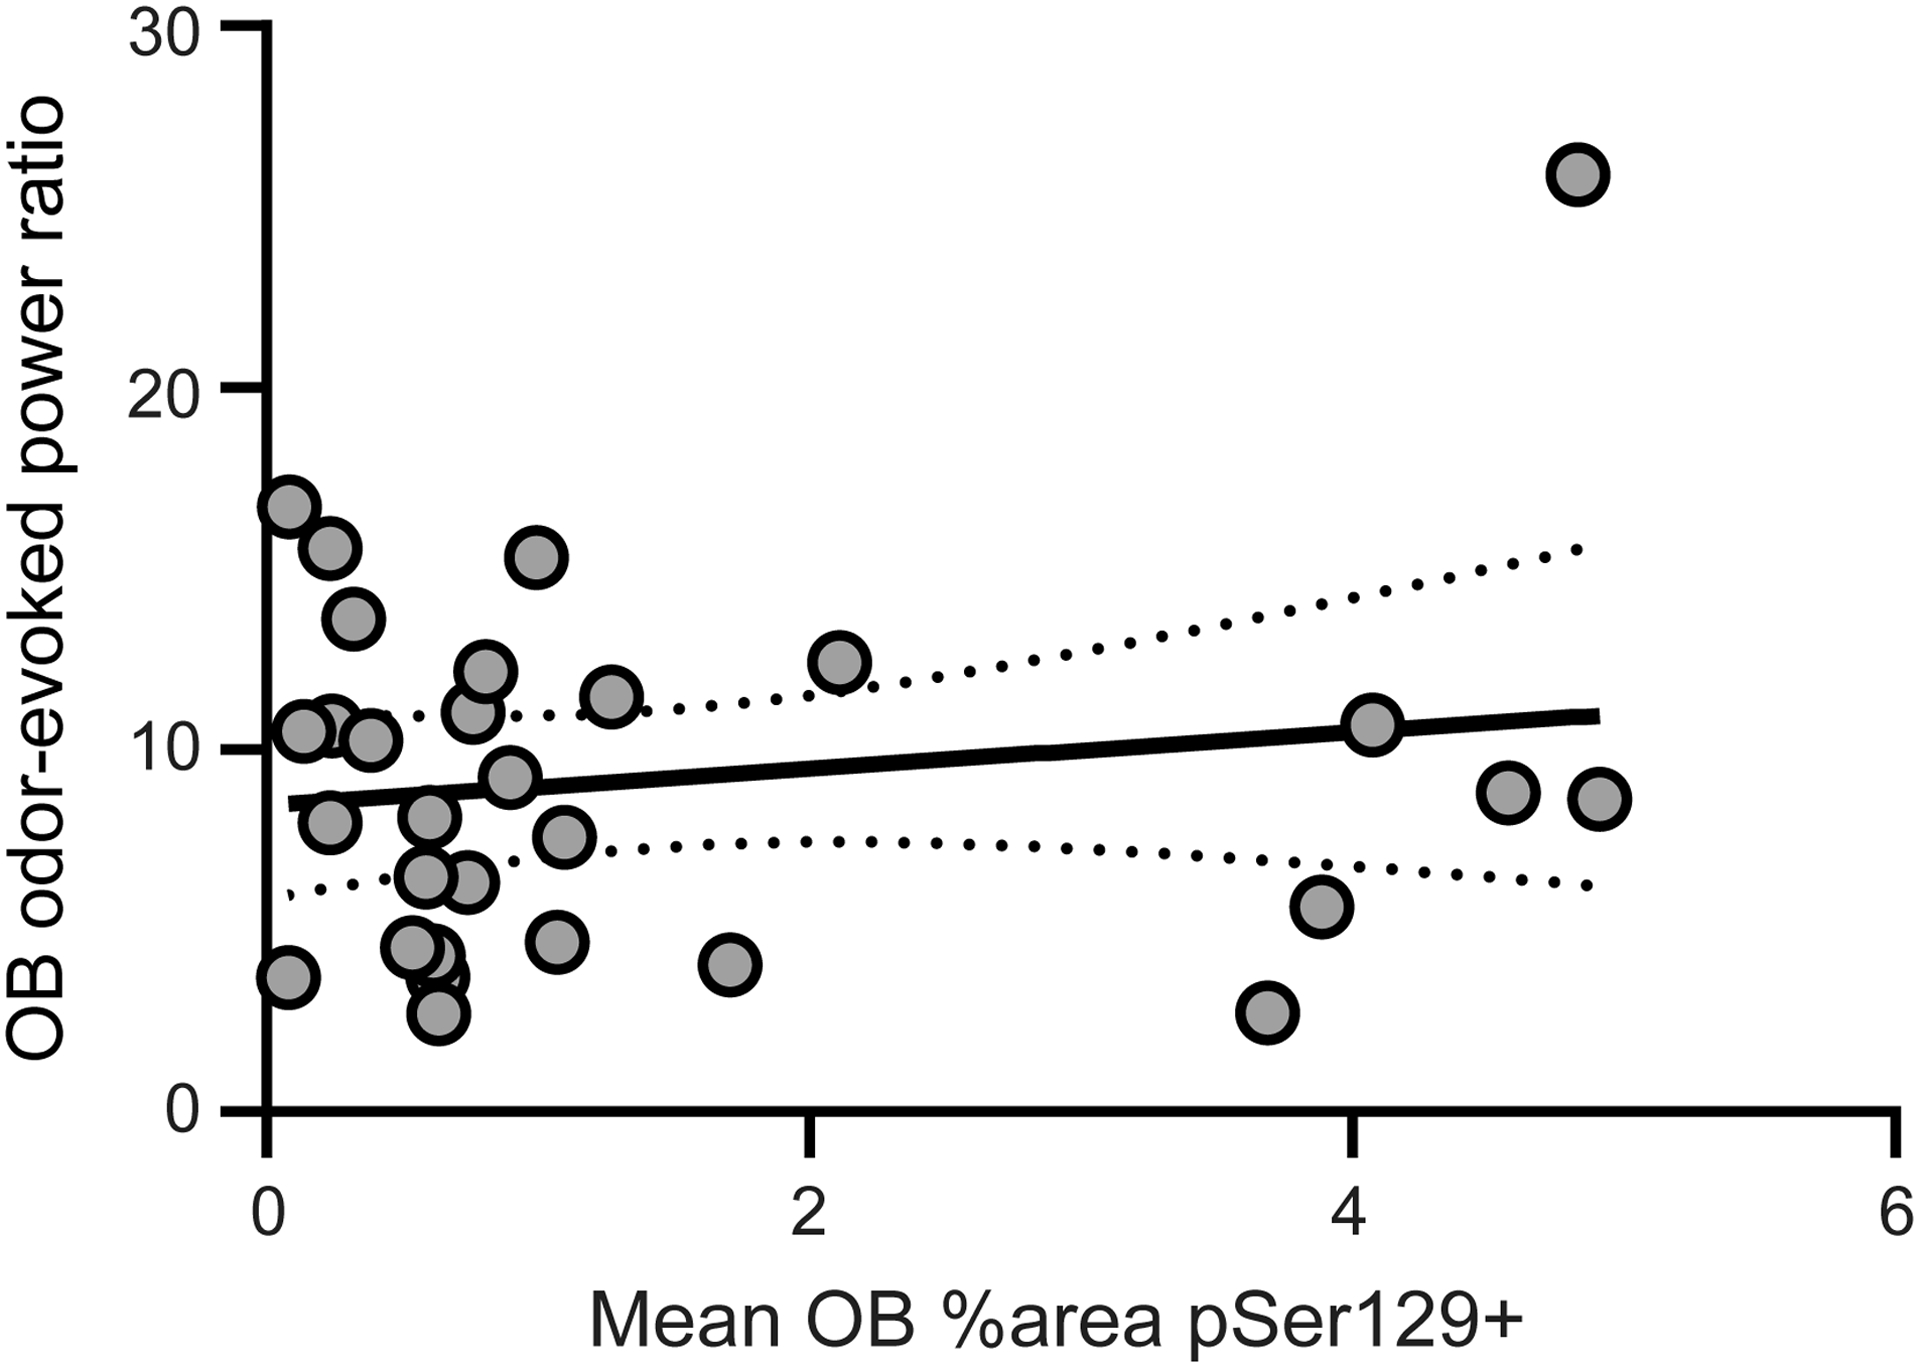
Results: We detected α-Syn pathology in both the OB and PCX. We also observed that α-Syn fibril injections influenced odor-evoked activity in the OB. In particular, α-Syn fibril-injected mice displayed aberrantly high odor-evoked power in the beta spectral range. A similar change in activity was not detected in the PCX, despite high levels of α-Syn pathology.
Conclusion: Together, this work provides evidence that synucleinopathy impacts in vivo neural activity in the olfactory system at the network-level.
Keywords: Lewy pathology; Parkinson’s disease; dementia; local field potential; olfaction; olfactory bulb; piriform cortex; synucleinopathy.
Conflict of interest statement
Figures
Similar articles
-
Spread of aggregates after olfactory bulb injection of α-synuclein fibrils is associated with early neuronal loss and is reduced long term.Acta Neuropathol. 2018 Jan;135(1):65-83. doi: 10.1007/s00401-017-1792-9. Epub 2017 Dec 5. Acta Neuropathol. 2018. PMID: 29209768 Free PMC article.
-
Widespread transneuronal propagation of α-synucleinopathy triggered in olfactory bulb mimics prodromal Parkinson's disease.J Exp Med. 2016 Aug 22;213(9):1759-78. doi: 10.1084/jem.20160368. Epub 2016 Aug 8. J Exp Med. 2016. PMID: 27503075 Free PMC article.
-
Alterations in Piriform and Bulbar Activity/Excitability/Coupling Upon Amyloid-β Administration in vivo Related to Olfactory Dysfunction.J Alzheimers Dis. 2021;82(s1):S19-S35. doi: 10.3233/JAD-201392. J Alzheimers Dis. 2021. PMID: 33459655
-
Complex metabolically demanding sensory processing in the olfactory system: implications for epilepsy.Epilepsy Behav. 2014 Sep;38:37-42. doi: 10.1016/j.yebeh.2013.08.036. Epub 2013 Oct 7. Epilepsy Behav. 2014. PMID: 24113565 Free PMC article. Review.
-
Propagation of alpha-synuclein pathology from the olfactory bulb: possible role in the pathogenesis of dementia with Lewy bodies.Cell Tissue Res. 2018 Jul;373(1):233-243. doi: 10.1007/s00441-017-2733-6. Epub 2017 Dec 1. Cell Tissue Res. 2018. PMID: 29196808 Review.
Cited by
-
Site-specific seeding of Lewy pathology induces distinct pre-motor cellular and dendritic vulnerabilities in the cortex.Nat Commun. 2024 Dec 30;15(1):10775. doi: 10.1038/s41467-024-54945-0. Nat Commun. 2024. PMID: 39737978 Free PMC article.
-
Aerobic Exercise Improves Methamphetamine-Induced Olfactory Dysfunction Through α-Synuclein Intervention in Male Mice.Front Mol Neurosci. 2022 May 2;15:884790. doi: 10.3389/fnmol.2022.884790. eCollection 2022. Front Mol Neurosci. 2022. PMID: 35586307 Free PMC article.
-
Lack of Parkinsonian Pathology and Neurodegeneration in Mice After Long-Term Injections of a Proteasome Inhibitor in Olfactory Bulb and Amygdala.Front Aging Neurosci. 2021 Oct 21;13:698979. doi: 10.3389/fnagi.2021.698979. eCollection 2021. Front Aging Neurosci. 2021. PMID: 34744683 Free PMC article.
-
α-Synuclein aggregation in the olfactory bulb induces olfactory deficits by perturbing granule cells and granular-mitral synaptic transmission.NPJ Parkinsons Dis. 2021 Dec 13;7(1):114. doi: 10.1038/s41531-021-00259-7. NPJ Parkinsons Dis. 2021. PMID: 34903719 Free PMC article.
-
Alpha-synuclein pathology and Parkinson's disease-related olfactory dysfunctions: an update on preclinical models and therapeutic approaches.Mamm Genome. 2025 Jun;36(2):444-464. doi: 10.1007/s00335-025-10128-w. Epub 2025 Apr 28. Mamm Genome. 2025. PMID: 40293510 Free PMC article. Review.
References
-
- Goedert M (2001) Alpha-synuclein and neurodegenerative diseases. Nat Rev Neurosci 2,. - PubMed
-
- Spillantini MG, Schmidt ML, Lee VM, Trojanowski JQ, Jakes R, Goedert M (1997) Alpha-synuclein in Lewy bodies. Nature 388,. - PubMed
-
- Braak H, Ghebremedhin E, Rüb U, Bratzke H, Tredici K (2004) Stages in the development of Parkinson’s disease-related pathology. Cell Tissue Res 318, 121–134. - PubMed
-
- Braak H, Rüb U, Gai WP, Del Tredici K (2003) Idiopathic Parkinson’s disease: Possible routes by which vulnerable neuronal types may be subject to neuroinvasion by an unknown pathogen. J. Neural Transm 110, 517–536. - PubMed
-
- Doty RL (2012) Olfactory dysfunction in Parkinson disease. Nat. Rev. Neurol 8, 329–339. - PubMed
Publication types
MeSH terms
Substances
Grants and funding
LinkOut - more resources
Full Text Sources
Miscellaneous
