

Intraoperative Observational Real-time Electrocochleography as a Predictor of Hearing Loss After Cochlear Implantation: 3 and 12 Month Outcomes
- PMID: 32925842
- PMCID: PMC7497893
- DOI: 10.1097/MAO.0000000000002773
Intraoperative Observational Real-time Electrocochleography as a Predictor of Hearing Loss After Cochlear Implantation: 3 and 12 Month Outcomes
Abstract
Objective: A decrease in intracochlear electrocochleographic (ECochG) amplitude during cochlear implantation has been associated with poorer postoperative hearing preservation in several short-term studies. Here, we relate the stability of ECochG during surgery to hearing preservation at 3- and 12-months.
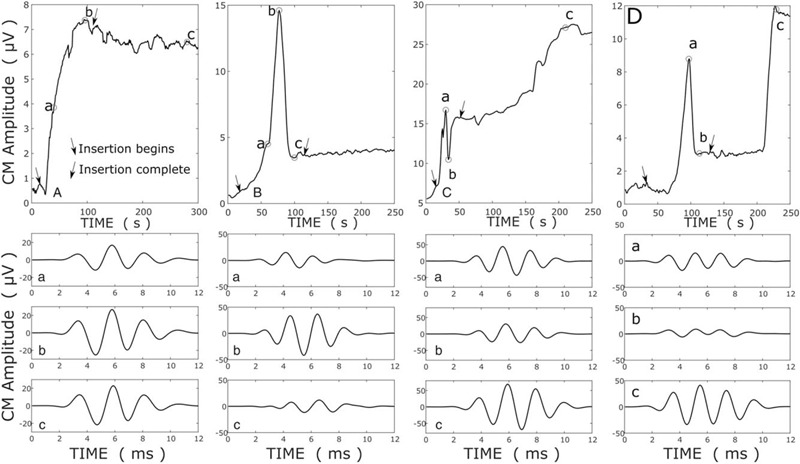
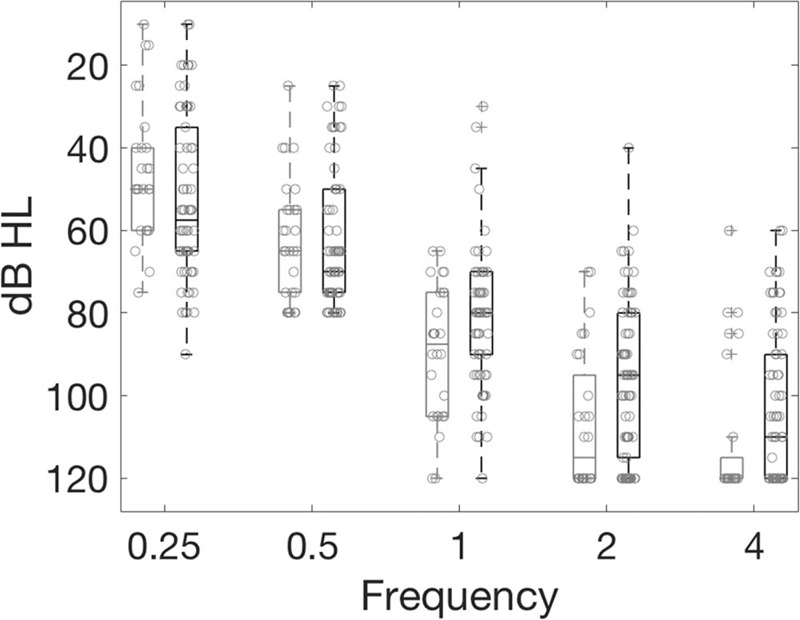
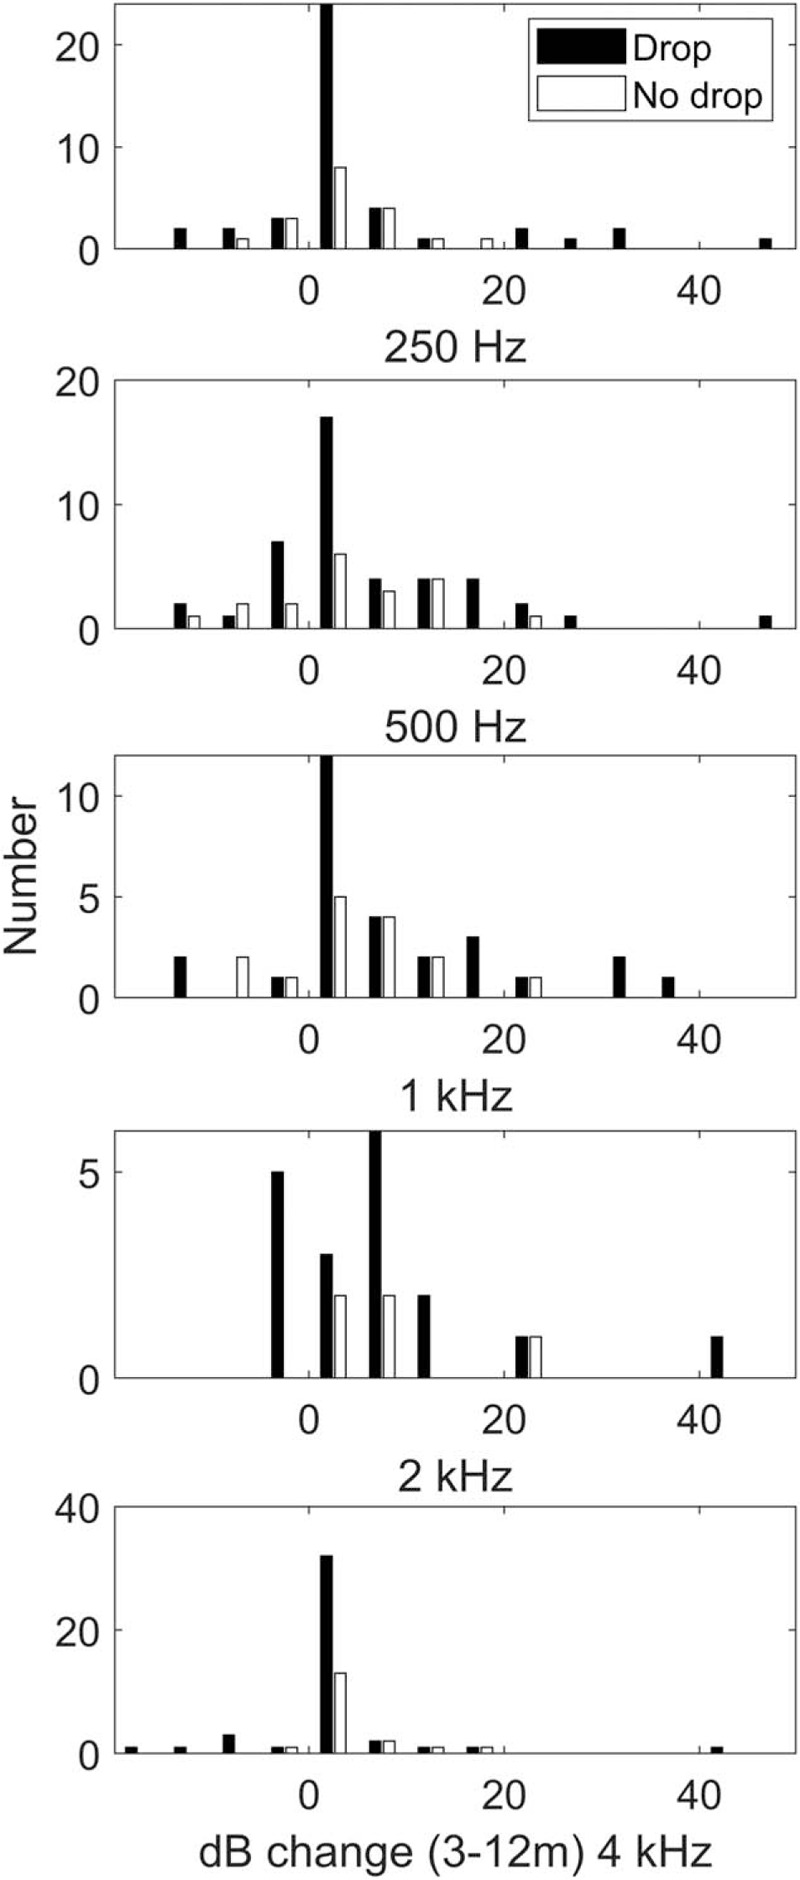
Methods: Patients with hearing ≤80-dB HL at 500 Hz were implanted with a slim-straight electrode array. ECochG responses to short, high-intensity, 500-Hz pure tones of alternating polarity were recorded continuously from the apical-most electrode during implantation. No feedback was provided to the surgeon. ECochG amplitude was derived from the difference response, and implantations classified by the presence ("ECochG drop") or absence ("no drop") of a ≥30% reduction in ECochG amplitude during insertion. Residual hearing (relative and absolute) was reported against the ECochG class.
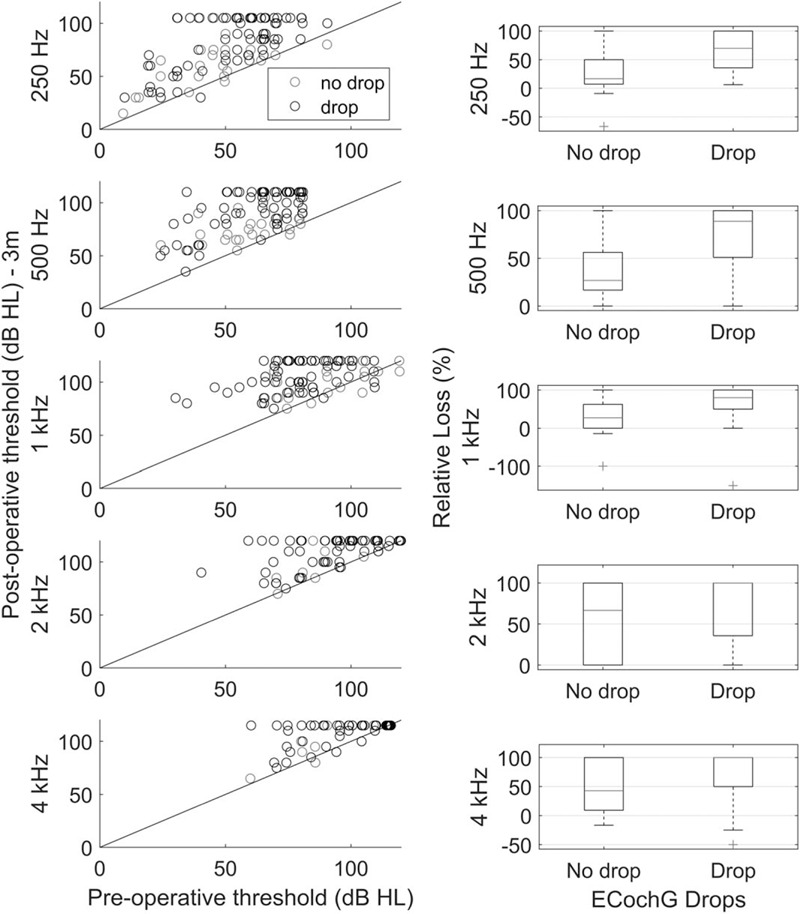
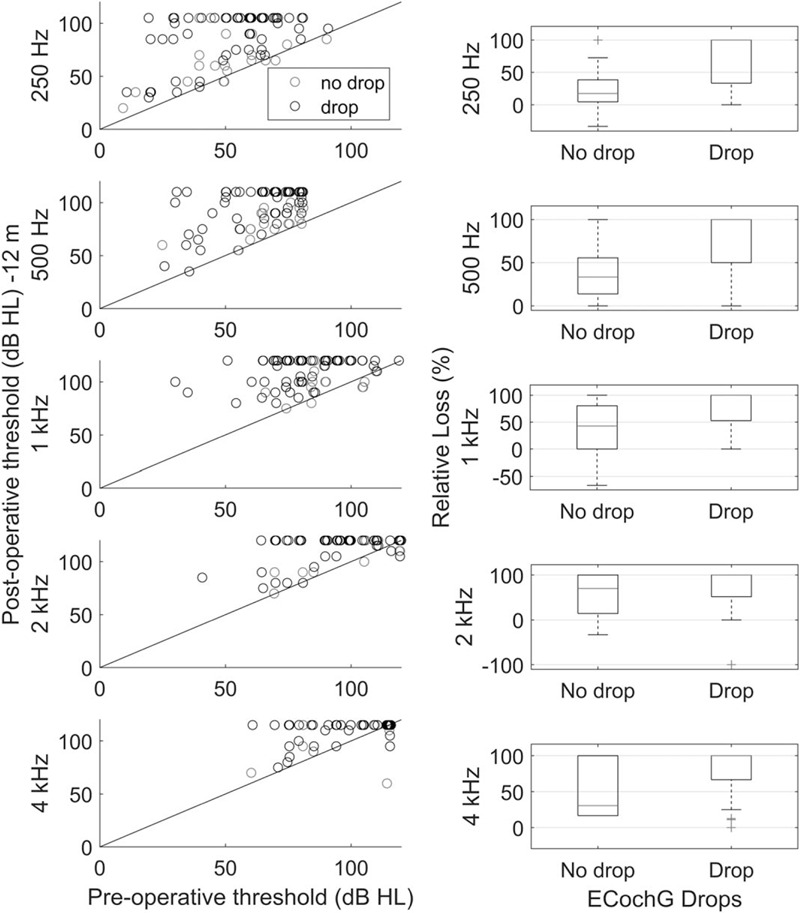
Results: ECochG was recorded from 109 patients. Of these, interpretable ECochG signals were recorded from 95. Sixty-six of 95 patients had an ECochG drop during implantation. Patients with an ECochG drop had poorer preoperative hearing above 1000 Hz. Hearing preservation (in decibels, relative to preoperative levels and functionally) was significantly poorer at 250-, 500-, and 1000-Hz at 3 months in patients exhibiting an ECochG drop. Twelve-month outcomes were available from 85 patients, with significantly poorer functional hearing, and greater relative and absolute hearing loss from 250 to 1000 Hz, when an ECochG drop had been encountered.
Conclusion: Patients exhibiting ECochG drops during implantation had significantly poorer hearing preservation 12 months later. These observational outcomes support the future development of surgical interventions responsive to real-time intracochlear ECochG. Early intervention to an ECochG drop could potentially lead to prolonged improvements in hearing preservation.
Conflict of interest statement
The authors disclose no conflicts of interest.
Figures
References
-
- Campbell L, Kaicer A, Briggs R, et al. Cochlear response telemetry: Intracochlear electrocochleography via cochlear implant neural response telemetry pilot study results. Otol Neurotol 2016; 36:399 405. - PubMed
-
- Campbell L, Kaicer A, Sly D, et al. Intraoperative real-time cochlear response telemetry predicts hearing preservation in cochlear implantation. Otol Neurotol 2016; 37:332 338. - PubMed
-
- Dalbert A, Pfiffner F, Röösli C, et al. Extra- and intracochlear electrocochleography in cochlear implant recipients. Audiol Neurotol 2015; 20:339 348. - PubMed
-
- Verberne J, Risi F, Campbell L, et al. The effect of scala tympani morphology on basilar membrane contact with a straight electrode array: A human temporal bone study. Otol Neurotol 2017; 38:47 53. - PubMed
Publication types
MeSH terms
LinkOut - more resources
Full Text Sources
Medical
Research Materials
Miscellaneous
