

A disordered encounter complex is central to the yeast Abp1p SH3 domain binding pathway
- PMID: 32925900
- PMCID: PMC7514057
- DOI: 10.1371/journal.pcbi.1007815
A disordered encounter complex is central to the yeast Abp1p SH3 domain binding pathway
Erratum in
-
Correction: A disordered encounter complex is central to the yeast Abp1p SH3 domain binding pathway.PLoS Comput Biol. 2025 Jun 18;21(6):e1013201. doi: 10.1371/journal.pcbi.1013201. eCollection 2025 Jun. PLoS Comput Biol. 2025. PMID: 40531915 Free PMC article.
Abstract
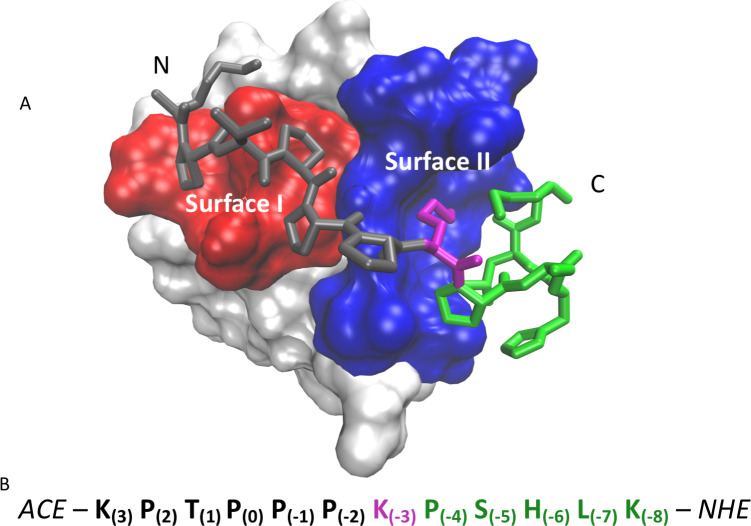
Protein-protein interactions are involved in a wide range of cellular processes. These interactions often involve intrinsically disordered proteins (IDPs) and protein binding domains. However, the details of IDP binding pathways are hard to characterize using experimental approaches, which can rarely capture intermediate states present at low populations. SH3 domains are common protein interaction domains that typically bind proline-rich disordered segments and are involved in cell signaling, regulation, and assembly. We hypothesized, given the flexibility of SH3 binding peptides, that their binding pathways include multiple steps important for function. Molecular dynamics simulations were used to characterize the steps of binding between the yeast Abp1p SH3 domain (AbpSH3) and a proline-rich IDP, ArkA. Before binding, the N-terminal segment 1 of ArkA is pre-structured and adopts a polyproline II helix, while segment 2 of ArkA (C-terminal) adopts a 310 helix, but is far less structured than segment 1. As segment 2 interacts with AbpSH3, it becomes more structured, but retains flexibility even in the fully engaged state. Binding simulations reveal that ArkA enters a flexible encounter complex before forming the fully engaged bound complex. In the encounter complex, transient nonspecific hydrophobic and long-range electrostatic contacts form between ArkA and the binding surface of SH3. The encounter complex ensemble includes conformations with segment 1 in both the forward and reverse orientation, suggesting that segment 2 may play a role in stabilizing the correct binding orientation. While the encounter complex forms quickly, the slow step of binding is the transition from the disordered encounter ensemble to the fully engaged state. In this transition, ArkA makes specific contacts with AbpSH3 and buries more hydrophobic surface. Simulating the binding between ApbSH3 and ArkA provides insight into the role of encounter complex intermediates and nonnative hydrophobic interactions for other SH3 domains and IDPs in general.
Conflict of interest statement
The authors have declared that no competing interests exist.
Figures


Similar articles
-
Sizes, conformational fluctuations, and SAXS profiles for intrinsically disordered proteins.Protein Sci. 2025 Apr;34(4):e70067. doi: 10.1002/pro.70067. Protein Sci. 2025. PMID: 40095314
-
The Impact of Disorder-Order Switching on Protein Sequence Evolution.Biochemistry. 2025 Jul 15;64(14):3063-3069. doi: 10.1021/acs.biochem.5c00026. Epub 2025 Jun 23. Biochemistry. 2025. PMID: 40549344
-
Molecular feature-based classification of retroperitoneal liposarcoma: a prospective cohort study.Elife. 2025 May 23;14:RP100887. doi: 10.7554/eLife.100887. Elife. 2025. PMID: 40407808 Free PMC article.
-
Assessing the comparative effects of interventions in COPD: a tutorial on network meta-analysis for clinicians.Respir Res. 2024 Dec 21;25(1):438. doi: 10.1186/s12931-024-03056-x. Respir Res. 2024. PMID: 39709425 Free PMC article. Review.
-
Intrinsically disordered proteins: Ensembles at the limits of Anfinsen's dogma.Biophys Rev (Melville). 2022 Mar 17;3(1):011306. doi: 10.1063/5.0080512. eCollection 2022 Mar. Biophys Rev (Melville). 2022. PMID: 38505224 Free PMC article. Review.
Cited by
-
Intrinsically disordered proteins play diverse roles in cell signaling.Cell Commun Signal. 2022 Feb 17;20(1):20. doi: 10.1186/s12964-022-00821-7. Cell Commun Signal. 2022. PMID: 35177069 Free PMC article. Review.
-
An Unbound Proline-Rich Signaling Peptide Frequently Samples Cis Conformations in Gaussian Accelerated Molecular Dynamics Simulations.Front Mol Biosci. 2021 Nov 15;8:734169. doi: 10.3389/fmolb.2021.734169. eCollection 2021. Front Mol Biosci. 2021. PMID: 34869581 Free PMC article.
-
When Order Meets Disorder: Modeling and Function of the Protein Interface in Fuzzy Complexes.Biomolecules. 2021 Oct 16;11(10):1529. doi: 10.3390/biom11101529. Biomolecules. 2021. PMID: 34680162 Free PMC article. Review.
-
Multivalency enables unidirectional switch-like competition between intrinsically disordered proteins.Proc Natl Acad Sci U S A. 2022 Jan 18;119(3):e2117338119. doi: 10.1073/pnas.2117338119. Proc Natl Acad Sci U S A. 2022. PMID: 35012986 Free PMC article.
-
How a highly acidic SH3 domain folds in the absence of its charged peptide target.Protein Sci. 2023 May;32(5):e4635. doi: 10.1002/pro.4635. Protein Sci. 2023. PMID: 36992534 Free PMC article.
References
Publication types
MeSH terms
Substances
LinkOut - more resources
Full Text Sources
Molecular Biology Databases
Research Materials
