. 2020 Sep 14;16(9):e1008993.
doi: 10.1371/journal.pgen.1008993. eCollection 2020 Sep.

The Arabidopsis PHD-finger protein EDM2 has multiple roles in balancing NLR immune receptor gene expression

Affiliations

The Arabidopsis PHD-finger protein EDM2 has multiple roles in balancing NLR immune receptor gene expression

Yan Lai et al. PLoS Genet. .

Abstract

Plant NLR-type receptors serve as sensitive triggers of host immunity. Their expression has to be well-balanced, due to their interference with various cellular processes and dose-dependency of their defense-inducing activity. A genetic "arms race" with fast-evolving pathogenic microbes requires plants to constantly innovate their NLR repertoires. We previously showed that insertion of the COPIA-R7 retrotransposon into RPP7 co-opted the epigenetic transposon silencing signal H3K9me2 to a new function promoting expression of this Arabidopsis thaliana NLR gene. Recruitment of the histone binding protein EDM2 to COPIA-R7-associated H3K9me2 is required for optimal expression of RPP7. By profiling of genome-wide effects of EDM2, we now uncovered additional examples illustrating effects of transposons on NLR gene expression, strongly suggesting that these mobile elements can play critical roles in the rapid evolution of plant NLR genes by providing the "raw material" for gene expression mechanisms. We further found EDM2 to have a global role in NLR expression control. Besides serving as a positive regulator of RPP7 and a small number of other NLR genes, EDM2 acts as a suppressor of a multitude of additional NLR genes. We speculate that the dual functionality of EDM2 in NLR expression control arose from the need to compensate for fitness penalties caused by high expression of some NLR genes by suppression of others. Moreover, we are providing new insights into functional relationships of EDM2 with its interaction partner, the RNA binding protein EDM3/AIPP1, and its target gene IBM1, encoding an H3K9-demethylase.


Conflict of interest statement

The authors have declared that no competing interests exist.

Figures
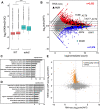
Fig 1
Fig 1. EDM2 affects genome-wide H3K9me2 and transcripts.
(A) Box plot showing normalized H3K9me2 levels relative to histone H3 distribution for significantly affected genes (P adjust value < 0.05) in each replicated of WT ChIP-seq sample (red boxes) and edm2-2 ChIP-seq sample (turquoise boxes). Statistical significance of differences between WT and edm2-2 is determined using combined gene counts of replicates and by Wilcoxon signed rank test. ***: P-value < 2.2e-16. (B) The minus-average (MA) plot representing differential expressed genes in edm2/WT. Displayed are fold change values (y-axis) against expression levels (x-axis). Genes exhibiting significant differential expression changes between WT and edm2-2 (P adjust value < 0.05) are colored in red and blue, where red marked edm2-2 up-regulated genes and blue marked the edm2-2 down-regulated genes. NLR genes with P adjust value < 0.05 are represented by black triangles. ACTIN2 (ACT2), ACTIN7 (ACT7), ACTIN8 (ACT8) and TUBULIN6 (TUB6) are used as benchmarks for differential expression analysis and are labeled in green. (C and D) Significantly enriched GO (Gene Ontology) terms with P < 0.05 for the top 10 categories of edm2-2 up-regulated genes (C) and down-regulated genes (D). (E) Scatterplot showing the correlation of transcript levels versus H3K9me2 levels of genes differentially expressed and H3K9-dimethylated in edm2-2 compared to WT.
Fig 2
Fig 2. EDM2 is associated with RPP7 and RPP4, and affects H3K9me2 and transcript levels at these loci.
(A and B) Genome browser view of H3K9me2 ChIP-seq, RNA-seq and HA-tagged EDM2 ChIP-seq at RPP7 (A) and RPP4 (B). Y-axis represents coverage values (normalized per million mapped reads). Schematic representations of the RPP7 and RPP4 loci with individual RNA transcript isoforms are shown at the bottom. Transposons are represented by grey boxes framed in red and genic exons by black-framed grey boxes. ECL: “Exon 1-containing 5’LTR terminated” non-coding transcript resulting from proximal polyadenylation/transcript termination at RPP7. Red vertical arrows indicate the polyadenylation sites and horizontal black arrows indicate transcription start sites.
Fig 3
Fig 3. EDM2 suppresses transcript levels of many NLRs and basal defense.
A. Distribution of all genes, defense genes, NLR genes and genes of several other functional categories (defined by enriched GO terms) that show significant transcript level changes in edm2-2 compared to WT. Besides defense genes and NLRs, only non defense-associated categories with at least 130 genes differentially expressed in edm2-2 compared to WT were considered. χ2 test of independence was performed to detect significant differences between actual and expected equal distribution (50% up-regulated and 50% down-regulated genes). ***: P-value <0.001. B. Transcript level changes of EDM2-affected NLR genes. Only NLR genes with significant transcript level differences between edm2-2 and WT are included. C. Defense phenotype of edm2 mutants infected with Pseudomonas syringae pv. tomato DC3000 (Pst DC3000). Bacterial multiplication was monitored at 3 hrs(0), 2 days post inoculation (dpi) and 3 dpi with a 2 ×10⁸ cfu/mL bacterial suspension. Error bars represent SEM for three biological replicates. fls2 (SALK_141277) seedlings were used as a susceptible control. Statistical significance was determined by Student’s t-tests. *: P-value <0.05. **: P-value <0.01.
Fig 4
Fig 4. EDM2 affects H3K9me2 and transcript levels at hundreds of TEs.
(A and B) Pie charts representing types of TEs differentially affected by EDM2 (edm2-2 vs. WT) in H3K9me2 ChIP-seq (A) or RNA-seq data (B) sets. (C) Chromosomal locations of TEs significantly affected by EDM2 in H3K9me2 ChIP-seq and/or RNA-seq data. The chromosome map tool (https://www.arabidopsis.org/jsp/ChromosomeMap/tool.jsp) was used to define the locations of TEs. Vertical yellow lines represent individual TEs. Horizontal bars mark centromeric and pericentromeric heterochromatic areas. (D and E) Proportion of EDM2-controlled TEs compared to all TEs located either in the chromosomal arms (D) or pericentromeric regions (E). Statistical significance was determined by Fisher exact test. *: P-value <0.05. **: P-value <0.01. ***: P-value <0.001.
Fig 5
Fig 5. EDM2 controls alternative transcript polyadenylation at the RPP4 locus and affects function of this NLR gene.
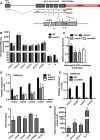
(A) Schematic representation of RPP4 with alternative RNA transcript isoforms. The termination codon (TAG) is marked by red star. Red vertical arrows represent polyadenylation sites determined by 3’RACE. Areas a (polyadenylation site #5 - #6) and b (polyadenylation site #6 - #8) are marked by blue horizontal lines and represent regions used for read counts shown in (B). Black horizontal arrows represent PCR primers used for qRT-PCR (i and ii) in (C). Regions amplified by qPCR for each exon in (D), (E) and (F) are represented by black horizontal bars. (B) RNA-seq read counts for RPP4 exons1–6 and 3’UTR areas in WT and edm2-2. Exon1 contains 5’UTR and exon6 contains 3’UTR sequences. The coordinates for area a and b are 9488547–9488584 and 9488463–9488546, respectively. The y-axis represents normalized read counts calculated by DESeq2 in R. Error bars represent SD from three biological replicates. ***: P-adjusted value <0.001. (C) Levels of full-length 3’UTR-containing transcripts measured by qRT-PCR. Error bars represent SD from three biological replicates. Statistical significance was determined by Student’s t-tests. *: P-value <0.05. (D) Levels of H3K9me2 determined by ChIP-qPCR in WT, edm2-2 and edm2-3. H3K9me2 levels were normalized to the total histone H3 levels. ACTIN8 (ACT8) served as a control locus. Error bars represent SEM for two biological replicates each with three technical replicates. (E) Levels of H3K9me2 measured by ChIP-qPCR in WT and suvh456. H3K9me2 levels were normalized to the total histone H3 levels. Error bars represent SEM from two biological replicates each based on three technical replicates. (F) Levels of HA-EDM2 at RPP4 in E2pro:HA-E2c line. ACTIN8 (ACT8) served as a control locus. Fold enrichment values were measured by ChIP-qPCR relative to each area in WT. Error bars represent SEM from three biological replicates each based on three technical replicates. (G) Susceptibility phenotype of edm2 mutants to the Hyaloperonospora arabidopsidis isolate Emoy2. Numbers of sporangiophores per cotyledons of WT, edm2-2, edm2-3 and Oy1 lines 7 days post infection (dpi) with spores of the RPP4-recognized Hpa-Emoy2. Error bars represent SEM for five biological replicates, each replicate including at least 100 cotyledons. Statistical significance was determined by Student’s t-tests. *: P-value <0.05. **: P-value <0.01.
Fig 6
Fig 6. EDM2 affects AT4G16900.
(A) Genome browser view of normalized H3K9me2 ChIP-seq, RNA-seq and HA-tagged EDM2 ChIP-seq at the AT4G16900 locus. The y-axis represents coverage values (normalized per million mapped reads). Schematic representations of the AT4G16900 locus with individual RNA transcript isoforms are shown in the top. The stop codon (TAA) is marked by a red star. Regions amplified by qPCR for each exons are represented by horizontal bars. (B) Levels of HA-EDM2 at AT4G16900 in the E2pro:HA-E2c line. ACTIN8 (ACT8) served as a control locus. Fold enrichment values were measured by ChIP-qPCR relative to each respective area in WT. Error bars represent SEM for two biological replicates with three technical replicates. Statistical significance was determined by Student’s t-tests. *: P-value <0.05. (C) Levels of H3K9me2 determined by ChIP-qPCR in WT, edm2-2 and edm2-3. H3K9me2 levels were normalized to the total histone H3 levels. ACTIN8 (ACT8) served as a control locus. Error bars represent SEM for two biological replicates with three technical replicates.
Fig 7
Fig 7. EDM2 affects members of the Col-0 RPP7 NLR cluster.
(A) Genome browser view of normalized HA-tagged EDM2 ChIP-seq and H3K9me2 ChIP-seq (WT and edm2-2) at the RPP7 cluster. Eight NLR genes are labeled in black; three Copia-type TEs are labeled in red. (B and C) Genome browser view of normalized RNA-seq data for AT1G58390, AT1G58400, AT1G58410 (B) and AT1G59124 (C) of the RPP7 cluster. The y-axis represents coverage values (normalized per million mapped reads).
Fig 8
Fig 8. TEs closely associate with NLR genes in Arabidopsis.
(A) Distances outside of the annotated mRNA gene space (from transcriptional start site to polyadenylation site) of NLR genes and non-NLR genes (x-axis) are plotted against the average number of annotated TE (TE) base pairs present in the respective area (y-axis) for each group of genes. Dashed bars represent 95% confidence intervals. Statistically significant differences between NLR and non-NLR genes have been calculated using ANOVA and are for all comparisons between NLR and non-NLR genes. ***: P-value = 5.775357e-29.(B) Average distance to the nearest TE for the 59 EDM2-controlled NLRs compared with the remaining 106 annotated NLRs in the Arabidopsis genome. The black bars represent 4,405.68 bp for 59 EDM2-controlled NLRs and 3,768.04 bp for the 106 NLR genes. An unpaired t-test showed that there is no significant difference between both examined gene sets.

Similar articles

Cited by

References

    1. Jones JD, Vance RE, Dangl JL. Intracellular innate immune surveillance devices in plants and animals. Science. 2016;354(6316):aaf6395 10.1126/science.aaf6395 . - DOI - PubMed
    1. Jacob F, Vernaldi S, Maekawa T. Evolution and conservation of plant NLR functions. Front Immunol. 2013;4:297 10.3389/fimmu.2013.00297 . - DOI - PMC - PubMed
    1. Li F, Pignatta D, Bendix C, Brunkard JO, Cohn MM, Tung J, et al. MicroRNA regulation of plant innate immune receptors. Proc Natl Acad Sci U S A. 2012;109(5):1790–1795. 10.1073/pnas.1118282109 . - DOI - PMC - PubMed
    1. Lai Y, Eulgem T. Transcript-level expression control of plant NLR genes. Mol Plant Pathol. 2018;19(5):1267–1281. 10.1111/mpp.12607 . - DOI - PMC - PubMed
    1. Bieri S, Mauch S, Shen QH, Peart J, Devoto A, Casais C, et al. RAR1 positively controls steady state levels of barley MLA resistance proteins and enables sufficient MLA6 accumulation for effective resistance. Plant Cell. 2004;16(12):3480–3495. 10.1105/tpc.104.026682 . - DOI - PMC - PubMed

Publication types

MeSH terms