. 2020 Sep 14;18(9):e3000783.
doi: 10.1371/journal.pbio.3000783. eCollection 2020 Sep.

Two unequally redundant "helper" immune receptor families mediate Arabidopsis thaliana intracellular "sensor" immune receptor functions

Affiliations

Two unequally redundant "helper" immune receptor families mediate Arabidopsis thaliana intracellular "sensor" immune receptor functions

Svenja C Saile et al. PLoS Biol. .

Abstract

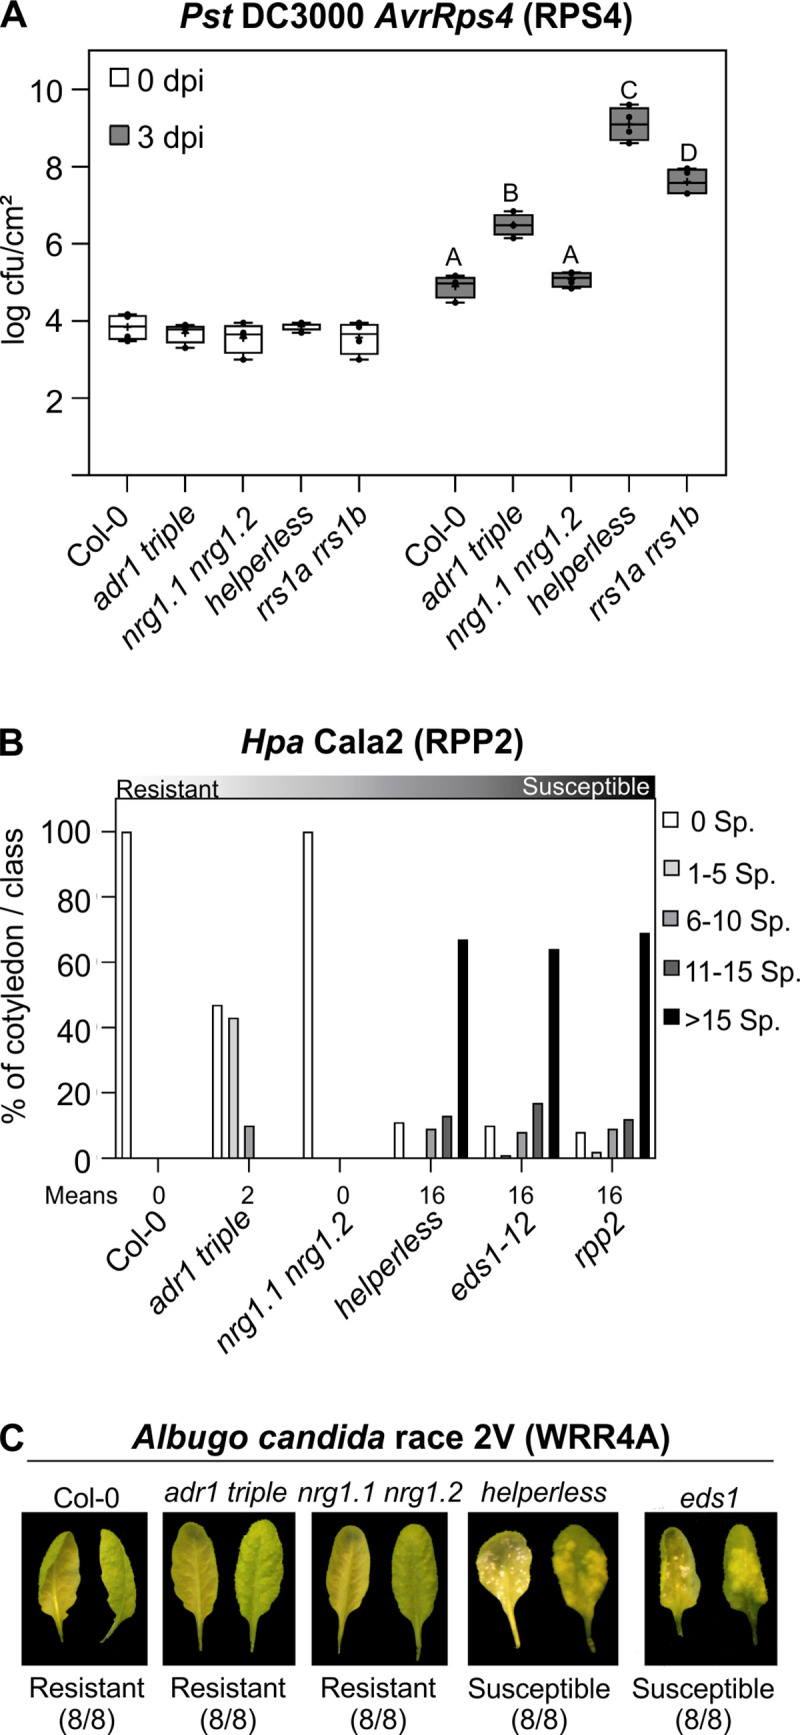
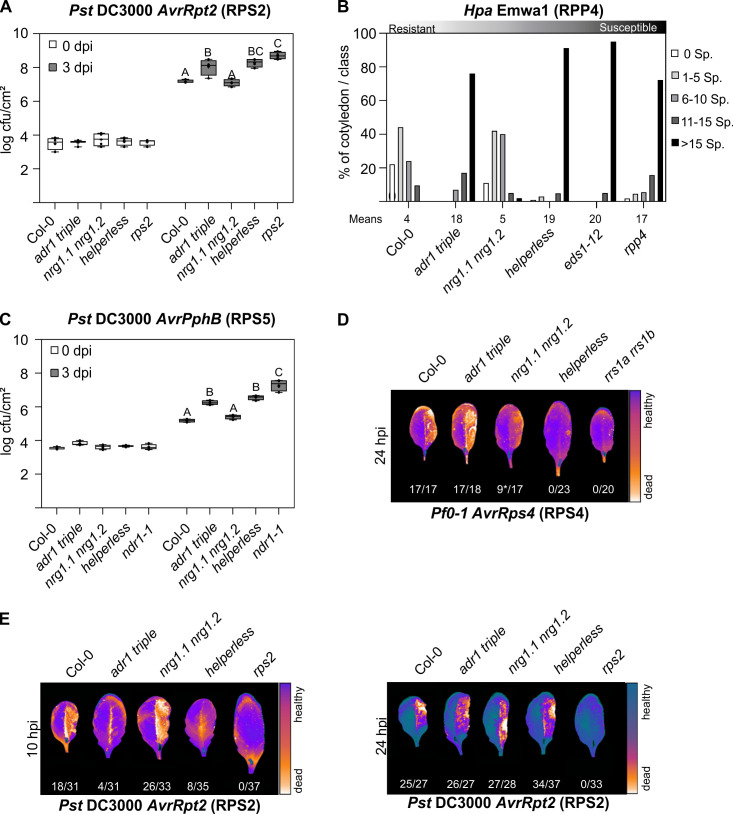
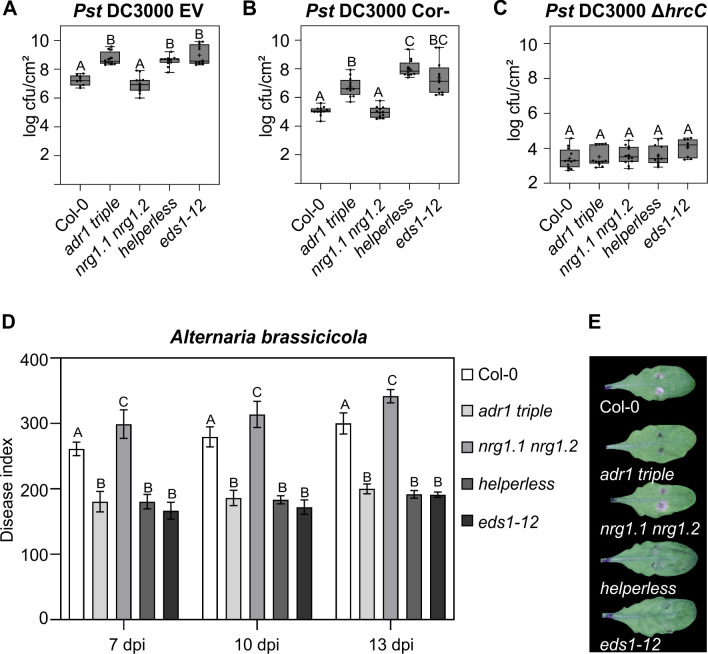
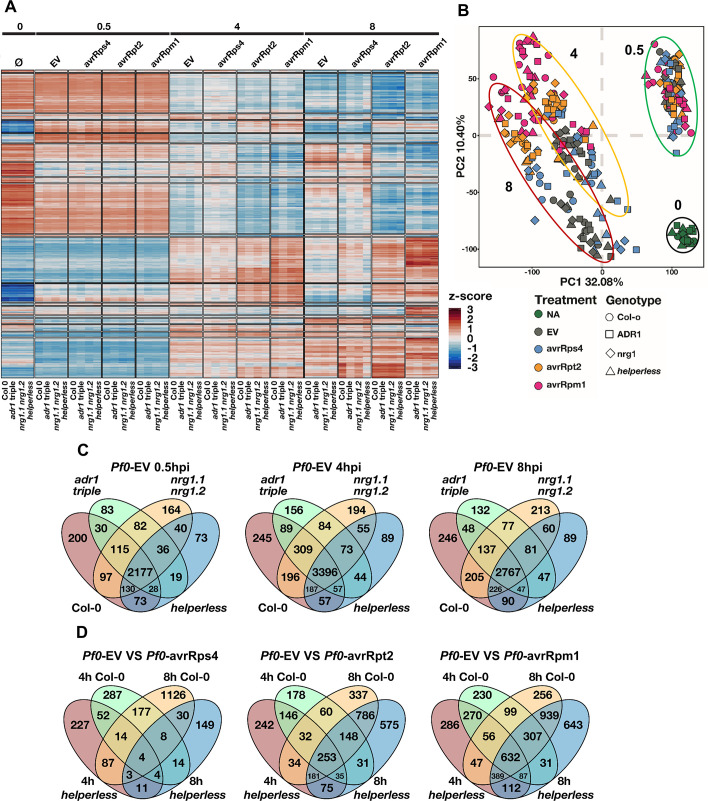
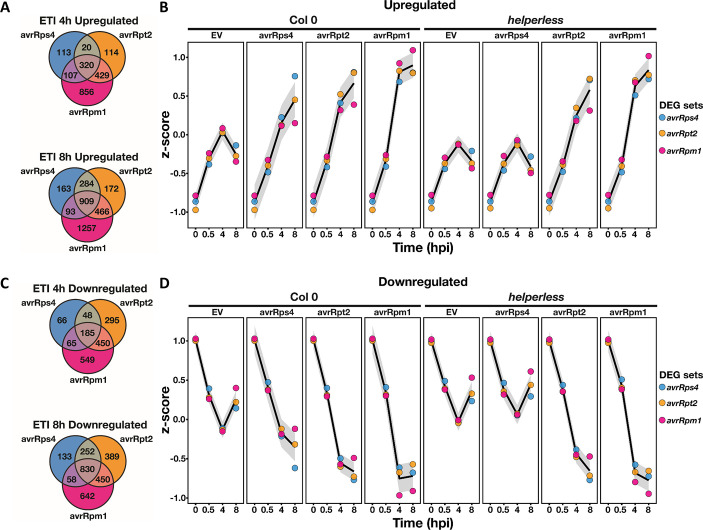
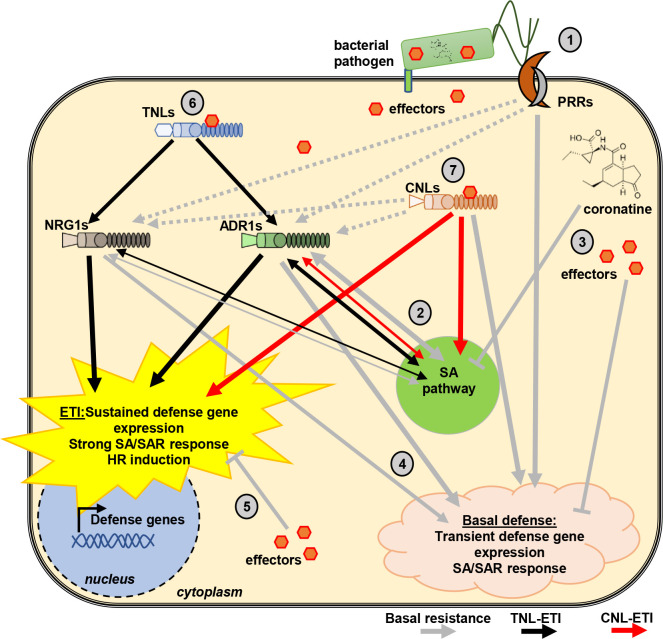
Plant nucleotide-binding (NB) leucine-rich repeat (LRR) receptor (NLR) proteins function as intracellular immune receptors that perceive the presence of pathogen-derived virulence proteins (effectors) to induce immune responses. The 2 major types of plant NLRs that "sense" pathogen effectors differ in their N-terminal domains: these are Toll/interleukin-1 receptor resistance (TIR) domain-containing NLRs (TNLs) and coiled-coil (CC) domain-containing NLRs (CNLs). In many angiosperms, the RESISTANCE TO POWDERY MILDEW 8 (RPW8)-CC domain containing NLR (RNL) subclass of CNLs is encoded by 2 gene families, ACTIVATED DISEASE RESISTANCE 1 (ADR1) and N REQUIREMENT GENE 1 (NRG1), that act as "helper" NLRs during multiple sensor NLR-mediated immune responses. Despite their important role in sensor NLR-mediated immunity, knowledge of the specific, redundant, and synergistic functions of helper RNLs is limited. We demonstrate that the ADR1 and NRG1 families act in an unequally redundant manner in basal resistance, effector-triggered immunity (ETI) and regulation of defense gene expression. We define RNL redundancy in ETI conferred by some TNLs and in basal resistance against virulent pathogens. We demonstrate that, in Arabidopsis thaliana, the 2 RNL families contribute specific functions in ETI initiated by specific CNLs and TNLs. Time-resolved whole genome expression profiling revealed that RNLs and "classical" CNLs trigger similar transcriptome changes, suggesting that RNLs act like other CNLs to mediate ETI downstream of sensor NLR activation. Together, our genetic data confirm that RNLs contribute to basal resistance, are fully required for TNL signaling, and can also support defense activation during CNL-mediated ETI.


Conflict of interest statement

The authors have declared that no competing interests exist.

Figures

Fig 1
Fig 1. Redundant functions of ADR1 and NRG1 subfamilies in TNL-mediated resistance.
(A) Six-week-old plants were hand-infiltrated with Pst DC3000 AvrRps4 (OD600 = 0.001), and bacterial growth was assessed at 0 and 3 dpi. Box limit represents upper and lower quartile; maximum and minimum values are displayed in whiskers. The middle line shows the median, the cross the mean cfu/cm2. Dots represent 4 technical replicates (leaf discs) in one experiment (biological replicate). Experiment was done 3 times with similar results. Letters indicate statistically significant differences following ANOVA with Tukey’s test (α = 0.05). (B) Ten-day-old seedlings were inoculated with Hpa Cala2. Sporangiophores per cotyledon were counted at 5 dpi. Cotyledons were classified as supporting no sporulation (0 Sp./cotyledon), light sporulation (1–5 and 6–10), medium sporulation (11–15), or heavy sporulation (>15). Two independent experiments were performed with an average of 100 cotyledons counted per genotype. Means of Sp./cotyledon for each genotype are noted below. Standard deviations of means for each genotype are as follows: Col-0 ± 0, adr1 triple ± 0.25, nrg1.1 nrg1.2 ± 0, helperless ± 0.68, eds1-12 ± 0.68 and rpp2a ± 0.65. Calculations for statistically significant differences following ANOVA with Tukey’s test (α = 0.05) are provided in S1 Data. (C) Three- to five-week-old plants were spray inoculated with Ac2V. Plants were phenotyped at 12 dpi. Abaxial and adaxial photographs of the same leaf are shown. Numbers indicate the number of individual plants showing a similar phenotype from the number of plants tested. NLRs activated in infection experiments shown in A–C are indicated in parenthesis. Underlying numerical data are provided in S1 Data. Ac2V, Albugo candida race 2V; cfu, colony-forming units; Col-0, Columbia-0; dpi, days post infection; Hpa, Hyaloperonospora arabidopsidis; NLR, nucleotide-binding leucine-rich repeat receptor; OD600, optical density at 600 nm; Pst, Pseudomonas syringae pv. tomato; Sp., Sporangiophores; TNL, Toll/interleukin-1 receptor resistance domain-containing NLR.
Fig 2
Fig 2. Specific functions of ADR1 and NRG1 subfamilies during ETI.
(A, C) Six-week old plants were hand-infiltrated with (A) Pst DC3000 AvrRpt2 (OD600 = 0.001) or (C) Pst DC30000 AvrPphB (OD600 = 0.001), and bacterial growth was assessed at 0 and 3 dpi. Box limit represents upper and lower quartile; maximum and minimum values are displayed in whiskers. The middle line shows the median, the cross the mean cfu/cm2. Dots represent 4 technical replicates (leaf discs) in one experiment (biological replicate). Experiment was done 3 times with similar results. Letters indicate statistically significant differences following ANOVA with Tukey’s test (α = 0.05). (B) Ten-day-old seedlings were inoculated with Hpa Emwa1. Sporangiophores per cotyledon were counted at 5 dpi. Cotyledons were classified as supporting no sporulation (0 Sp./cotyledon), light sporulation (1–5 and 6–10), medium sporulation (11–15), or heavy sporulation (>15). Two independent experiments were performed with an average of 100 cotyledons counted per genotype. Two independent experiments were performed with an average of 100 cotyledons counted per genotype. Means of sporangiophores/cotyledon for each genotype are noted below. Standard deviations of means for each genotype are as follows: Col-0 ± 0.77, adr1 triple ± 0.36, nrg1.1 nrg1.2 ± 0.39, helperless ± 0.36, eds1-12 ± 0.13, and rpp4 ± 0.5. Calculations for statistically significant differences following ANOVA with Tukey’s test (α = 0.05) are provided in S1 Data. (D, E) The right leaf half of 6-week-old plants was hand-infiltrated with (D) Pf0-1 AvrRps4 (OD600 = 0.2) or (E) Pst DC3000 AvrRpt2 (OD600 = 0.1). The Typhoon laser scanner was used to detect autofluorescence of dead leaf tissue at indicated time points. Representative leaves shown in a false color scale (black to blue: healthy leaf tissue, orange to white: dead leaf tissue). Numbers indicate the amount of leaves showing HR out of the total number of leaves analyzed. Asterisk in D indicates weak HR. NLRs activated in infection experiments shown in A–E are indicated in parentheses. Underlying numerical data are provided in S1 Data. cfu, colony-forming units; Col-0, Columbia-0; dpi, days post infection; ETI, effector-triggered immunity; Hpa, Hyaloperonospora arabidopsidis; hpi, hours post infection; HR, hypersensitive response; NLR, nucleotide-binding leucine-rich repeat receptor; OD600, optical densitiy at 600 nm; Pf0-1, Pseudomonas fluorescens 0–1; Pst, Pseudomonas syringae pv. tomato; Sp., Sporangiophores.
Fig 3
Fig 3. Unequally redundant and specific functions of RNLs during basal resistance and resistance against a necrotrophic pathogen.
(A, B, C) Six-week-old plants were hand-infiltrated with (A) Pst DC3000 EV (OD600 = 0.001), (B) Pst DC3000 cor- (OD600 = 0.002), or (C) Pst DC3000 ∆hrcC (OD600 = 0.002), and bacterial growth was assessed at 3 dpi. Dots represent 12 data points (3 biological replicates and 4 technical replicates). Box limit represents upper and lower quartile; maximum and minimum values are displayed in whiskers. The middle line shows the median, the cross the mean cfu/cm2. Letters indicate statistically significant differences following ANOVA with Tukey’s test (α = 0.05). (D) 5.5-week-old plants were inoculated with 1 × 10⁶ spores/mL A. brassicicola, and disease symptoms were monitored at 7, 10, and 13 dpi. DIs are shown as mean ± SEM of at least 35 replicates of 2 independent experiments. Letters indicate statistically significant differences at one time point following ANOVA with Tukey’s test (α = 0.05). (E) Pictures of representative leaves inoculated with two 5 μL droplets of A. brassicicola spores were taken 13 dpi. Underlying numerical data are provided in S1 Data. cfu, colony-forming units; DI, disease index; dpi, days post infection; EV, empty vector; hrcC, HR and pathogenicity gene C; OD600, optical density at 600 nm; Pst, Pseudomonas syringae pv. tomato.
Fig 4
Fig 4. Analysis of RNL-dependent and -independent transcriptional changes.
Six-week-old Col-0, adr1 adr1-L1 adr1-L2 (adr1 triple), nrg1.1 nrg1.2, or adr1 adr1-L1 adr1-L2 nrg1.1 nrg1.2 (helperless) plants were hand-infiltrated with Pf0 carrying an EV or expressing AvrRps4, AvrRpm1, or AvrRpt2 (OD600 = 0.2). Samples were collected before treatment and 0.5 hpi, 4 hpi, and 8 hpi. (A) Heatmap showing the normalized expression (z-score) of all the genes differentially regulated in at least one condition (FDR-adjusted p < 0.05, fold change > 2). Transcriptional response corresponding to PTI and all ETIs involve mostly the same genes. The impact of RNLs is clearly visible during RPS4 ETI. (B) Principal component analysis showing the effect of pathogen treatment on gene expression in the different genotypes at time 0 (black circle), 0.5 hpi (green circle), 4 hpi (orange circle), and 8 hpi (red circle). The effects of ETI on gene expression are visible at 4 and 8 hpi but not at 0.5 hpi. Most of the variability observed is explained by time, then by treatment type, and lastly by genotype. (C) Venn diagrams comparing PTI-triggered gene up-regulation in Col-0, adr1 triple, nrg1.1 nrg1.2, and helperless mutants at 0.5 hpi, 4 hpi, and 8 hpi with Pf0-EV. PTI is largely RNL independent. (D) Venn diagrams comparing ETI-specific gene up-regulation in Col-0 and the helperless plants at 4 hpi and 8 hpi with Pf0-AvrRps4, Pf0-AvrRpt2, or Pf0-AvrRpm1. Notably, the vast majority of RPS4-induced gene expression is abolished in the helperless mutant at 4 and 8 hpi, whereas RPS2 or RPM1-induced ETIs are largely RNL independent. Underlying numerical data are provided in S1 Data. Col-0, Columbia-0; ETI, effector-triggered immunity; EV, empty vector; FDR,; hpi, hours post infection; NA, no application/treatment; OD600, optical density at 600 nm; PC1, principal component 1; PC2, principal component 2; Pf0, Pseudomonas fluorescens 0; PTI, pattern-triggered immunity.
Fig 5
Fig 5. RNLs function as classical CNLs.
Comparison of gene up-regulation (A, B) or down-regulation (C, D) across RPS4-, RPS2-, and RPM1-mediated ETIs. (A) and (C) Venn diagrams comparing up-regulated (B) or down-regulated (D) ETI-specific genes showing the extensive overlap between RPS4-, RPS2-, and RPM1-mediated ETIs. RPS4/RRS1 ETI, which reflects the action of RNLs, is very similar to CNL-mediated ETI. The curves in (B) and (D) show the normalized expression of the ETI-regulated gene sets, in Col-0 and helperless plants, across all conditions tested in the experiment. Notably, RPS4/RRS1-regulated genes (blue dots), which require RNLs during Pf0-AvrRps4 infection, are differentially regulated by RPS2 and RPM1 in the absence of RNLs. Similarly, genes differentially regulated by RPM1 and RPS2 are also regulated by RNLs during Pf0-AvrRps4 infections in Col-0, but the up- or down-regulation is weaker. Underlying numerical data are provided in S1 Data. CNL, coiled-coil domain-containing nucleotide-binding leucine-rich repeat receptor; Col-0, Columbia-0; DEG, differentially expressed gene; ETI, effector-triggered immunity; EV, empty vector; hpi, hours post infection; Pf0, Pseudomonas fluorescens 0; RNL, RPW8 CC domain containing NLR.
Fig 6
Fig 6. Proposed model of RNL function in immunity.
Upon an infection of a plant cell by a pathogen, the first (early) response induced is PTI, irrespective of whether it is an avirulent or virulent pathogen. Thus, basal resistance and ETI happen in cells in which PTI signaling was already initiated and in some or the other way counteracted by effectors and other virulence molecules. Therefore, we propose that RNL function in immunity has to be considered as being part of a complex immune response network depicted in this proposed model. (1) Basal resistance (grey arrows) is initiated by the recognition of PAMPs by cell surface-localized PRRs. (2) PRR-triggered responses lead to the accumulation of SA and induction of SA responses, which requires RNLs [14]. (3) Pathogen-derived (virulence) effectors and the JA analog coronatine counteract PRR- and RNL-induced immunity and SA responses, thereby causing the so called (first) ETS. (4) Many pathogens, especially pathogenic bacteria, have effectors that can be recognized by some sensor TNL or CNLs and only induce a “weak remnant” ETI response [7] during basal resistance. This most likely leads to the activation of RNLs and can explain their requirement for basal resistance (see Fig 3). (5) It is possible that the aforementioned “weak” recognition and sensor NLR activation is also targeted by other effectors, causing the second ETS [62]. (6) RNLs are fully required for TNL-mediated immunity (black arrows) with some structural preferences for either ADR1s or NRG1s. After being activated by TNLs, RNLs act as CNLs to trigger strong and lasting defense activation as well as HR. ADR1s and NRG1s seem partially specialized in defense and HR, respectively, although the sub-functionalization is not strict. For example, ADR1s are specifically required for RPP4 signaling, while NRG1s are specifically required for RPS4-induced HR. (7) In addition, RNLs are involved but not required for CNL-triggered defense gene expression and HR (red arrows), further suggesting that RNLs act not directly downstream but in parallel with CNLs. If the sensor CNL is able to trigger a strong ETI by itself, the RNL involvement does not translate into requirement for proper disease resistance (e.g., RPM1 or ZAR1 ETI). Grey arrows indicate basal resistance (and PTI) signaling; black arrows indicate TNL-mediated ETI, and red arrows indicate CNL-mediated ETI signaling. Structural formula of coronatine was downloaded from Wikipedia (https://en.wikipedia.org/wiki/Coronatine). CNL, coiled-coil domain-containing nucleotide-binding leucine-rich repeat receptor; ETI, effector-triggered immunity; ETS, effector-triggered susceptibility; HR, hypersensitive response; JA, jasmonic acid; NLR, nucleotide-binding leucine-rich repeat receptor; PAMP, pathogen-associated molecular pattern; PRR, PAMP recognition receptor; PTI, pattern-triggered immunity; SA, salicylic acid; SAR, systemic acquired resistance; TNL, TIR domain-containing NLR.

References

    1. Dangl JL, Jones JDG. Plant pathogens and integrated defence responses to infection. Nature. 2001;411: 826–833. 10.1038/35081161 - DOI - PubMed
    1. Jones JDG, Dangl JL. The plant immune system. Nature. 2006;444: 323–329. 10.1038/nature05286 - DOI - PubMed
    1. Wan WL, Fröhlich K, Pruitt RN, Nürnberger T, Zhang L. Plant cell surface immune receptor complex signaling. Curr Opin Plant Biol. 2019;50: 18–28. 10.1016/j.pbi.2019.02.001 - DOI - PubMed
    1. Albert I, Hua C, Nurnberger T, Pruitt R, Zhang L. Surface sensor systems in plant immunity. Plant Physiol. 2019; pp.012992019. 10.1104/pp.19.01299 - DOI - PMC - PubMed
    1. Boller T, Felix G. A Renaissance of Elicitors: Perception of Microbe-Associated Molecular Patterns and Danger Signals by Pattern-Recognition Receptors. Annu Rev Plant Biol. Annual Reviews; 2009;60: 379–406. 10.1146/annurev.arplant.57.032905.105346 - DOI - PubMed

Publication types

MeSH terms

Substances