. 2020 Sep 14;16(9):e1009018.
doi: 10.1371/journal.pgen.1009018. eCollection 2020 Sep.

The causal effect of obesity on prediabetes and insulin resistance reveals the important role of adipose tissue in insulin resistance

Affiliations

The causal effect of obesity on prediabetes and insulin resistance reveals the important role of adipose tissue in insulin resistance

Zong Miao et al. PLoS Genet. .

Abstract

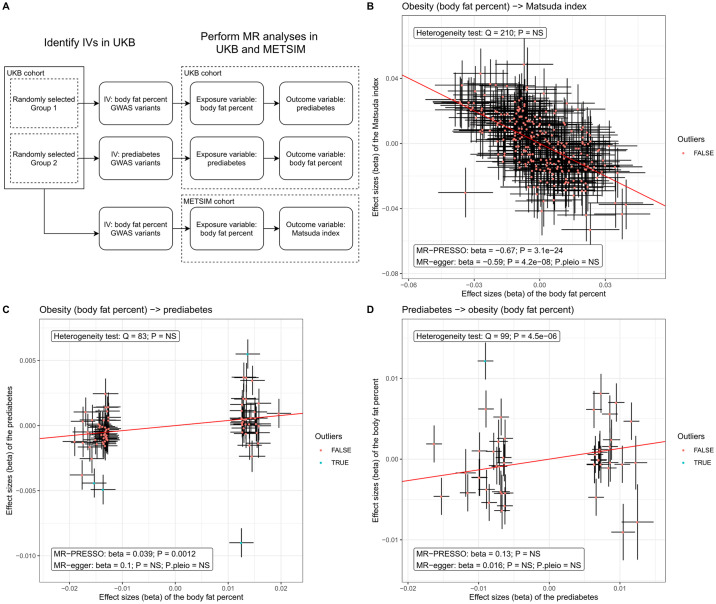
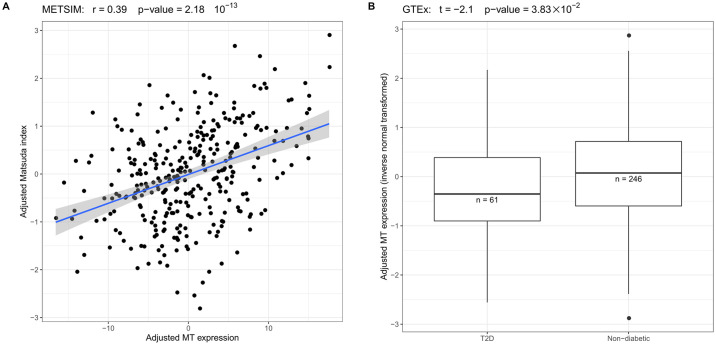
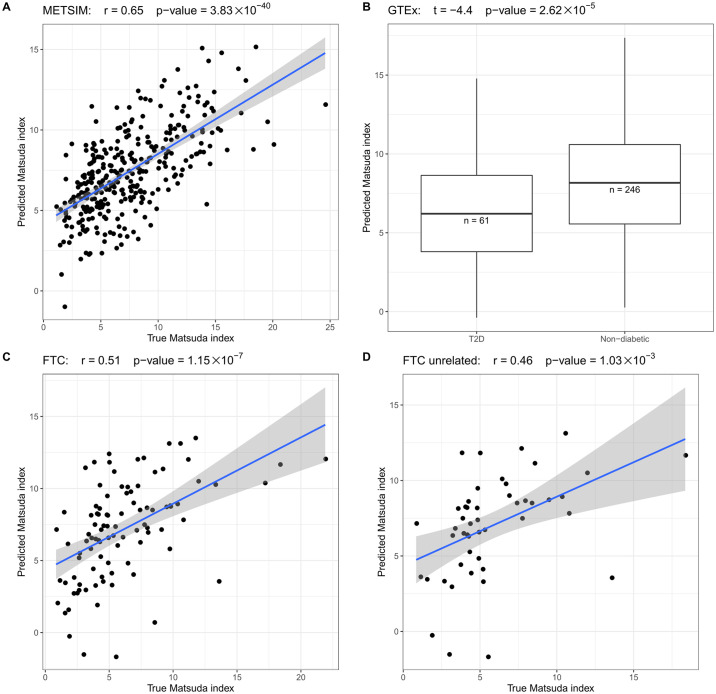
Reverse causality has made it difficult to establish the causal directions between obesity and prediabetes and obesity and insulin resistance. To disentangle whether obesity causally drives prediabetes and insulin resistance already in non-diabetic individuals, we utilized the UK Biobank and METSIM cohort to perform a Mendelian randomization (MR) analyses in the non-diabetic individuals. Our results suggest that both prediabetes and systemic insulin resistance are caused by obesity (p = 1.2×10⁻³ and p = 3.1×10⁻²⁴). As obesity reflects the amount of body fat, we next studied how adipose tissue affects insulin resistance. We performed both bulk RNA-sequencing and single nucleus RNA sequencing on frozen human subcutaneous adipose biopsies to assess adipose cell-type heterogeneity and mitochondrial (MT) gene expression in insulin resistance. We discovered that the adipose MT gene expression and body fat percent are both independently associated with insulin resistance (p≤0.05 for each) when adjusting for the decomposed adipose cell-type proportions. Next, we showed that these 3 factors, adipose MT gene expression, body fat percent, and adipose cell types, explain a substantial amount (44.39%) of variance in insulin resistance and can be used to predict it (p≤2.64×10⁻⁵ in 3 independent human cohorts). In summary, we demonstrated that obesity is a strong determinant of both prediabetes and insulin resistance, and discovered that individuals' adipose cell-type composition, adipose MT gene expression, and body fat percent predict their insulin resistance, emphasizing the critical role of adipose tissue in systemic insulin resistance.


Conflict of interest statement

The authors have declared that no competing interests exist.

Figures

Fig 1
Fig 1. MR analysis shows the causal relationship of body fat percent on prediabetes and Matsuda index, i.e. obesity leads to insulin resistance.
(A) Workflow of our MR analysis in UKB and METSIM cohorts. (B) The variant effect sizes on the exposure (i.e. body fat percent) are associated with the variant effect sizes on the outcome (i.e. the Matsuda index). The slope indicates the estimated causal effect of the exposure on the outcome. The label boxes showed the MR results after MR-PRESSO adjusted for potential pleiotropy. P.pleio indicates the p-value of pleiotropy identified by MR-egger. The IVs are significant body fat percent GWAS variants in UKB (see the Methods for details). (C) A two-sample MR analyses show the causal effect of obesity (i.e. body fat percent) on prediabetes in UKB cohort. The IVs are significant prediabetes GWAS variants in UKB (see the Methods for details). (D) A two-sample MR analysis did not identify the causal effect of prediabetes on obesity (i.e. body fat percent). The p-values of the causal effects from MR-PRESSO and MR-egger were adjusted for 3 tests using a Bonferroni correction. To keep a stringent control of the potential pleiotropy, the other p-values (Heterogeneity test and P.pleio) were not adjusted for multiple testing. NS indicates a non-significant p-value (p-value > 0.05). The IVs are significant body fat percent GWAS variants in UKB (see the Methods for details).
Fig 2
Fig 2. A low adipose MT gene expression is associated with insulin resistance.
(A) In METSIM, the adjusted adipose MT gene expression is significantly associated with the adjusted Matsuda index. (B) In GTEx, the non-diabetic individuals have significantly higher adjusted MT gene expression (inverse normal transformed) than the T2D patients.
Fig 3
Fig 3. Analysis of sn-RNA-seq data reveals tissue heterogeneity in human subcutaneous adipose tissue.
(A) We identified 8 cell-type clusters in 15,623 nuclei from frozen human adipose tissue from 6 Finnish individuals. The t-SNP plot is colored by the identified cell types. (B) Using sn-RNA-seq as reference, the estimated adipose cell-type proportions from bulk adipose RNA-seq data are well concordant with the true cell-type proportions.
Fig 4
Fig 4. The predicted Matsuda index is well concordant with the true Matsuda index values in 3 different cohorts: METSIM, GTEx, and FTC.
(A) In METSIM, the estimated and true Matsuda index are significantly associated. (B) In GTEx, the predicted Matsuda index is significantly higher in non-diabetic individuals when compared to the T2D patients. (C) In FTC, the estimated and true Matsuda index are significantly associated. (D) We randomly choose one individual from each twin pair to select the unrelated individuals from FTC. Among the unrelated individuals, the estimated and true Matsuda index are also significantly associated, indicating that the twin status did not bias the prediction of the Matsuda index.

References

    1. Poirier P, Giles TD, Bray GA, Hong Y, Stern JS, Pi-Sunyer FX, et al. Obesity and cardiovascular disease: Pathophysiology, evaluation, and effect of weight loss. Circulation. 2006;113(6):898–918. 10.1161/CIRCULATIONAHA.106.171016 - DOI - PubMed
    1. Zamora-Mendoza R, Rosas-Vargas H, Ramos-Cervantes MT, Garcia-Zuniga P, Perez-Lorenzana H, Mendoza-Lorenzo P, et al. Dysregulation of mitochondrial function and biogenesis modulators in adipose tissue of obese children. Int J Obes. 2018;42(4):618–24. 10.1038/ijo.2017.274 - DOI - PubMed
    1. Martinez KE, Tucker LA, Bailey BW, LeCheminant JD. Expanded normal weight obesity and insulin resistance in US adults of the national health and nutrition examination survey. J Diabetes Res. 2017;2017 10.1155/2017/9502643 - DOI - PMC - PubMed
    1. Chung JO, Cho DH, Chung DJ, Chung MY. Associations among Body Mass Index, Insulin Resistance, and Pancreatic β-Cell Function in Korean Patients with New-Onset Type 2 Diabetes FAU—Chung, Jin Ook FAU Cho, Dong Hyeok FAU—Chung, Dong Jin FAU—Chung, Min Young. Korean J Intern Med. 2012;27(1):66–71. 10.3904/kjim.2012.27.1.66 - DOI - PMC - PubMed
    1. Meah FA, DiMeglio LA, Greenbaum CJ, Blum JS, Sosenko JM, Pugliese A, et al. The relationship between BMI and insulin resistance and progression from single to multiple autoantibody positivity and type 1 diabetes among TrialNet Pathway to Prevention participants. Diabetologia. 2016;59(6):1186–95. 10.1007/s00125-016-3924-5 - DOI - PMC - PubMed

Publication types