. 2020 Dec 7;217(12):e20201129.
doi: 10.1084/jem.20201129.

SARS-CoV-2-triggered neutrophil extracellular traps mediate COVID-19 pathology

Affiliations

SARS-CoV-2-triggered neutrophil extracellular traps mediate COVID-19 pathology

Flavio Protasio Veras et al. J Exp Med. .

Abstract

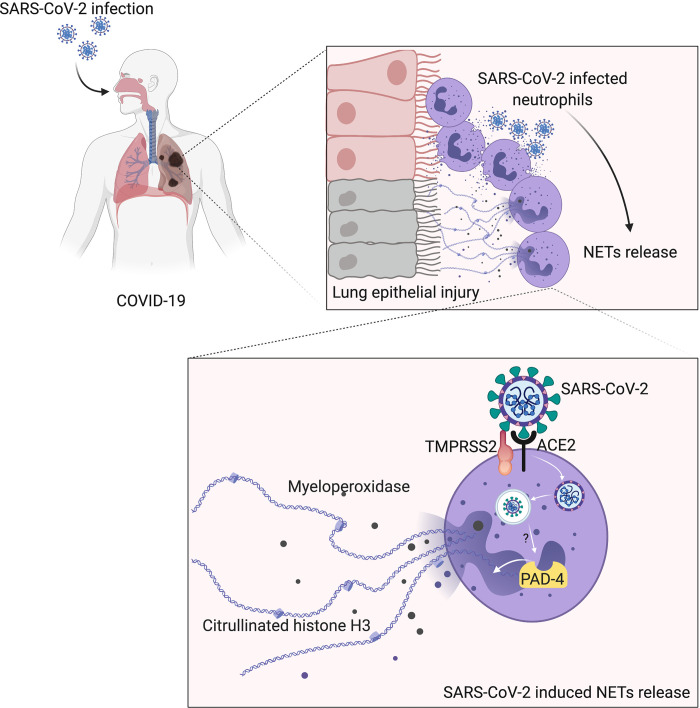
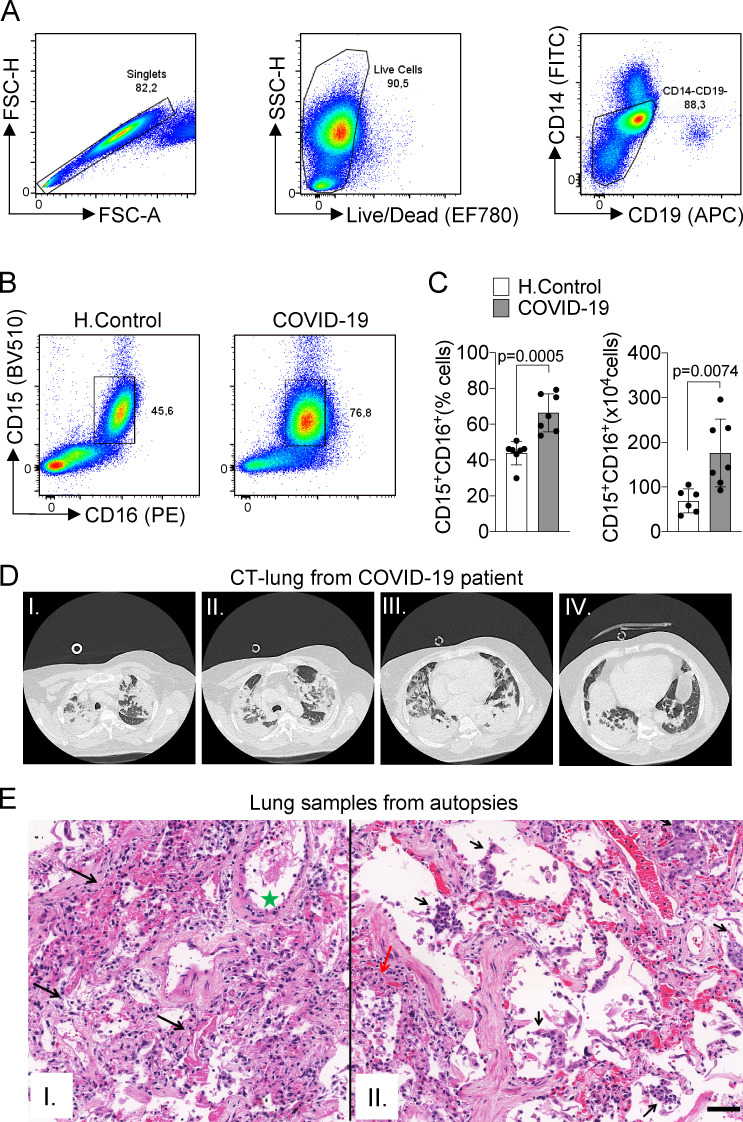
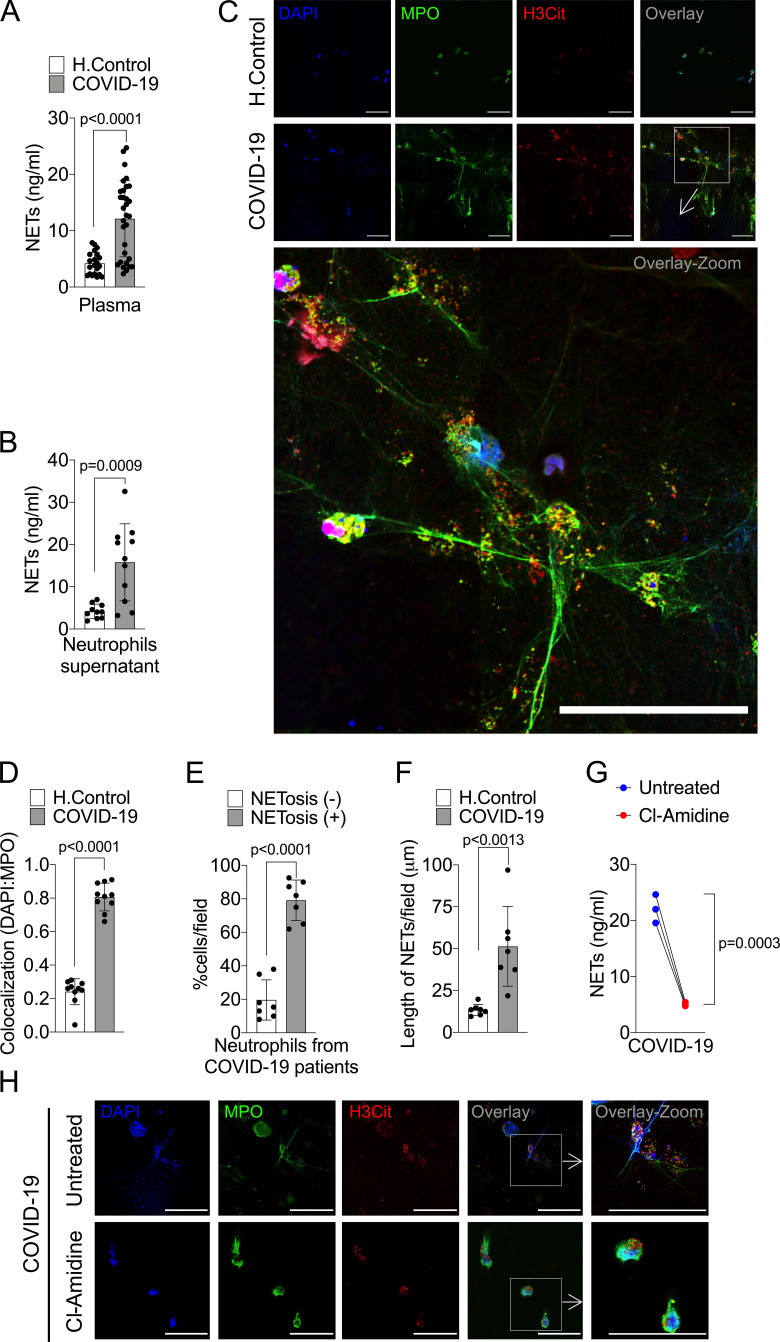
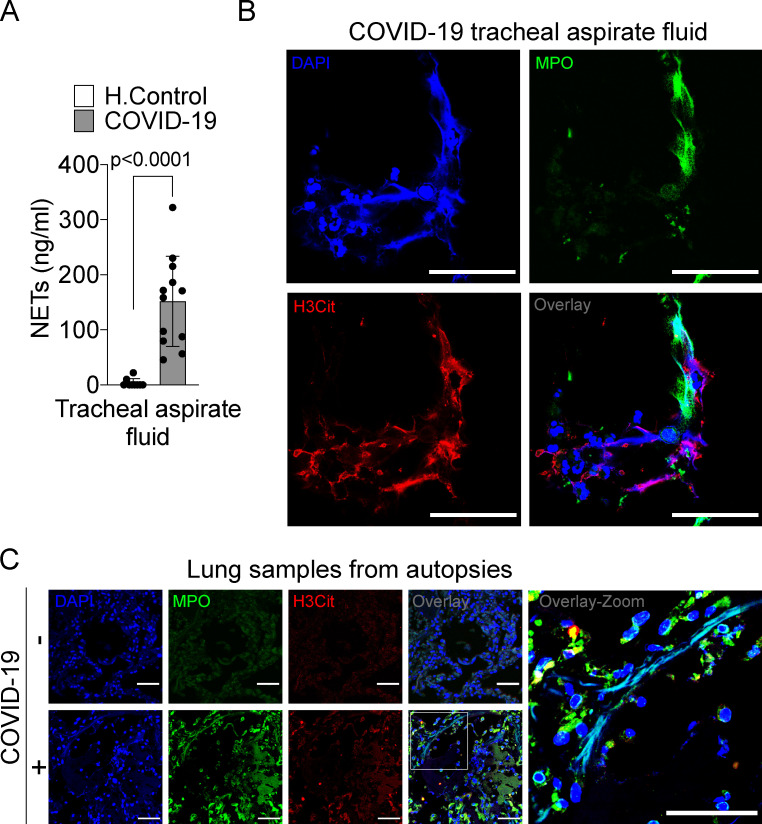
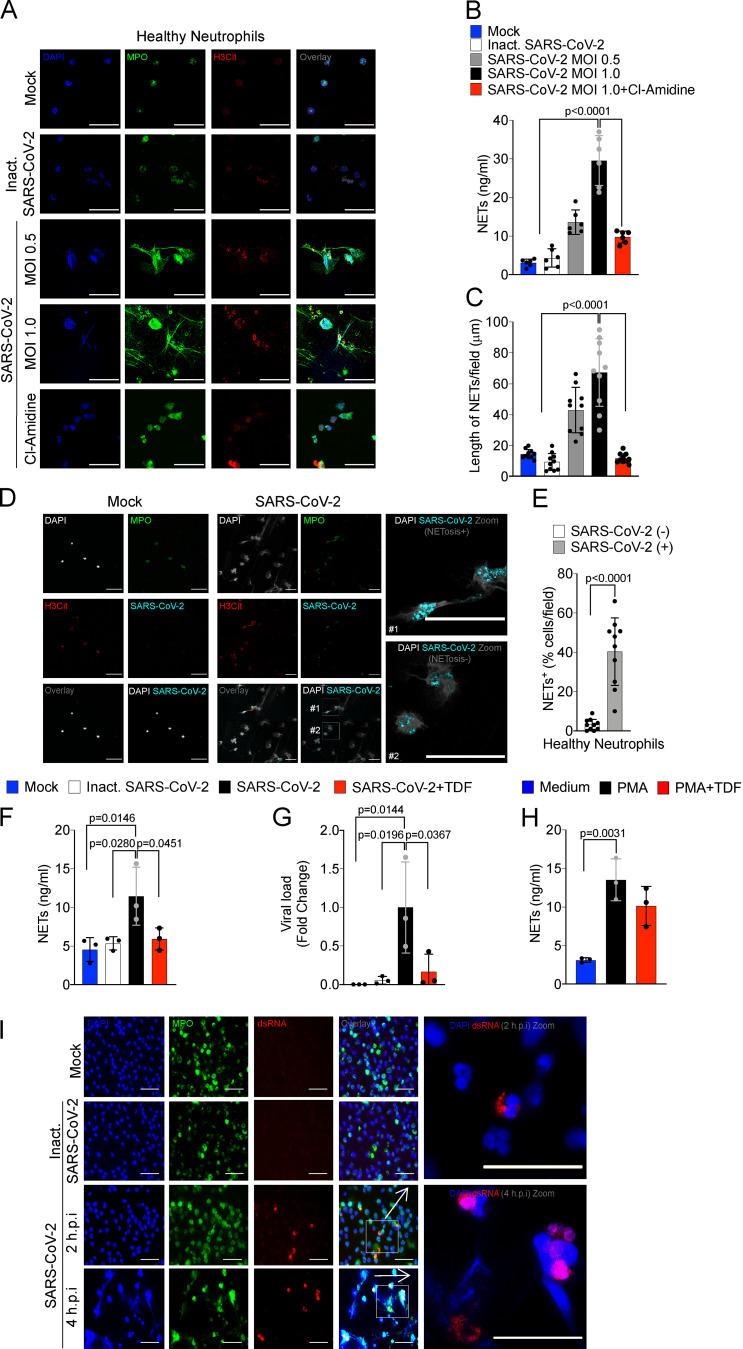
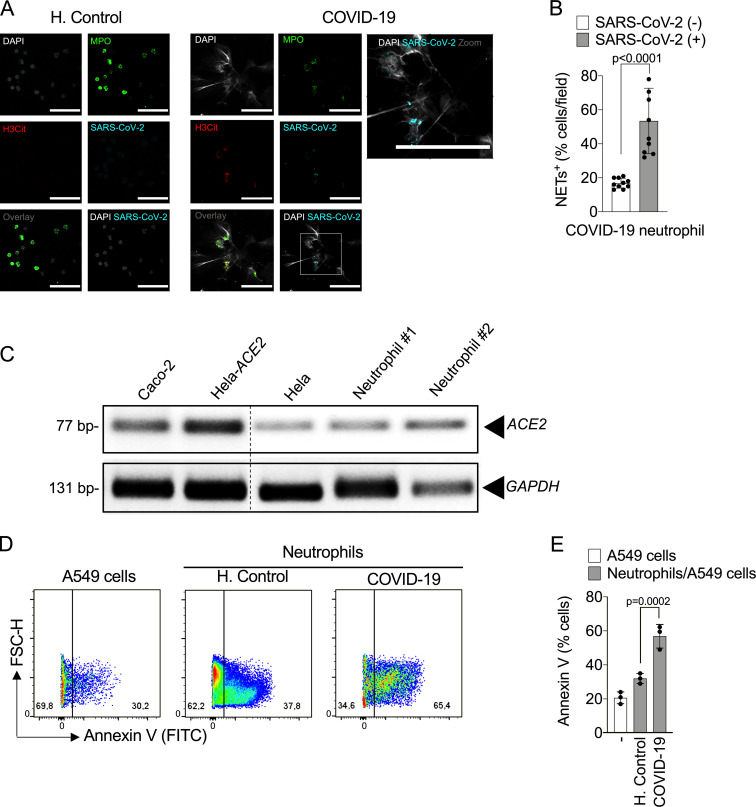
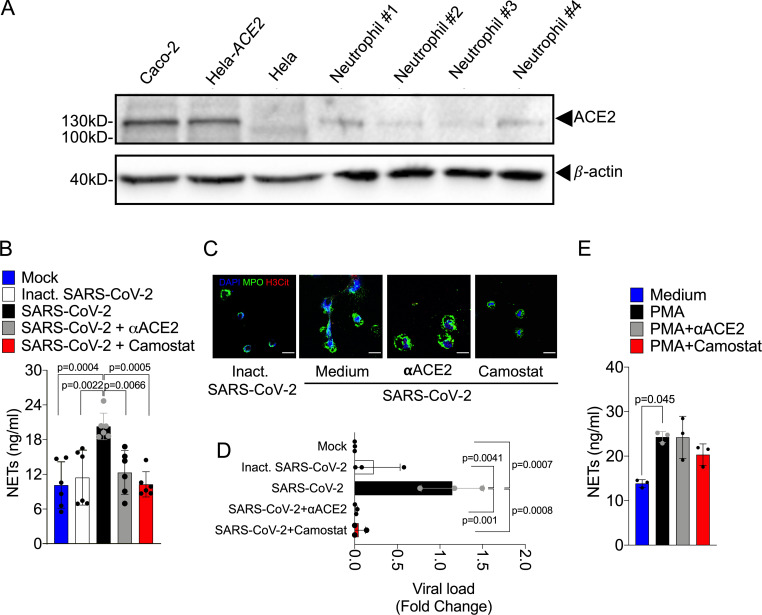
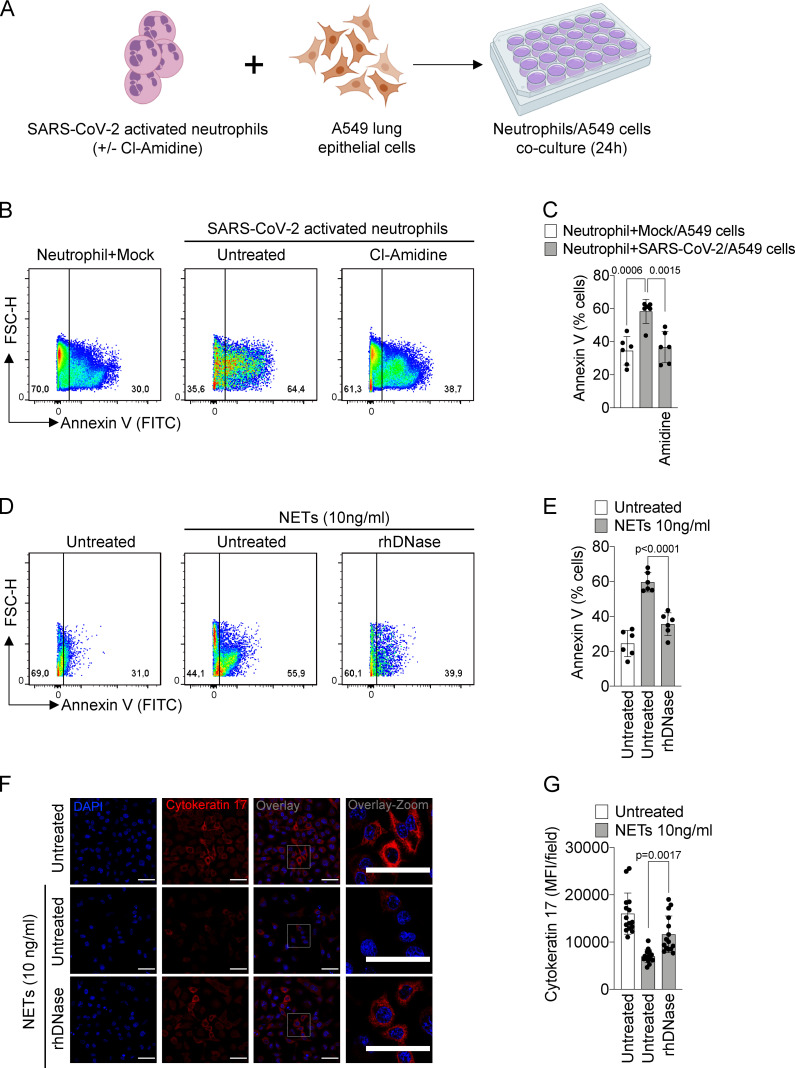
Severe COVID-19 patients develop acute respiratory distress syndrome that may progress to cytokine storm syndrome, organ dysfunction, and death. Considering that neutrophil extracellular traps (NETs) have been described as important mediators of tissue damage in inflammatory diseases, we investigated whether NETs would be involved in COVID-19 pathophysiology. A cohort of 32 hospitalized patients with a confirmed diagnosis of COVID-19 and healthy controls were enrolled. The concentration of NETs was augmented in plasma, tracheal aspirate, and lung autopsies tissues from COVID-19 patients, and their neutrophils released higher levels of NETs. Notably, we found that viable SARS-CoV-2 can directly induce the release of NETs by healthy neutrophils. Mechanistically, NETs triggered by SARS-CoV-2 depend on angiotensin-converting enzyme 2, serine protease, virus replication, and PAD-4. Finally, NETs released by SARS-CoV-2-activated neutrophils promote lung epithelial cell death in vitro. These results unravel a possible detrimental role of NETs in the pathophysiology of COVID-19. Therefore, the inhibition of NETs represents a potential therapeutic target for COVID-19.


Conflict of interest statement

Disclosures: The authors declare no competing interests exist.

Figures

None
Graphical abstract
Figure S1.
Figure S1.
Immunopathological characteristics of COVID-19 patients. (A) Doublet cells were excluded by forward scatter height (FSC-H) and forward scatter area (FSC-A) gating for all flow cytometry analysis. Viable cells were identified using fixable viability stain and side scatter area (SSC-A) gating. Neutrophils were identified as cells stained for CD15+CD16+ among CD14CD19 cells. (B) Flow cytometry analyses of living cells from the whole blood of healthy controls (H.Control) or COVID-19 patients. (C) Frequency and absolute numbers of CD15+CD16+ neutrophils gated on CD14CD19 live cells from whole blood from healthy controls (n = 7) or COVID-19 patients (n = 7). (D) CT of the chest of one patient who died from COVID-19. Images from apical to basal segments (I to IV) show multiple consolidations with air bronchograms in a peripheral and peribronchovascular distribution, more evident in the lower lobes, associated with ground-glass opacities. (E) Representative pulmonary histological findings in 10 cases, autopsied by ultrasound-guided, minimally invasive autopsy. I: The area with interstitial and alveolar neutrophilic pneumonia with diffuse alveolar damage and hyaline membranes in the alveolar space (black arrows). Septal vessel with margination of leukocytes and an intraluminal early fibrin thrombus (green star). II: Area with neutrophilic pneumonia (red arrow), septal thickening, epithelial desquamation, and squamous metaplasia (black arrows). I and II: H&E. Scale bar indicates 50 µm. Data are representative of at least two independent experiments one experiment and are shown as mean ± SEM. P value was determined by two-tailed unpaired Student t test (C).
Figure 1.
Figure 1.
COVID-19 patients produces high concentrations of NETs. Plasma and neutrophils were isolated from healthy controls and COVID-19 patients. (A) NET quantification by MPO-DNA PicoGreen assay in plasma from healthy controls (H.Control; n = 21) or COVID-19 patients (n = 32). (B) Supernatants from cultures of blood isolated neutrophils from healthy controls (n = 10) or COVID-19 patients (n = 11). NET quantification was performed using MPO-DNA PicoGreen assay. (C) Representative confocal analysis of NETs release by neutrophils isolated from healthy controls (n = 10) or COVID-19 patients (n = 11), cultured for 4 h at 37°C. Cells were stained for nuclei (DAPI, blue), MPO (green), and H3Cit (red). Scale bar indicates 50 µm. (D) Colocalization of DAPI and MPO between healthy controls (n = 10) and COVID-19 (n = 10). The data depicts Pearson’s correlation coefficient assessed by Fiji/ImageJ software. (E) Percentage of NETosis in neutrophil from COVID-19 patients (n = 7). (F) NET length quantification. (G) NET quantification by MPO-DNA PicoGreen assay in the supernatants of blood-isolated neutrophils from COVID-19 patients (n = 3) preincubated, or not, with PAD-4 inhibitor (Cl-Amidine; 200 µM) for 4 h at 37°C. (H) Representative confocal images showing the presence of NETs in isolated neutrophils from COVID-19 patients, treated or not, with Cl-Amidine (200 µM). Cells were stained for nuclei (DAPI, blue), MPO (green), and H3Cit (red). Scale bar indicates 50 µm. Data are representative of at least two independent experiments and are shown as mean ± SEM. P value were determined by two-tailed unpaired (A, B, and D–F) or paired (G) Student t test.
Figure 2.
Figure 2.
NET release in the lungs of COVID-19 patients. (A) NET quantification by MPO-DNA PicoGreen assay in the tracheal aspirate from COVID-19 patients (n = 12) and in saline-induced airway fluids from healthy control (H.Control; n = 9). (B) Representative confocal analysis of NETs in neutrophil from the tracheal aspirate of COVID-19 patients (n = 5). Cells were stained for nuclei (DAPI, blue), MPO (green), and H3Cit (red). Scale bar indicates 50 µm. (C) Representative confocal images of the presence of NETs in the lung tissue from autopsies of negative controls (n = 3) or COVID-19 (n = 6) patients. Cells were stained for nuclei (DAPI, blue), MPO (green), and H3Cit (red). Scale bar indicates 50 µm. Data are representative of at least two independent experiments and are shown as mean ± SEM. P value was determined by two-tailed unpaired Student t test (A).
Figure 3.
Figure 3.
SARS-CoV-2 induces the release of NETs by healthy neutrophils. Neutrophils were isolated from healthy controls and incubated with Mock, inactivated SARS-CoV-2, or SARS-CoV-2 (MOI = 0.5 or 1.0). One group of cells incubated with SARS-CoV-2 MOI = 1.0 was pretreated with a PAD-4 inhibitor (Cl-Amidine, 200 µM). (A) Representative images of NET release. Cells were stained for nuclei (DAPI, blue), MPO (green), and H3Cit (red). Scale bar indicates 50 µm. (B and C) NET quantification by MPO-DNA PicoGreen assay (B) and quantification of NETs length in these neutrophils supernatants (C; n = 6). (D) Representative images showing immunostaining for nuclei (DAPI, white), MPO (green), H3Cit (red), and SARS-CoV-2 (cyan) in neutrophils incubated with Mock or SARS-CoV-2 (MOI = 1.0). Scale bar indicates 50 µm. (E) Percentage of NETs positive cells stained, or not, for SARS-CoV-2 antigens (10 fields were analyzed). SARS-CoV-2–infected neutrophils (MOI = 1.0, n = 3) were pretreated with 10 µM TDF, an RNA polymerase inhibitor. (F and G) NETs quantification by MPO-DNA PicoGreen assay (F) and SARS-CoV-2 viral load detection in neutrophil cell pellet by RT-PCR, 4 h after infection (G). Fold change relative to SARS-CoV-2 group was used. (H) Neutrophils from healthy controls (n = 3) were stimulated with PMA pretreated or not with 10 µM TDF. NET quantification was assessed by MPO-DNA PicoGreen assay in neutrophil supernatants after 4 h incubation. (I) Detection of replication by immunostaining for dsRNA (red) 2 and 4 h after infection. Nuclei (DAPI, blue) and MPO (green) were used as control of neutrophil staining. Scale bar indicates 50 µm. Data are representative of at least two independent experiments and are shown as mean ± SEM. P values were determined by one-way ANOVA followed by Bonferroni’s post hoc test (B, C, and E–H).
Figure S2.
Figure S2.
Infected neutrophils from COVID-19 patients induce apoptosis in lung epithelial cells. (A) Representative confocal images showing the detection of SARS-CoV-2 antigens in blood neutrophils from COVID-19 patients (n = 5), but not in neutrophils from healthy controls (H.Control; n = 5). Cells were stained for nuclei (DAPI, white), MPO (green), H3Cit (red), and SARS-CoV-2 (Cyan). Scale bar indicates 50 µm. (B) Percentage of NET-positive cells stained, or not, for SARS-CoV-2 antigens. Blood-isolated neutrophils (106 cells) from healthy controls (n = 3) or COVID-19 patients (n = 3) were co-cultured with A549 lung epithelial cells (5 × 10⁴ cells) for 24 h at 37°C. (C) Expression of ACE2 was assessed by conventional PCR (C) in Caco-2, HeLa cells transduced with hACE2 (Hela-ACE2), HeLa cells, and isolated neutrophils from healthy controls. GAPDH expression was used as load control for gene expression. The samples were run on the same gel and the dotted line represents unrelated lanes. (D) Representative dot plots of FACS analysis for A549 Annexin V+ cells. (E) Frequency of Annexin V+ A549 cells. Data are representative of at least two independent experiments and are shown as mean ± SEM. P values were determined by two-tailed unpaired Student t test (two fields/patient; B) or one-way ANOVA followed by Bonferroni’s post hoc test (E).
Figure 4.
Figure 4.
SARS-CoV-2 infection in neutrophils depends on ACE2 and serine protease TMPRSS2 pathway for the NETs formation. (A) Expression of ACE2 was assessed by Western blot (A) in Caco-2, HeLa cells transduced with hACE2 (Hela-ACE2), HeLa cells, and isolated neutrophils from healthy controls. β-Actin expression was used as load control for protein expression. SARS-CoV-2–infected neutrophils (MOI = 1.0) were pretreated with neutralizing anti-ACE2 antibody (αACE2, 0.5 µg/ml) and camostat (10 µM), a serine protease TMPRSS2 inhibitor. (B) NETs quantification by MPO-DNA PicoGreen assay in these neutrophils supernatants (n = 6). (C) Immunostaining for nuclei (DAPI, blue), MPO (green), and H3Cit (red). Scale bar indicates 50 µm. (D) SARS-CoV-2 viral load detection in neutrophil cell pellet (n = 3) by RT-PCR 4 h after infection. Fold change relative to SARS-CoV-2 group. (E) PMA-stimulated neutrophils from healthy controls (n = 3) were pretreated or not with 0.5 µg/ml αACE2 and 10 µM camostat. NET quantification was assessed by MPO-DNA PicoGreen assay in neutrophils supernatants after 4 h of PMA stimulation. Data are representative of at least two independent experiments and are shown as mean ± SEM. P values were determined by one-way ANOVA followed by Bonferroni’s post hoc test (B, D, and E).
Figure 5.
Figure 5.
NETs induce the apoptosis of lung epithelial cells. (A) Blood isolated neutrophils (106 cells) from healthy donors, pretreated, or not, with Cl-Amidine (200 µM) were incubated, or not, with viable SARS-CoV-2 (n = 6). Created with BioRender.com. After 1 h, these neutrophils were co-cultured with A549 lung epithelial cells (5 × 10⁴ cells) for 24 h at 37°C. (B) Representative dot plots of FACS analysis for Annexin V+ cells. (C) Frequency of Annexin V+ A549 cells. (D) NETs were purified from healthy neutrophils stimulated with PMA (50 nM) for 4 h at 37°C. Representative dot plots of FACS analysis of Annexin V+ A549 cells incubated with purified NETs (10 ng/ml) pretreated, or not, with rhDNase (0.5 mg/ml) for 24 h at 37°C. (E) Frequency of Annexin V+ A549 cells. (F) Immunofluorescence analysis of cytokeratin-17 expression in A549 cells incubated for 24 h with purified NETs (10 ng/ml). Cells were stained for nuclei (DAPI, blue) and cytokeratin-17 (red), an epithelial marker. Scale bar indicates 50 µm. (G) Quantification of mean fluorescence intensity (MFI) of cytokeratin-17 in A549 cells (15 fields/group). Data are representative of at least two independent experiments and are shown as mean ± SEM. P values were determined by one-way ANOVA followed by Bonferroni’s post hoc test (C, E, and G).
Figure S3.
Figure S3.
Immunostaining in SARS-CoV-2–infected neutrophils. Neutrophils from healthy donors (n = 3) were incubated with Mock or SARS-CoV-2 (MOI = 1.0) for 4 h. (A) Cells were stained for nuclei (DAPI, white), donkey anti-rabbit IgG AlexaFluor 488 (green), donkey anti-mouse IgG AlexaFluor 647 (red), and anti-human IgG biotin–conjugated incubated with tyramine Cy3 (cyan). Scale bar indicates 50 µm. (B) Representative confocal images showing the presence of NETs in isolated neutrophils stained for nuclei (DAPI, white), MPO (green), and H3Cit (red). Pre-immune serum from healthy donor was used with control of SARS-CoV-2 staining (cyan). Scale bar indicates 50 µm.

Similar articles

Cited by

References

    1. Altrichter J., Zedler S., Kraft R., Faist E., Mitzner S.R., Sauer M., Windolf J., Scholz M., and Lögters T.. 2010. Neutrophil-derived circulating free DNA (cf-DNA/NETs), a potential prognostic marker for mortality in patients with severe burn injury. Eur. J. Trauma Emerg. Surg. 36:551–557. 10.1007/s00068-010-0013-1 - DOI - PubMed
    1. Beigel J.H., Tomashek K.M., Dodd L.E., Mehta A.K., Zingman B.S., Kalil A.C., Hohmann E., Chu H.Y., Luetkemeyer A., Kline S., et al. ; ACTT-1 Study Group Members . 2020. Remdesivir for the Treatment of Covid-19 - Preliminary Report. N. Engl. J. Med. NEJMoa2007764 10.1056/NEJMoa2007764 - DOI - PMC - PubMed
    1. Brinkmann V., Reichard U., Goosmann C., Fauler B., Uhlemann Y., Weiss D.S., Weinrauch Y., and Zychlinsky A.. 2004. Neutrophil extracellular traps kill bacteria. Science. 303:1532–1535. 10.1126/science.1092385 - DOI - PubMed
    1. Chen T., Wu D., Chen H., Yan W., Yang D., Chen G., Ma K., Xu D., Yu H., Wang H., et al. . 2020. Clinical characteristics of 113 deceased patients with coronavirus disease 2019: retrospective study. BMJ. 368:m1091 10.1136/bmj.m1091 - DOI - PMC - PubMed
    1. Clark S.R., Ma A.C., Tavener S.A., McDonald B., Goodarzi Z., Kelly M.M., Patel K.D., Chakrabarti S., McAvoy E., Sinclair G.D., et al. . 2007. Platelet TLR4 activates neutrophil extracellular traps to ensnare bacteria in septic blood. Nat. Med. 13:463–469. 10.1038/nm1565 - DOI - PubMed

Publication types

MeSH terms