. 2021 May 20;223(9):1650-1658.
doi: 10.1093/infdis/jiaa577.

Temporal Dysbiosis of Infant Nasal Microbiota Relative to Respiratory Syncytial Virus Infection

Affiliations

Temporal Dysbiosis of Infant Nasal Microbiota Relative to Respiratory Syncytial Virus Infection

Alex Grier et al. J Infect Dis. .

Abstract

Background: Respiratory syncytial virus (RSV) is a leading cause of infant respiratory disease. Infant airway microbiota has been associated with respiratory disease risk and severity. The extent to which interactions between RSV and microbiota occur in the airway, and their impact on respiratory disease susceptibility and severity, are unknown.

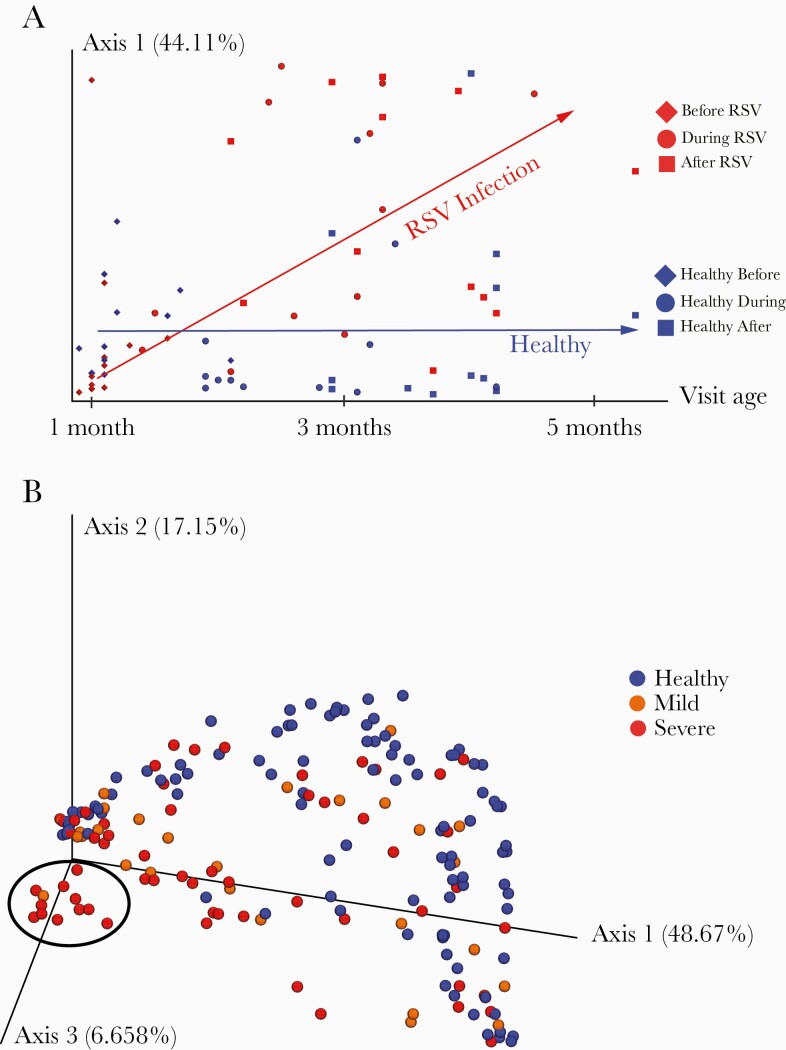
Methods: We carried out 16S rRNA microbiota profiling of infants in the first year of life from (1) a cross-sectional cohort of 89 RSV-infected infants sampled during illness and 102 matched healthy controls, and (2) a matched longitudinal cohort of 12 infants who developed RSV infection and 12 who did not, sampled before, during, and after infection.

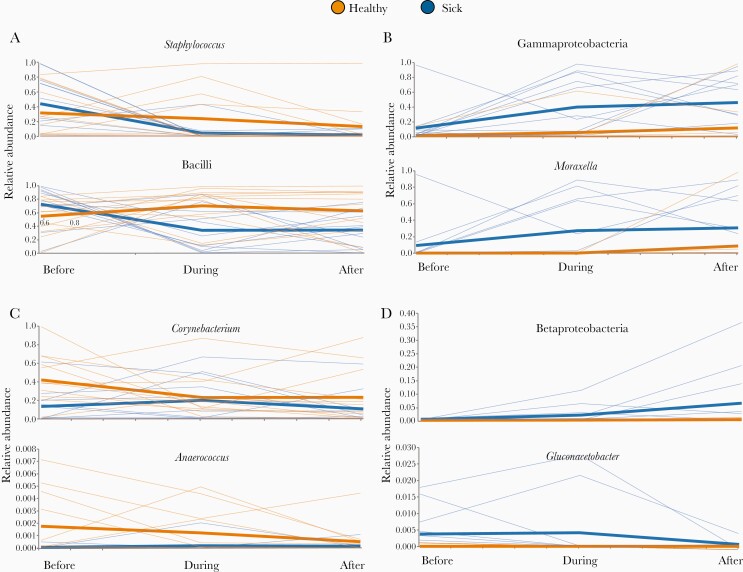
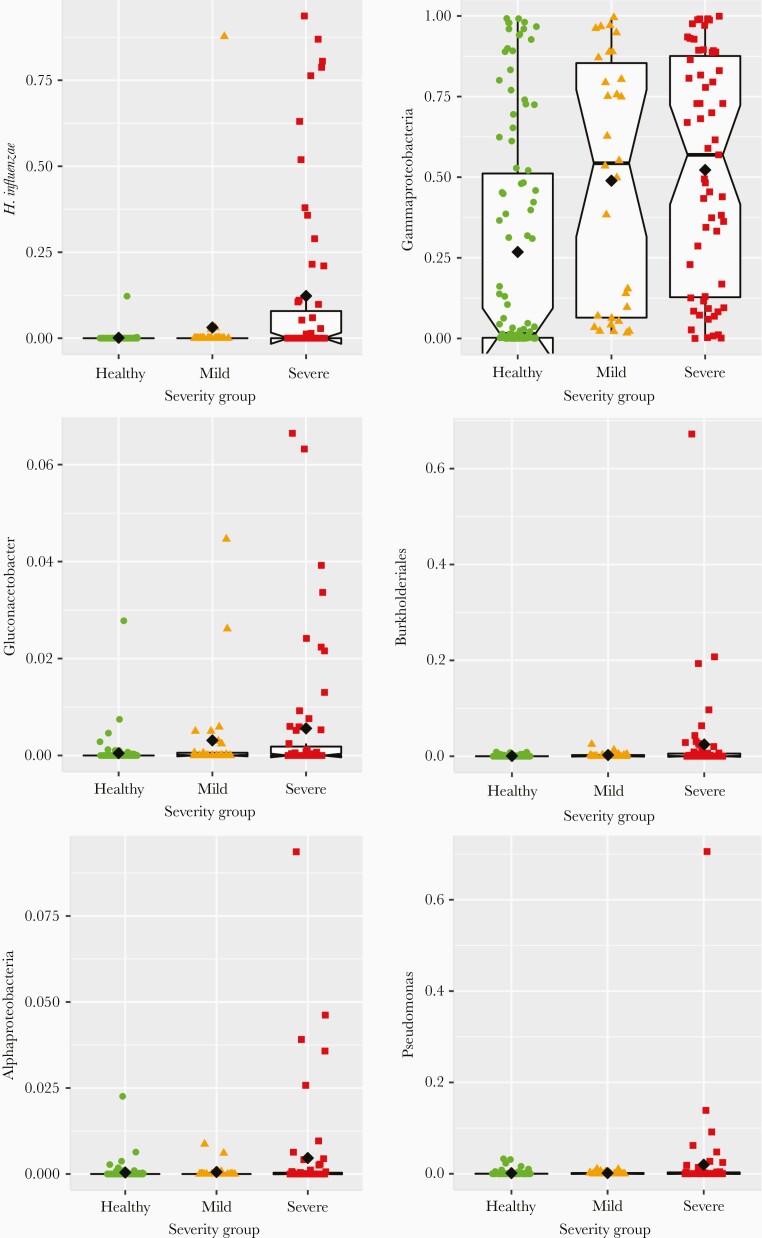
Results: We identified 12 taxa significantly associated with RSV infection. All 12 taxa were differentially abundant during infection, with 8 associated with disease severity. Nasal microbiota composition was more discriminative of healthy vs infected than of disease severity.

Conclusions: Our findings elucidate the chronology of nasal microbiota dysbiosis and suggest an altered developmental trajectory associated with RSV infection. Microbial temporal dynamics reveal indicators of disease risk, correlates of illness and severity, and impact of RSV infection on microbiota composition.

Keywords: microbiota; RSV; infant respiratory disease.


Figures

Figure 1.
Figure 1.
Principal coordinate analysis (PCoA) of weighted UniFrac distances was used to visualize relationships between the nasal microbiota of infants with respect to respiratory syncytial virus (RSV) infection, illness severity, and time. Weighted UniFrac distances quantify the compositional dissimilarity between microbial communities, incorporating information about the phylogenetic relatedness between bacteria observed across samples. PCoA provides a summary representation of overall similarity/dissimilarity relationships among a set of samples, capturing as much information as possible using the fewest number of dimensions/principal coordinates. The proportion of overall variation represented along a single axis is indicated as a percentage in the axis label. A, From the longitudinal cohort only, samples are plotted with principal coordinate 1 on the y-axis and infant age at the time of sampling on the x-axis. Samples are colored red or blue based on whether or not an infant developed RSV infection (red) at any point during the period of observation, and their shape indicates the time-point at which the sample was taken: initial healthy/preillness visit (diamond), illness visit/age-matched healthy visit (circle), or postillness/age-matched final healthy visit (square). The red and blue arrows indicate observed longitudinal trends within the group of subjects that developed RSV infections and the group that stayed healthy, respectively. B, From the cross-sectional cohort only, samples are plotted in 3 dimensions using the first 3 principal coordinates. Samples are colored according to RSV infection status and severity: healthy (blue), mild RSV infection (orange), or severe RSV infection (red). A cluster of subjects in the foreground on the left, notable for dominant abundance of Haemophilus influenzae, is circled in black. While no clear segregation is observed between mild and severe illness, healthy samples occupy a notable crescent shaped structure around the illness samples, with the H. influenzae dominated cluster furthest away from this crescent.
Figure 2.
Figure 2.
Relative abundances (y-axes) of select taxa at all 3 time points (x-axes) in the longitudinal cohort. Each thin line corresponds to the abundance of a given taxon in a particular individual, while the thick lines show the mean abundance of each group at each time point. Members of the healthy group are orange and members of the group that developed infection are blue. Significant taxa were grouped based on different temporal patterns of abundance with respect to illness, and each panel contains examples from a different group: (A) similar abundance between infection and healthy groups prior to illness, but decreased during and after illness in subjects that become infected; (B) consistently elevated in the illness group; (C) elevated in the healthy group before and during illness, but not after; and (D) idiosyncratic temporal dynamics observed in each taxon. Of the members of the fourth group shown here, Betaproteobacteria is nearly absent from all subjects at the preillness time point, and then becomes increasingly abundant during and after illness in the infection group while remaining nearly absent from the healthy group. Gluconacetobacter is elevated in the infection group prior to and during illness, and substantially diminishes in abundance with convalescence.
Figure 3.
Figure 3.
Relative abundances (y-axes) of select taxa significantly associated with more severe disease in the cross-sectional cohort, with samples grouped by dichotomizing illness based on severity into mild and severe groups (x-axes), using a severity score threshold of 3.5. Each colored point represents the relative abundance of a given taxon in a single individual, with columns (left to right), shapes (circle, triangle, square), and colors (green, orange, red) distinguishing between healthy, mild illness, and severe illness groups, respectively. The black diamonds indicate the group mean for each group. Box plots are overlaid on each group, centered on the group median, with notches indicating an approximately 95% confidence interval, boxes indicating boundaries of the first and third quartiles, and whiskers extending to the largest and smallest values no further than 1.5 × interquartile range from the boxes. Points beyond the whiskers are commonly considered outliers, which in this case would suggest that many of the observed associations between taxon relative abundance and illness severity are driven primarily by outliers, or that taxon abundance in severely ill infants comprises more than 1 underlying distribution.

References

    1. Clemente JC, Ursell LK, Parfrey LW, Knight R. The impact of the gut microbiota on human health: an integrative view. Cell 2012; 148:1258–70. - PMC - PubMed
    1. Caporaso JG, Lauber CL, Costello EK, et al. Moving pictures of the human microbiome. Genome Biol 2011; 12:R50. - PMC - PubMed
    1. Faust K, Sathirapongsasuti JF, Izard J, et al. Microbial co-occurrence relationships in the human microbiome. PLoS Comput Biol 2012; 8:e1002606. - PMC - PubMed
    1. Grier A, McDavid A, Wang B, et al. Neonatal gut and respiratory microbiota: coordinated development through time and space. Microbiome 2018; 6:193. - PMC - PubMed
    1. Hofstra JJ, Matamoros S, van de Pol MA, et al. Changes in microbiota during experimental human Rhinovirus infection. BMC Infect Dis 2015; 15:336. - PMC - PubMed

Publication types

Substances