

Evaluating Brightness and Spectral Properties of Click Beetle and Firefly Luciferases Using Luciferin Analogues: Identification of Preferred Pairings of Luciferase and Substrate for In Vivo Bioluminescence Imaging
- PMID: 32926287
- PMCID: PMC7666294
- DOI: 10.1007/s11307-020-01523-7
Evaluating Brightness and Spectral Properties of Click Beetle and Firefly Luciferases Using Luciferin Analogues: Identification of Preferred Pairings of Luciferase and Substrate for In Vivo Bioluminescence Imaging
Abstract
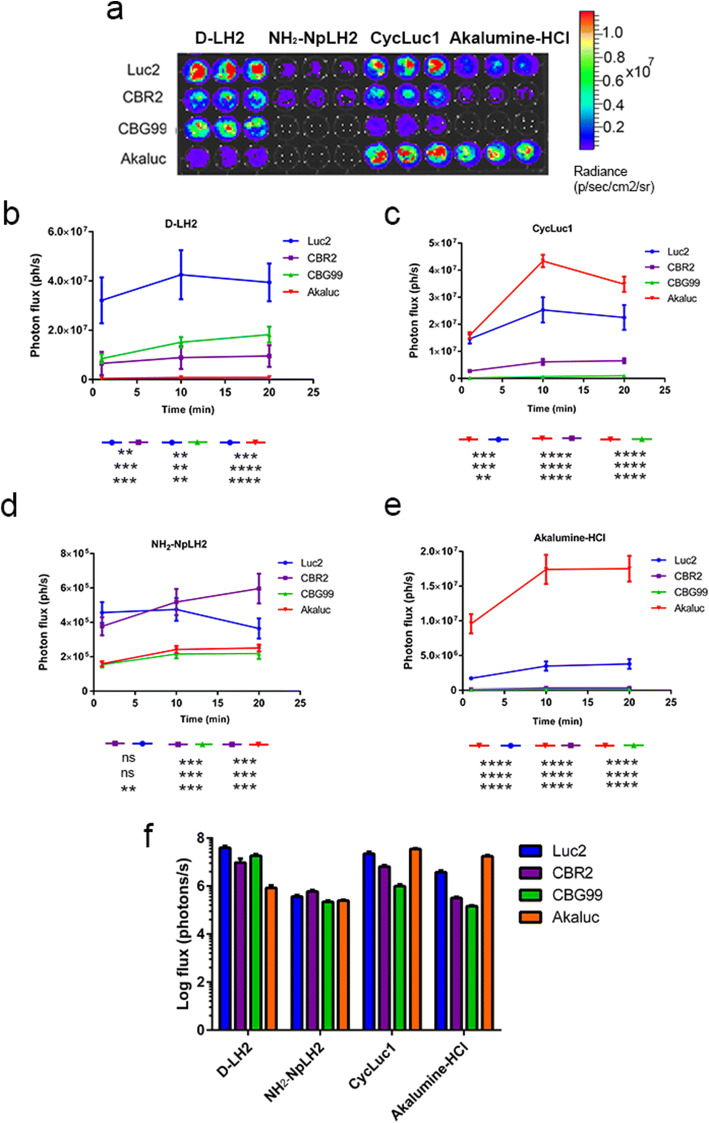
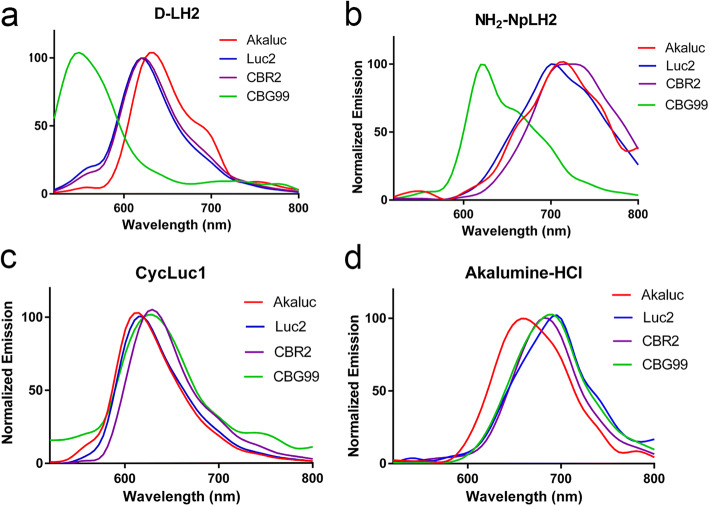
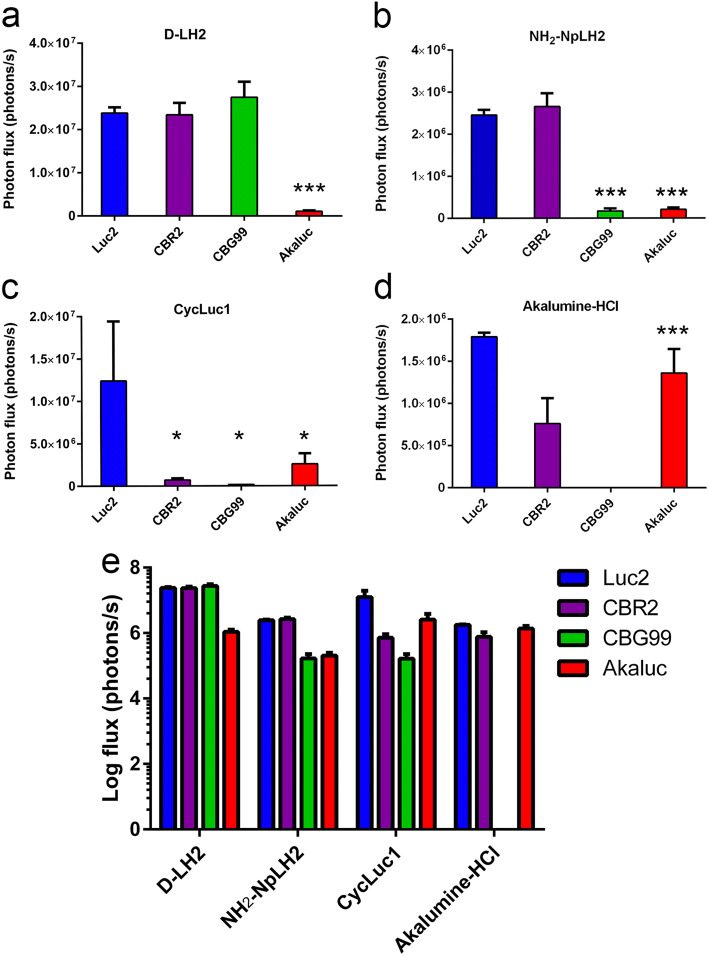
Purpose: Currently, a variety of red and green beetle luciferase variants are available for bioluminescence imaging (BLI). In addition, new luciferin analogues providing longer wavelength luminescence have been developed that show promise for improved deep tissue imaging. However, a detailed assessment of these analogues (e.g., Akalumine-HCl, CycLuc1, and amino naphthyl luciferin (NH2-NpLH2)) combined with state of the art luciferases has not been performed. The aim of this study was to evaluate for the first time the in vivo brightness and spectral characteristics of firefly (Luc2), click beetle green (CBG99), click beetle red 2 (CBR2), and Akaluc luciferases when paired with different D-luciferin (D-LH2) analogues in vivo.
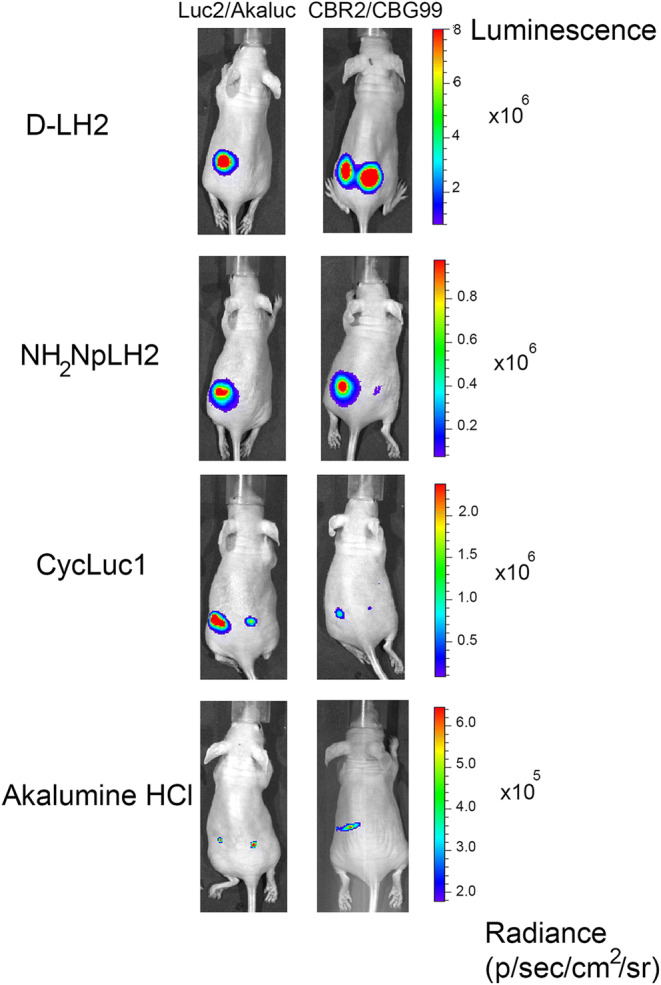
Procedures: Transduced human embryonic kidney (HEK 293T) cells expressing individual luciferases were analyzed both in vitro and in mice (via subcutaneous injection). Following introduction of the luciferins to cells or animals, the resulting bioluminescence signal and photon emission spectrum were acquired using a sensitive charge-coupled device (CCD) camera equipped with a series of band pass filters and spectral unmixing software.
Results: Our in vivo analysis resulted in four primary findings: (1) the best substrate for Luc2, CBG99, and CBR2 in terms of signal strength was D-luciferin; (2) the spectra for Luc2 and CBR2 were shifted to a longer wavelength when Akalumine-HCl was the substrate; (3) CBR2 gave the brightest signal with the near-infrared substrate, NH2-NpLH2; and (4) Akaluc was brighter when paired with either CycLuc1 or Akalumine-HCl when paired with D-LH2.
Conclusion: We believe that the experimental results described here should provide valuable guidance to end users for choosing the correct luciferin/luciferase pairs for a variety of BLI applications.
Keywords: Bioluminescence; Emission spectrum; In vivo imaging; Luciferase; Luciferin.
Conflict of interest statement
The authors declare that they have no conflict of interest.
Figures
Similar articles
-
Sensitive dual color in vivo bioluminescence imaging using a new red codon optimized firefly luciferase and a green click beetle luciferase.PLoS One. 2011 Apr 22;6(4):e19277. doi: 10.1371/journal.pone.0019277. PLoS One. 2011. PMID: 21544210 Free PMC article.
-
A luciferin analogue generating near-infrared bioluminescence achieves highly sensitive deep-tissue imaging.Nat Commun. 2016 Jun 14;7:11856. doi: 10.1038/ncomms11856. Nat Commun. 2016. PMID: 27297211 Free PMC article.
-
Click beetle luciferase mutant and near infrared naphthyl-luciferins for improved bioluminescence imaging.Nat Commun. 2018 Jan 9;9(1):132. doi: 10.1038/s41467-017-02542-9. Nat Commun. 2018. PMID: 29317625 Free PMC article.
-
How to Select Firefly Luciferin Analogues for In Vivo Imaging.Int J Mol Sci. 2021 Feb 12;22(4):1848. doi: 10.3390/ijms22041848. Int J Mol Sci. 2021. PMID: 33673331 Free PMC article. Review.
-
Recent achievements of bioluminescence imaging based on firefly luciferin-luciferase system.Eur J Med Chem. 2021 Feb 5;211:113111. doi: 10.1016/j.ejmech.2020.113111. Epub 2020 Dec 17. Eur J Med Chem. 2021. PMID: 33360804 Review.
Cited by
-
Red-shifted click beetle luciferase mutant expands the multicolor bioluminescent palette for deep tissue imaging.iScience. 2020 Dec 26;24(1):101986. doi: 10.1016/j.isci.2020.101986. eCollection 2021 Jan 22. iScience. 2020. PMID: 33490896 Free PMC article.
-
In Vivo Bioluminescence and Fluorescence Imaging: Optical Tool for Cancer Research.Methods Mol Biol. 2024;2773:105-123. doi: 10.1007/978-1-0716-3714-2_11. Methods Mol Biol. 2024. PMID: 38236541
-
Improved Multimodal Tumor Necrosis Imaging with IRDye800CW-DOTA Conjugated to an Albumin-Binding Domain.Cancers (Basel). 2022 Feb 9;14(4):861. doi: 10.3390/cancers14040861. Cancers (Basel). 2022. PMID: 35205609 Free PMC article.
-
Coumarin luciferins and mutant luciferases for robust multi-component bioluminescence imaging.Chem Sci. 2021 Aug 2;12(35):11684-11691. doi: 10.1039/d1sc03114g. eCollection 2021 Sep 15. Chem Sci. 2021. PMID: 34659703 Free PMC article.
-
Development of two mouse strains conditionally expressing bright luciferases with distinct emission spectra as new tools for in vivo imaging.Lab Anim (NY). 2023 Oct;52(10):247-257. doi: 10.1038/s41684-023-01238-6. Epub 2023 Sep 7. Lab Anim (NY). 2023. PMID: 37679611 Free PMC article.
References
Publication types
MeSH terms
Substances
LinkOut - more resources
Full Text Sources
Research Materials
Miscellaneous
