. 2020 Sep 2;23(9):101521.
doi: 10.1016/j.isci.2020.101521. eCollection 2020 Sep 25.

Thioredoxin Interacting Protein Is Required for a Chronic Energy-Rich Diet to Promote Intestinal Fructose Absorption

Affiliations

Thioredoxin Interacting Protein Is Required for a Chronic Energy-Rich Diet to Promote Intestinal Fructose Absorption

Anu Shah et al. iScience. .

Abstract

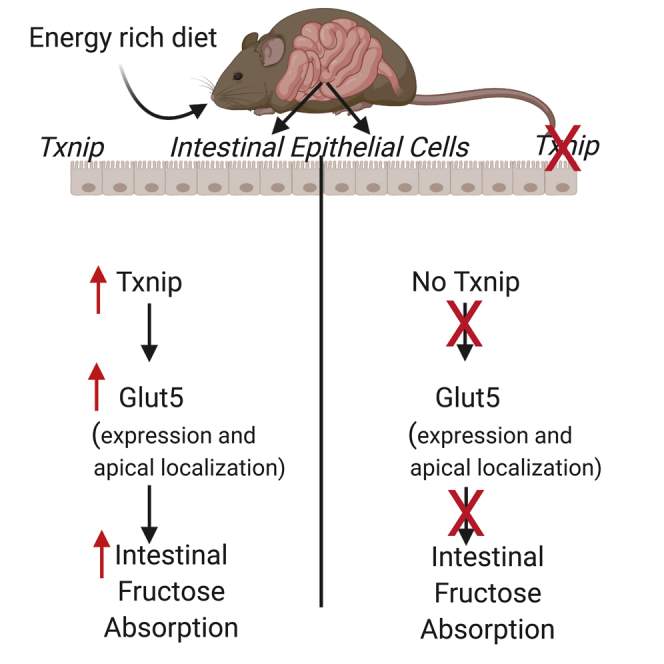
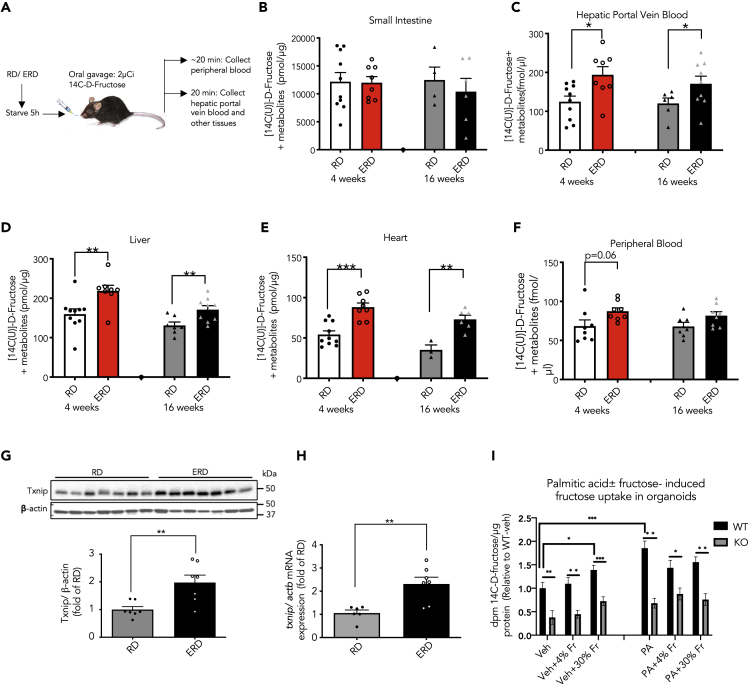
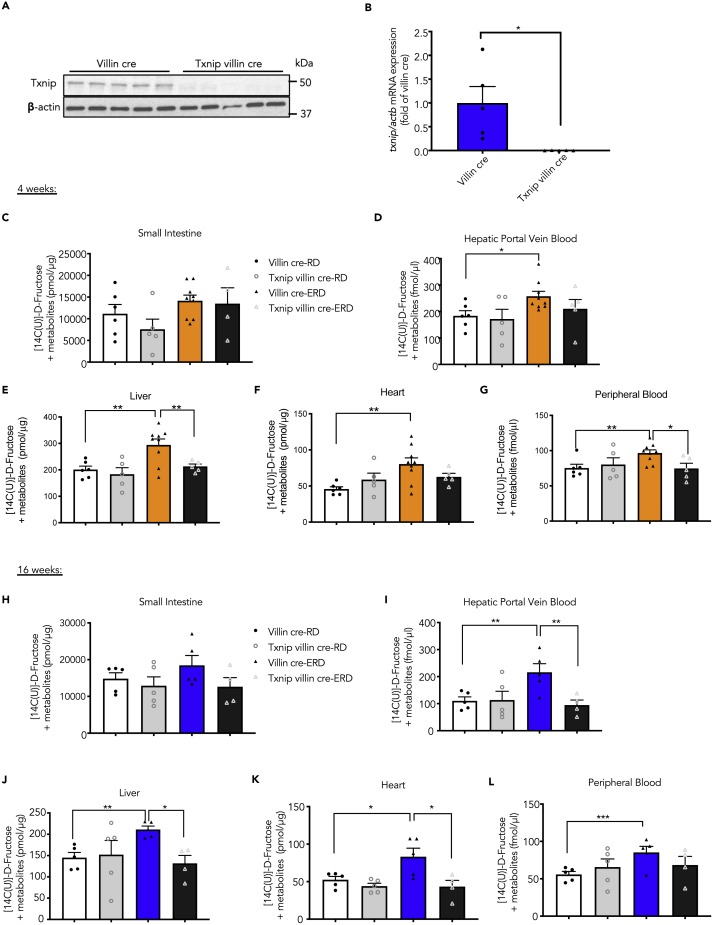
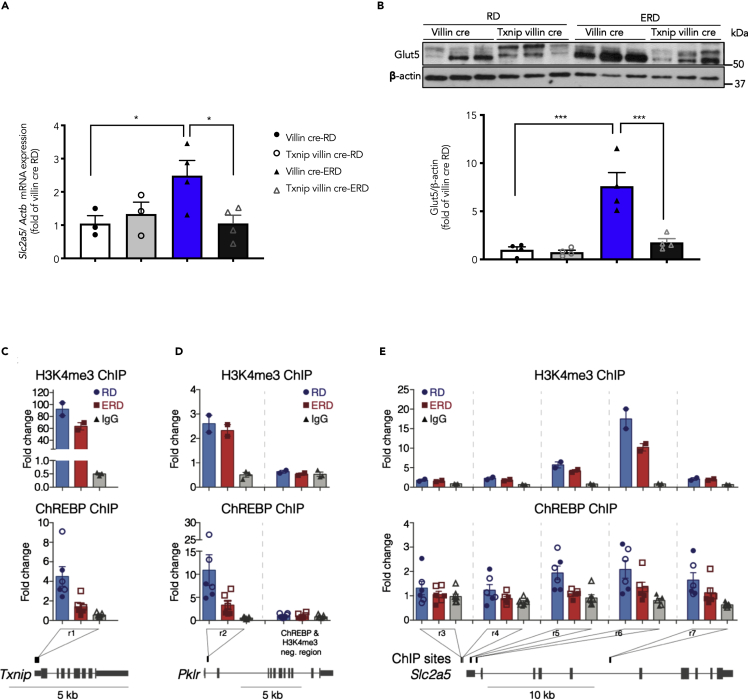
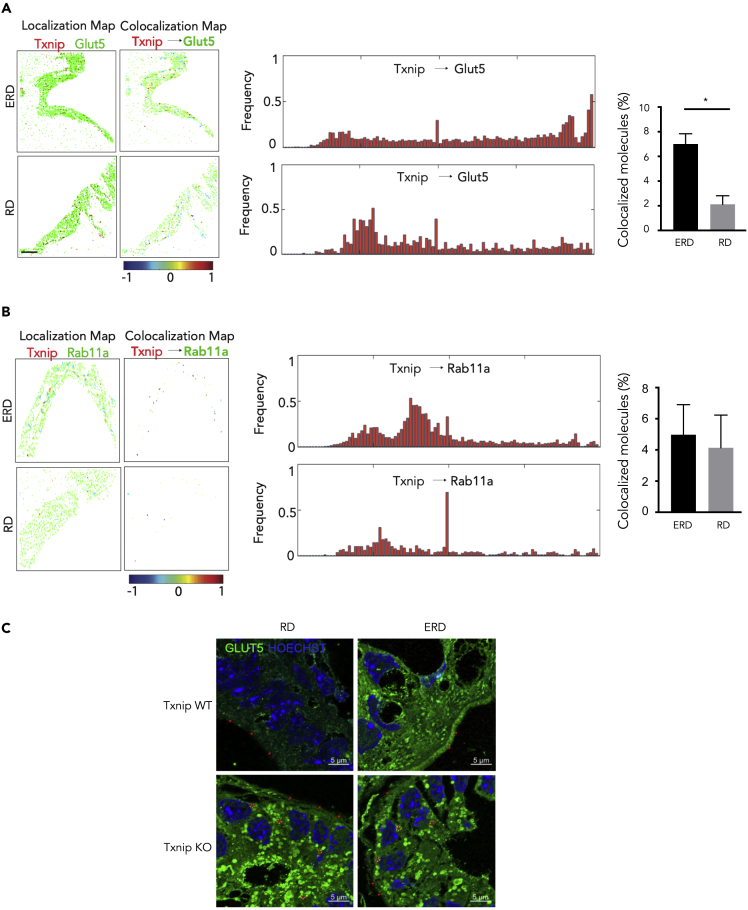
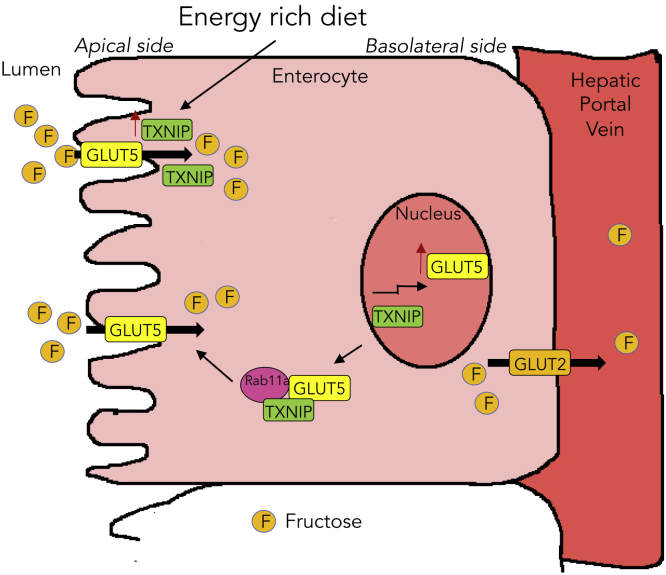
Increased consumption of fats and added sugars has been associated with an increase in metabolic syndromes. Here we show that mice chronically fed an energy-rich diet (ERD) with high fat and moderate sucrose have enhanced the absorption of a gastrointestinal fructose load, and this required expression of the arrestin domain protein Txnip in the intestinal epithelial cells. ERD feeding induced gene and protein expression of Glut5, and this required the expression of Txnip. Furthermore, Txnip interacted with Rab11a, a small GTPase that facilitates the apical localization of Glut5. We also demonstrate that ERD promoted Txnip/Glut5 complexes in the apical intestinal epithelial cell. Our findings demonstrate that ERD facilitates fructose absorption through a Txnip-dependent mechanism in the intestinal epithelial cell, suggesting that increased fructose absorption could potentially provide a mechanism for worsening of metabolic syndromes in the setting of a chronic ERD.

Keywords: Human Metabolism; Molecular Biology.


Conflict of interest statement

The authors declare no competing interests.

Figures

None
Graphical abstract
Figure 1
Figure 1
Energy-Rich Diet Promotes Fructose Absorption and Elevates Txnip Expression (A) Schematic representation of the experimental procedure. (B–F) Fructose absorption (i.e., 14C-fructose + metabolites) by various tissues from 4 weeks (n = 7–8) and 16 weeks (n = 3–8) RD/ERD diet-fed mice after the intragastric oral gavage of 14C-fructose. Values are shown as mean ± SEM. ∗p < 0.05, ∗∗p < 0.01, or ∗∗∗p < 0.001 as calculated by unpaired t test. (G) A representative western blot and quantitative analysis of Txnip (molecular weight: 50kDa) and β-actin (loading control, molecular weight: 42kDa) in the jejunal lysates of RD/ERD-fed mice (n = 7 mice/diet).Values are shown as mean ± SEM. ∗∗p < 0.01as calculated by unpaired t test. (H) Gene expression of Txnip normalized to actb, house-keeping gene, in the jejunal samples from RD/ERD-fed mice (n = 6–7 mice/diet). Values are shown as mean ± SEM. ∗∗p < 0.01 as calculated by unpaired t test. (I) Intestinal uptake of fructose was performed in the intestinal organoids extracted from Txnip wild-type (WT) and knockout (KO) mice. Both palmitic acid (PA) and 30% fructose (veh+30% Fr) significantly increased fructose uptake in WT organoids when compared with WT-veh. However, the deletion of Txnip significantly reduced both fructose-induced and PA-induced fructose uptake. There was no significant increase in the PA-induced fructose uptake by Txnip WT organoids after the addition of either 4% Fr or 30% Fr (n = 7–8 wells). Values are shown as mean ± SEM. ∗p < 0.05, ∗∗p < 0.01, or ∗∗∗p < 0.001 as calculated by unpaired t test. WT, wild-type; KO, knockout; veh, vehicle/BSA; PA, palmitic acid; and Fr, fructose. See also Tables S1 and S2 and Figures S1 and S2.
Figure 2
Figure 2
Deletion of Txnip in the Intestinal Epithelial Cells Mitigates ERD-Induced Fructose Absorption (A) A representative western blot demonstrating successful abolition of Txnip in the villi of Txnip villin cre mice (n = 5). (B) Gene expression of Txnip normalized to actb in villi from villin cre and Txnip villin cre mice (n = 5). Values are shown as mean ± SEM. ∗p < 0.05 as calculated by unpaired t test. (C–L) (C–G) Fructose absorption (i.e., 14C-fructose + metabolites) by various tissues from 4 weeks (n = 4–8) and (H–L) 16 weeks (n = 4–5) in RD/ERD-fed mice after the oral gavage of 14C-fructose. Values are shown as mean ± SEM. ∗p < 0.05, ∗∗p < 0.01, or ∗∗∗p < 0.001 as calculated by unpaired t test. See also Table S2.
Figure 3
Figure 3
Txnip Is Required for the Energy-Rich Diet-Induced Glut5 Expression Villin cre and Txnip villin cre mice were placed on RD/ERD for 16 weeks. (A) Gene expression of Slc2a5 normalized to actb in mucosal lysates extracted from jejuna (n = 3–4/group). (B) A representative western blot (top) with quantitation (bottom) from the mucosal lysates obtained from jejuna (n = 4/group) showing the Glut5 protein levels. Values are shown as mean ± SEM. ∗p < 0.05 or ∗∗∗p < 0.001 as calculated by unpaired t test. (C and D) ChIP for ChREBP and H3K4me3 on intestinal tissues from mice on an RD or an ERD, followed by quantitative PCR to assay enrichment at Txnip, Pklr, and Slc2a5 genomic loci. H3K4me3 enrichment shown in the top panel (one of two independent biological replicates shown). Error bars represent the mean ± SEM of n = 2 ChIPs for mice on RD and ERD and n = 3 IgG ChIPs. Positive control regions for ChREBP at the (C) Txnip promoter (r1) (Poungvarin et al., 2015) and (D) pyruvate kinase L/R (Pklr) promoter (r2) (Kim et al., 2017) along with a previously reported ChREBP negative control region (Kim et al., 2017). (E) Slc2a5 promoter and gene body showing five different ChIP regions assayed (assay was conducted on 2 biological replicates and 3 technical replicates). Regions (r3, r4, and r7) contain previously identified ChREBP-binding sites (Kim et al., 2017; Oh et al., 2018). Regions (r5 and r6) overlap with the Slc2a5 promoter and are in proximity to previously reported ChREBP-binding sites (Oh et al., 2018). Error bars indicate the mean ± SEM of two independent ChREBP ChIP experiments for chromatin from n = 2 mice on RD (n = 3 ChIPs per biological replicate indicated by open or solid circles), n = 2 mice on ERD (n = 3 ChIPs per biological replicate indicated by open or solid squares), and control IgG (n = 3 to 4 ChIPs per biological replicate indicated by open or solid gray triangles) with either RD or ERD chromatin. Two of seven IgG samples for r4 have undetermined Ct values and therefore are not shown. Genomic loci shown are from University of Santa Cruz Genome Browser (UCSC), mm10. See also Figures S3 and S4.
Figure 4
Figure 4
Txnip Interacts with Rab11a and Is Needed for Apical Localization of Glut5 Semi-thin sections (1 μM) from the small intestine of mice were imaged following ERD or RD using two-color dSTORM. Localization data was analyzed using the Clus-DoC algorithm. Representative images of Txnip and Glut5 and Txnip and Rab11a are shown. (A) Localization maps for Txnip (red) and Glut5 (green) and colocalization maps for Txnip relative to Glut5 (right panels). Txnip molecules are color-coded according to their degree of colocalization (DoC) scores (color scale bar at bottom). Frequency histograms of DoC scores of all molecules for Txnip from all cells analyzed (middle panels). The percent colocalization of Txnip molecules with Glut5 is shown in the bar graph. (B) Localization maps, histograms, and bar graphs for the colocalization of Txnip (red) and Rab11a (green). Statistical significance was assessed by two-way ANOVA with multiple comparisons and a Tukey post-test with significance indicated by ∗p < 0.05. Bars show mean ± SEM from 5–13 ROIs over 3 separate mice (scale bar, 10 μm). See Figure S5 for more details. (C). Representative images showing the distribution of Glut5 in enterocytes of Txnip WT and KO mice. One-micron sections from jejuna of RD- or ERD-fed Txnip WT and KO mice (n = 3 mice/group) were stained for Glut5. Expression of Glut5 (green) is remarkably elevated at the apical brush border (red arrows) of WT-ERD versus WT-RD. Notably, Glut5 is trapped in vesicles (as shown by ∗) in the Txnip KO enterocytes. Scale bars, 5 μm, magnification = 63× with Airyscan.
Figure 5
Figure 5
Schematic Representation of Intestinal Fructose Absorption Energy-rich diet increases intestinal Txnip expression, which in turn increases fructose absorption by elevating both Glut5 protein and gene expressions. Second, Txnip binds with Rab11a, a small GTPase protein essential for Glut5 apical localization, to potentially promote Glut5 trafficking to the apical surface for more fructose uptake.

References

    1. Adamson A.W., Suchankova G., Rufo C., Nakamura M.T., Teran-Garcia M., Clarke S.D., Gettys T.W. Hepatocyte nuclear factor-4alpha contributes to carbohydrate-induced transcriptional activation of hepatic fatty acid synthase. Biochem. J. 2006;399:285–295. - PMC - PubMed
    1. Beyaz S., Mana M.D., Roper J., Kedrin D., Saadatpour A., Hong S.J., Bauer-Rowe K.E., Xifaras M.E., Akkad A., Arias E. High-fat diet enhances stemness and tumorigenicity of intestinal progenitors. Nature. 2016;531:53–58. - PMC - PubMed
    1. Bray G.A., Nielsen S.J., Popkin B.M. Consumption of high-fructose corn syrup in beverages may play a role in the epidemic of obesity. Am. J. Clin. Nutr. 2004;79:537–543. - PubMed
    1. Bricambert J., Miranda J., Benhamed F., Girard J., Postic C., Dentin R. Salt-inducible kinase 2 links transcriptional coactivator p300 phosphorylation to the prevention of ChREBP-dependent hepatic steatosis in mice. J. Clin. Invest. 2010;120:4316–4331. - PMC - PubMed
    1. Caron S., Huaman Samanez C., Dehondt H., Ploton M., Briand O., Lien F., Dorchies E., Dumont J., Postic C., Cariou B. Farnesoid X receptor inhibits the transcriptional activity of carbohydrate response element binding protein in human hepatocytes. Mol. Cell Biol. 2013;33:2202–2211. - PMC - PubMed

LinkOut - more resources