

Decreased Volume of Lateral and Medial Geniculate Nuclei in Patients with LHON Disease-7 Tesla MRI Study
- PMID: 32927622
- PMCID: PMC7565643
- DOI: 10.3390/jcm9092914
Decreased Volume of Lateral and Medial Geniculate Nuclei in Patients with LHON Disease-7 Tesla MRI Study
Abstract
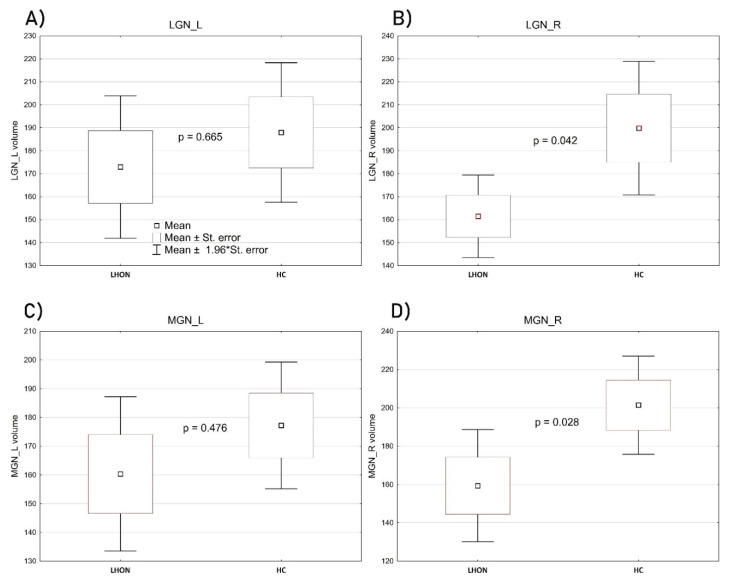
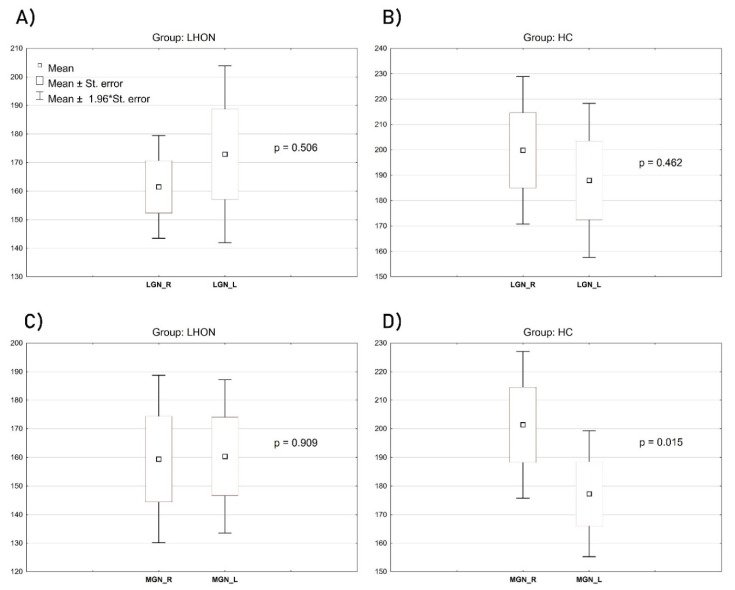
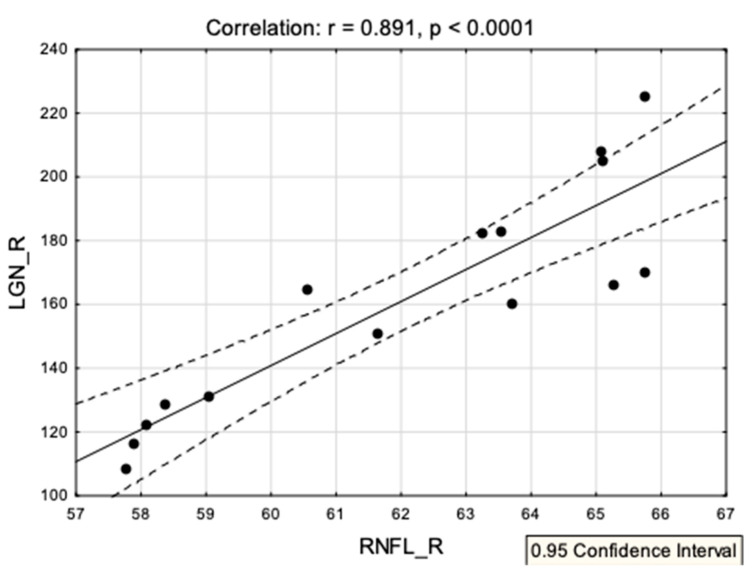
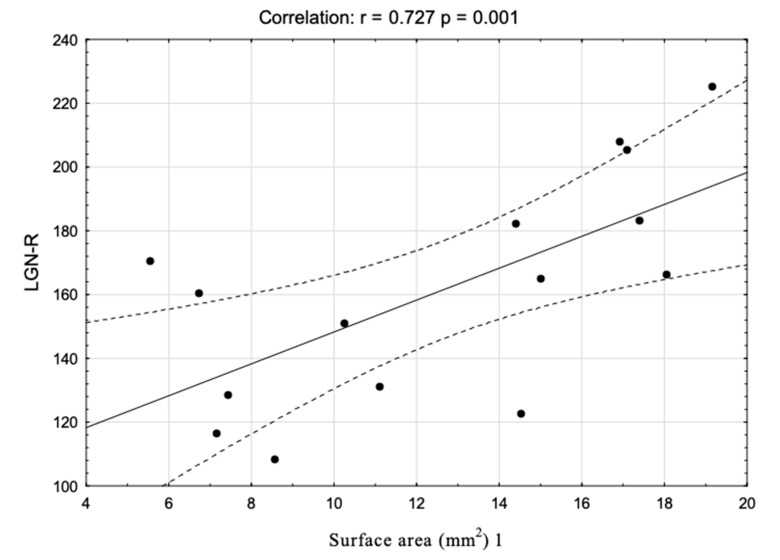
Leber's hereditary optic neuropathy (LHON) is a maternally inherited genetic disorder leading to severe and bilateral loss of central vision, with a young male predilection. In recent years, multiple studies examined structural abnormalities in visual white matter tracts such as the optic tract and optic radiation. However, it is still unclear if the disease alters only some parts of the white matter architecture or whether the changes also affect grey matter parts of the visual pathway. This study aimed at improving our understanding of morphometric changes in the lateral (LGN) and medial (MGN) geniculate nuclei and their associations with the clinical picture in LHON by the application of a submillimeter surface-based analysis approach to the ultra-high-field 7T magnetic resonance imaging data. To meet these goals, fifteen LHON patients and fifteen age-matched healthy subjects were examined. A quantitative analysis of the LGN and MGN volume was performed for all individuals. Additionally, morphometric results of LGN and MGN were correlated with variables covering selected aspects of the clinical picture of LHON. In comparison with healthy controls (HC), LHON participants showed a significantly decreased volume of the right LGN and the right MGN. Nevertheless, the volume of the right LGN was strongly correlated with the averaged thickness value of the right retinal nerve fiber layer (RNFL). The abnormalities in the volume of the LHON patients' thalamic nuclei indicate that the disease can cause changes not only in the white matter areas constituting visual tracts but also in the grey matter structures. Furthermore, the correlation between the changes in the LGN volume and the RNFL, as well as the right optic nerve surface area located proximally to the eyeball, suggest some associations between the atrophy of these structures. However, to fully confirm this observation, longitudinal studies should be conducted.
Keywords: LGN; LHON; MGN; mitochondrial.
Conflict of interest statement
The authors declare no conflict of interest.
Figures
Similar articles
-
Neuroanatomical Changes in Leber's Hereditary Optic Neuropathy: Clinical Application of 7T MRI Submillimeter Morphometry.Brain Sci. 2020 Jun 9;10(6):359. doi: 10.3390/brainsci10060359. Brain Sci. 2020. PMID: 32526981 Free PMC article.
-
Aberrant Structural Network Architecture in Leber's Hereditary Optic Neuropathy. Minimum Spanning Tree Graph Analysis Application into Diffusion 7T MRI.Neuroscience. 2021 Feb 10;455:128-140. doi: 10.1016/j.neuroscience.2020.12.019. Epub 2020 Dec 25. Neuroscience. 2021. PMID: 33359657
-
Widespread Reductions of Spontaneous Neurophysiological Activity in Leber's Disease-An Application of EEG Source Current Density Reconstruction.Brain Sci. 2020 Sep 8;10(9):622. doi: 10.3390/brainsci10090622. Brain Sci. 2020. PMID: 32911650 Free PMC article.
-
Leber's hereditary optic neuropathy is multiorgan not mono-organ.Clin Ophthalmol. 2016 Nov 2;10:2187-2190. doi: 10.2147/OPTH.S120197. eCollection 2016. Clin Ophthalmol. 2016. PMID: 27843288 Free PMC article. Review.
-
Leber hereditary optic neuropathy: clinical and molecular genetic findings.Neurogenetics. 2001 Jul;3(3):119-25. doi: 10.1007/s100480100115. Neurogenetics. 2001. PMID: 11523562 Review.
Cited by
-
Expression of GABAAα1, GABAB1, and mGluR2 receptors in the lateral geniculate body of male neonates born to diabetic rats.Iran J Basic Med Sci. 2023;26(7):805-811. doi: 10.22038/IJBMS.2023.69668.15171. Iran J Basic Med Sci. 2023. PMID: 37396950 Free PMC article.
-
Cytoarchitectonic Maps of the Human Metathalamus in 3D Space.Front Neuroanat. 2022 Mar 8;16:837485. doi: 10.3389/fnana.2022.837485. eCollection 2022. Front Neuroanat. 2022. PMID: 35350721 Free PMC article.
-
Lateral Geniculate Nucleus Volume Determined on MRI Correlates With Corresponding Ganglion Cell Layer Loss in Acquired Human Postgeniculate Lesions.Invest Ophthalmol Vis Sci. 2022 Aug 2;63(9):18. doi: 10.1167/iovs.63.9.18. Invest Ophthalmol Vis Sci. 2022. PMID: 35960514 Free PMC article.
-
Increased Apoptosis in Subcortical Regions of The Visual Pathway in Offspring Born to Diabetic Rats.Cell J. 2023 Aug 1;25(8):564-569. doi: 10.22074/cellj.2023.1989649.1232. Cell J. 2023. PMID: 37641418 Free PMC article.
-
Aberrant neurovascular coupling in Leber's hereditary optic neuropathy: Evidence from a multi-model MRI analysis.Front Neurosci. 2023 Jan 10;16:1050772. doi: 10.3389/fnins.2022.1050772. eCollection 2022. Front Neurosci. 2023. PMID: 36703998 Free PMC article.
References
-
- Carelli V., Rugolo M., Sgarbi G., Ghelli A., Zanna C., Baracca A., Lenaz G., Napoli E., Martinuzzi A., Solaini G. Bioenergetics shapes cellular death pathways in Leber’s hereditary optic neuropathy: A model of mitochondrial neurodegeneration. Biochim. et Biophys. Acta (BBA) Gen. Subj. 2004;1658:172–179. doi: 10.1016/j.bbabio.2004.05.009. - DOI - PubMed
LinkOut - more resources
Full Text Sources
