

Mapping Heat-Related Risks in Northern Jiangxi Province of China Based on Two Spatial Assessment Frameworks Approaches
- PMID: 32927631
- PMCID: PMC7559026
- DOI: 10.3390/ijerph17186584
Mapping Heat-Related Risks in Northern Jiangxi Province of China Based on Two Spatial Assessment Frameworks Approaches
Abstract
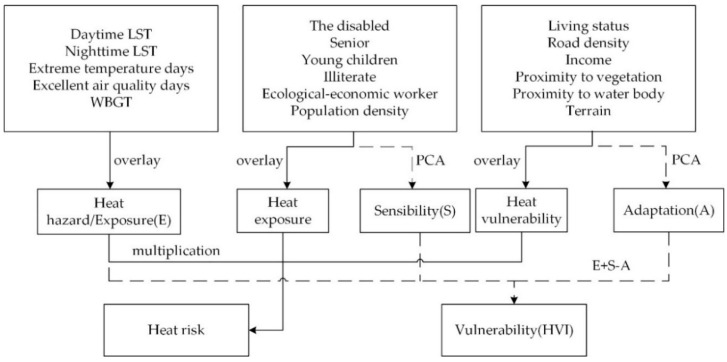
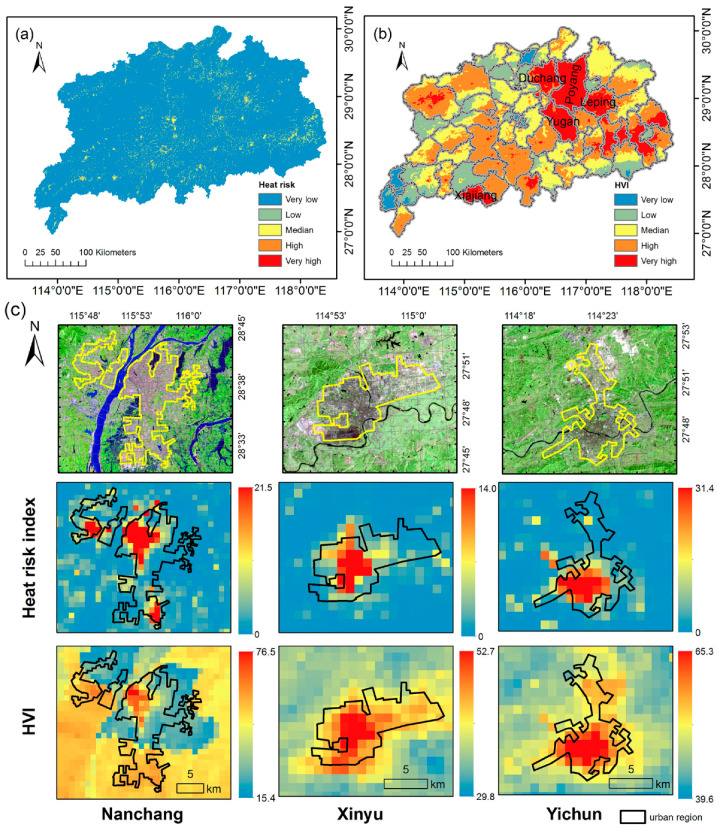
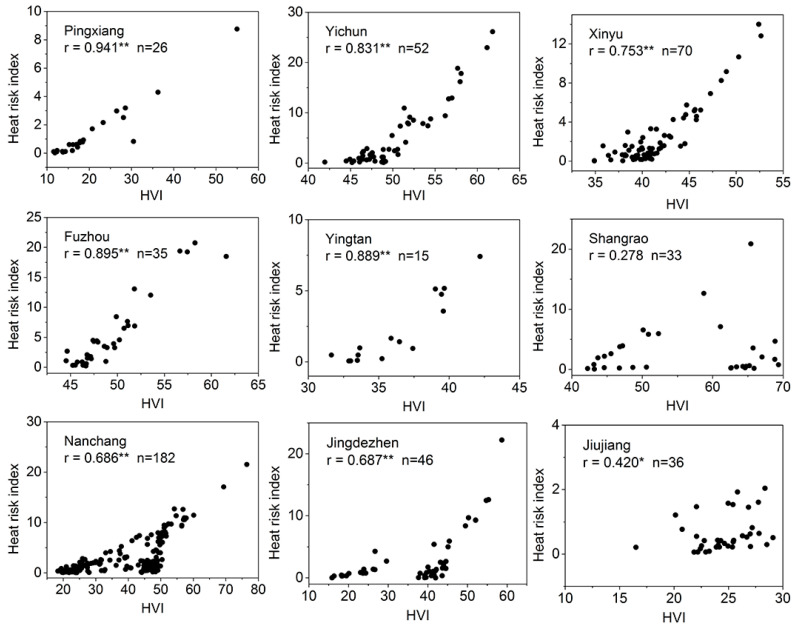
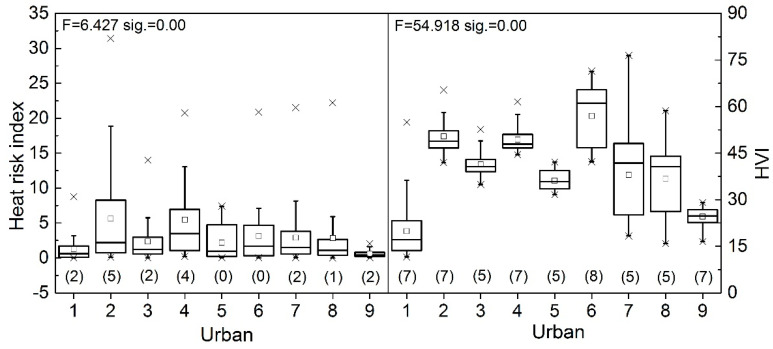
Heat-health risk is a growing concern in many regions of China due to the more frequent occurrence of extremely hot weather. Spatial indexes based on various heat assessment frameworks can be used for the assessment of heat risks. In this study, we adopted two approaches-Crichton's risk triangle and heat vulnerability index (HVI) to identify heat-health risks in the Northern Jiangxi Province of China, by using remote sensing and socio-economic data. The Geographical Information System (GIS) overlay and principal component analysis (PCA) were separately used in two frameworks to integrate parameters. The results show that the most densely populated community in the suburbs, instead of city centers, are exposed to the highest heat risk. A comparison of two heat assessment mapping indicates that the distribution of HVI highlights the vulnerability differences between census tracts. In contrast, the heat risk index of Crichton's risk triangle has a prominent representation for regions with high risks. The stepwise multiple linear regression zero-order correlation coefficient between HVI and outdoor workers is 0.715, highlighting the vulnerability of this particular group. Spearman's rho nonparametric correlation and the mean test reveals that heat risk index is strongly correlated with HVI in most of the main urban regions in the study area, with a significantly lower value than the latter. The analysis of variance shows that the distribution of HVI exhibits greater variety across urban regions than that of heat risk index. Our research provides new insight into heat risk assessment for further study of heat health risk in developing countries.
Keywords: Crichton’s risk triangle; developing countries; heat vulnerability index (HVI); heat-health risk; spatial risk assessment.
Conflict of interest statement
The authors declare no conflict of interest. Permission has been obtained and there are no copyright issues.
Figures

Similar articles
-
Urban-hazard risk analysis: mapping of heat-related risks in the elderly in major Italian cities.PLoS One. 2015 May 18;10(5):e0127277. doi: 10.1371/journal.pone.0127277. eCollection 2015. PLoS One. 2015. PMID: 25985204 Free PMC article.
-
Development of a heat vulnerability index for New York State.Public Health. 2018 Aug;161:127-137. doi: 10.1016/j.puhe.2017.09.006. Epub 2017 Dec 1. Public Health. 2018. PMID: 29195682
-
Spatially explicit assessment of heat health risk by using multi-sensor remote sensing images and socioeconomic data in Yangtze River Delta, China.Int J Health Geogr. 2018 May 25;17(1):15. doi: 10.1186/s12942-018-0135-y. Int J Health Geogr. 2018. PMID: 29801488 Free PMC article.
-
The Construction and Validation of the Heat Vulnerability Index, a Review.Int J Environ Res Public Health. 2015 Jun 26;12(7):7220-34. doi: 10.3390/ijerph120707220. Int J Environ Res Public Health. 2015. PMID: 26132476 Free PMC article. Review.
-
A Systematic Review of the Development and Validation of the Heat Vulnerability Index: Major Factors, Methods, and Spatial Units.Curr Clim Change Rep. 2021;7(3):87-97. doi: 10.1007/s40641-021-00173-3. Epub 2021 Apr 27. Curr Clim Change Rep. 2021. PMID: 34745843 Free PMC article. Review.
Cited by
-
Variations of Urban Thermal Risk with Local Climate Zones.Int J Environ Res Public Health. 2023 Feb 13;20(4):3283. doi: 10.3390/ijerph20043283. Int J Environ Res Public Health. 2023. PMID: 36833977 Free PMC article.
-
The pathogenesis and therapeutic strategies of heat stroke-induced myocardial injury.Front Pharmacol. 2024 Jan 8;14:1286556. doi: 10.3389/fphar.2023.1286556. eCollection 2023. Front Pharmacol. 2024. PMID: 38259273 Free PMC article. Review.
-
Heat health assessment and risk simulation prediction in eastern China: a geospatial analysis.Front Public Health. 2025 Mar 7;13:1521997. doi: 10.3389/fpubh.2025.1521997. eCollection 2025. Front Public Health. 2025. PMID: 40124407 Free PMC article.
References
-
- Mishra V., Ganguly A.R., Nijssen B., Lettenmaier D.P. Changes in observed climate extremes in global urban areas. Environ. Res. Lett. 2015;10:024005. doi: 10.1088/1748-9326/10/2/024005. - DOI
-
- Perkins S.E., Alexander L.V., Nairn J.R. Increasing frequency, intensity and duration of observed global heatwaves and warm spells. Geophys. Res. Lett. 2012;39:1–5. doi: 10.1029/2012GL053361. - DOI
-
- Shaposhnikov D., Revich B., Bellander T., Bedada G.B., Bottai M., Kharkova T., Kvasha E., Lezina E., Lind T., Semutnikova E., et al. Mortality Related to Air Pollution with the Moscow Heat Wave and Wildfire of 2010. Epidemiology. 2014;25:359–364. doi: 10.1097/EDE.0000000000000090. - DOI - PMC - PubMed
Publication types
MeSH terms
LinkOut - more resources
Full Text Sources
