. 2020 Sep 10;12(9):2581.
doi: 10.3390/cancers12092581.

Exhaustion of Protective Heat Shock Response Induces Significant Tumor Damage by Apoptosis after Modulated Electro-Hyperthermia Treatment of Triple Negative Breast Cancer Isografts in Mice

Affiliations

Exhaustion of Protective Heat Shock Response Induces Significant Tumor Damage by Apoptosis after Modulated Electro-Hyperthermia Treatment of Triple Negative Breast Cancer Isografts in Mice

Lea Danics et al. Cancers (Basel). .

Abstract

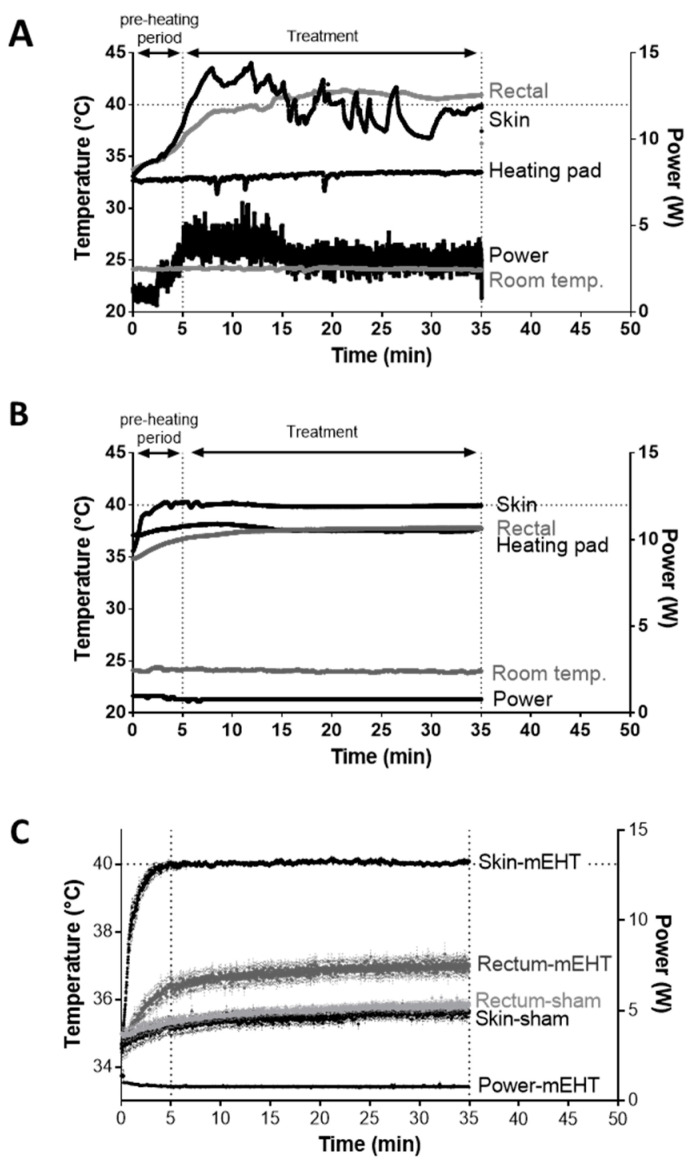
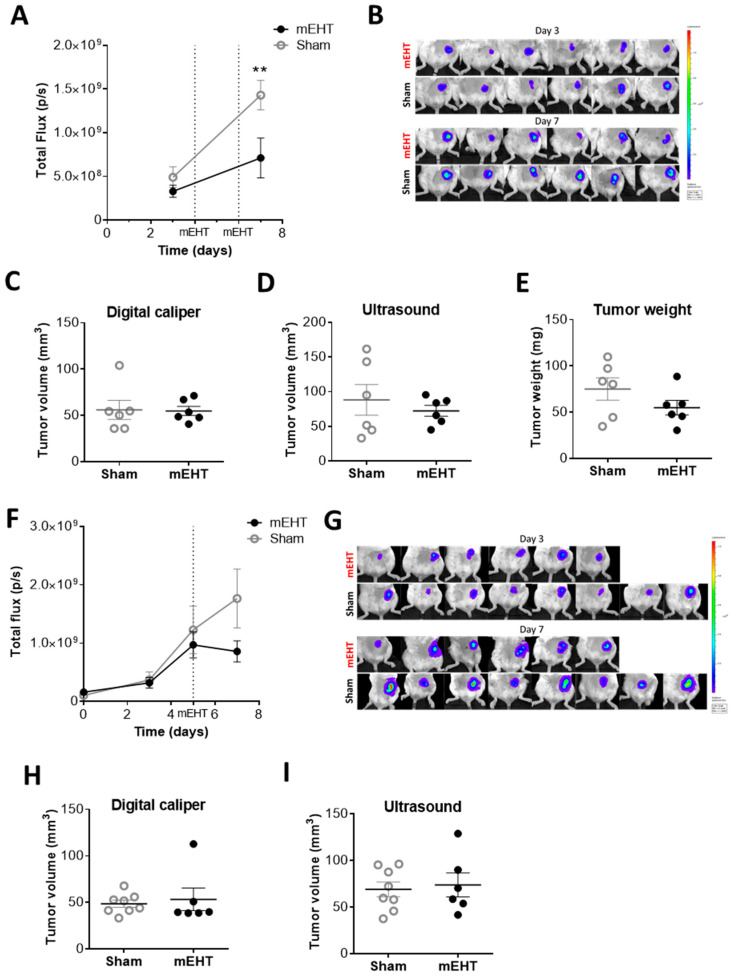
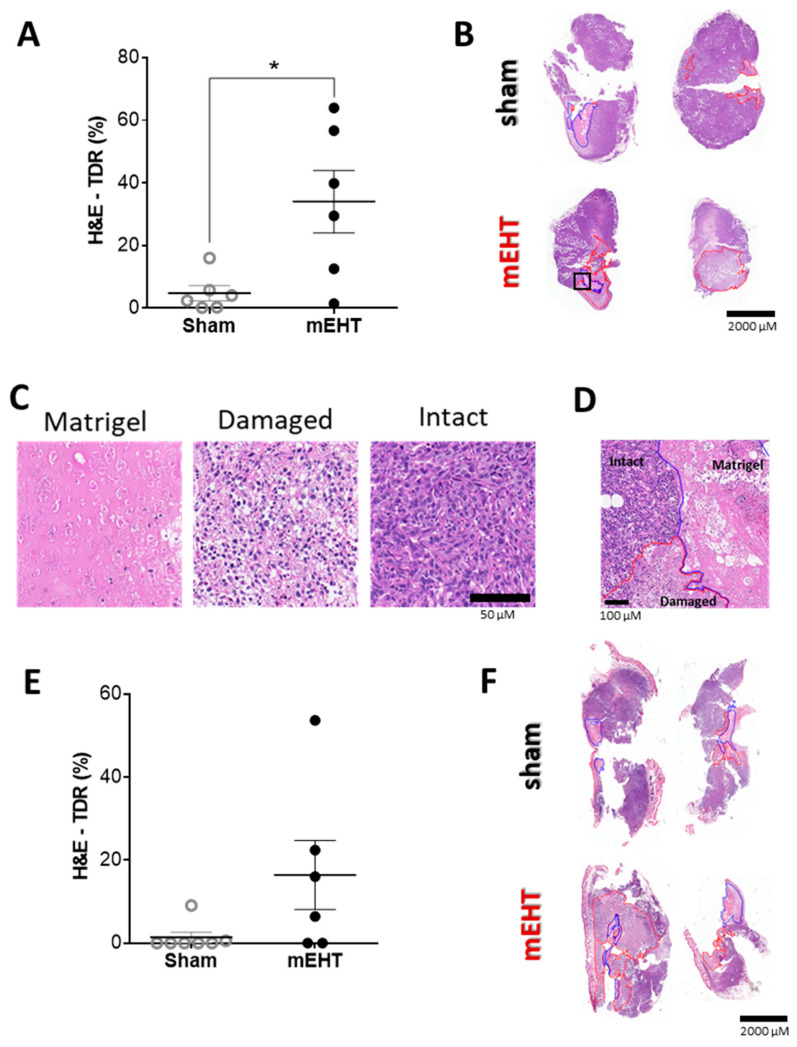
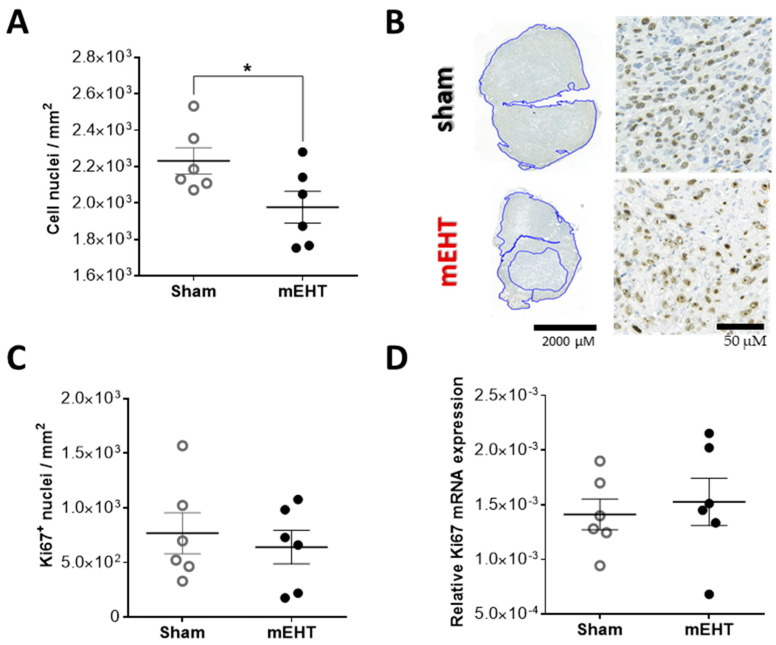
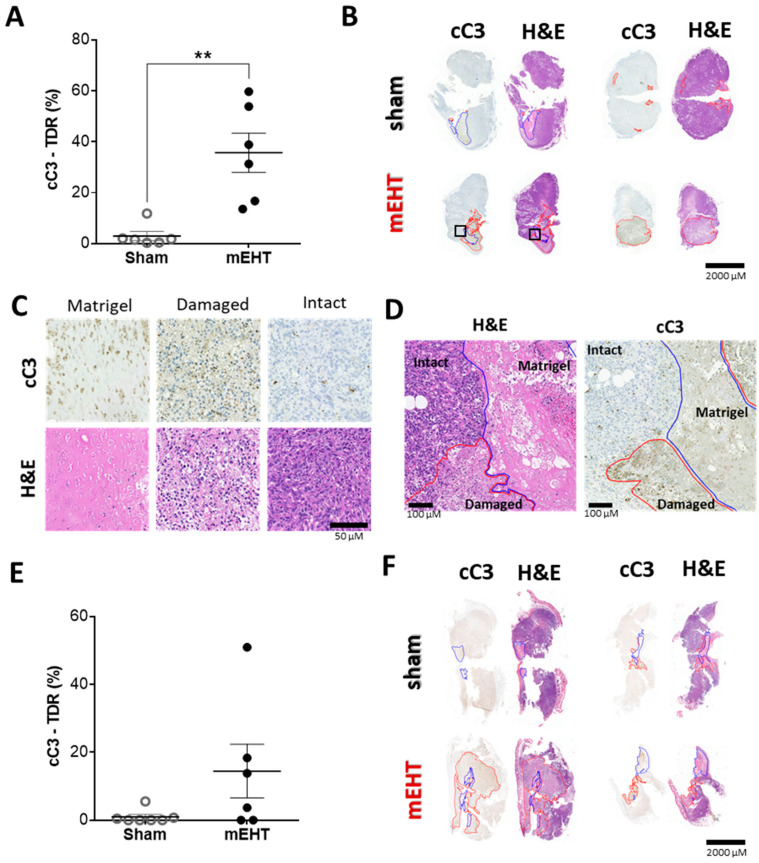
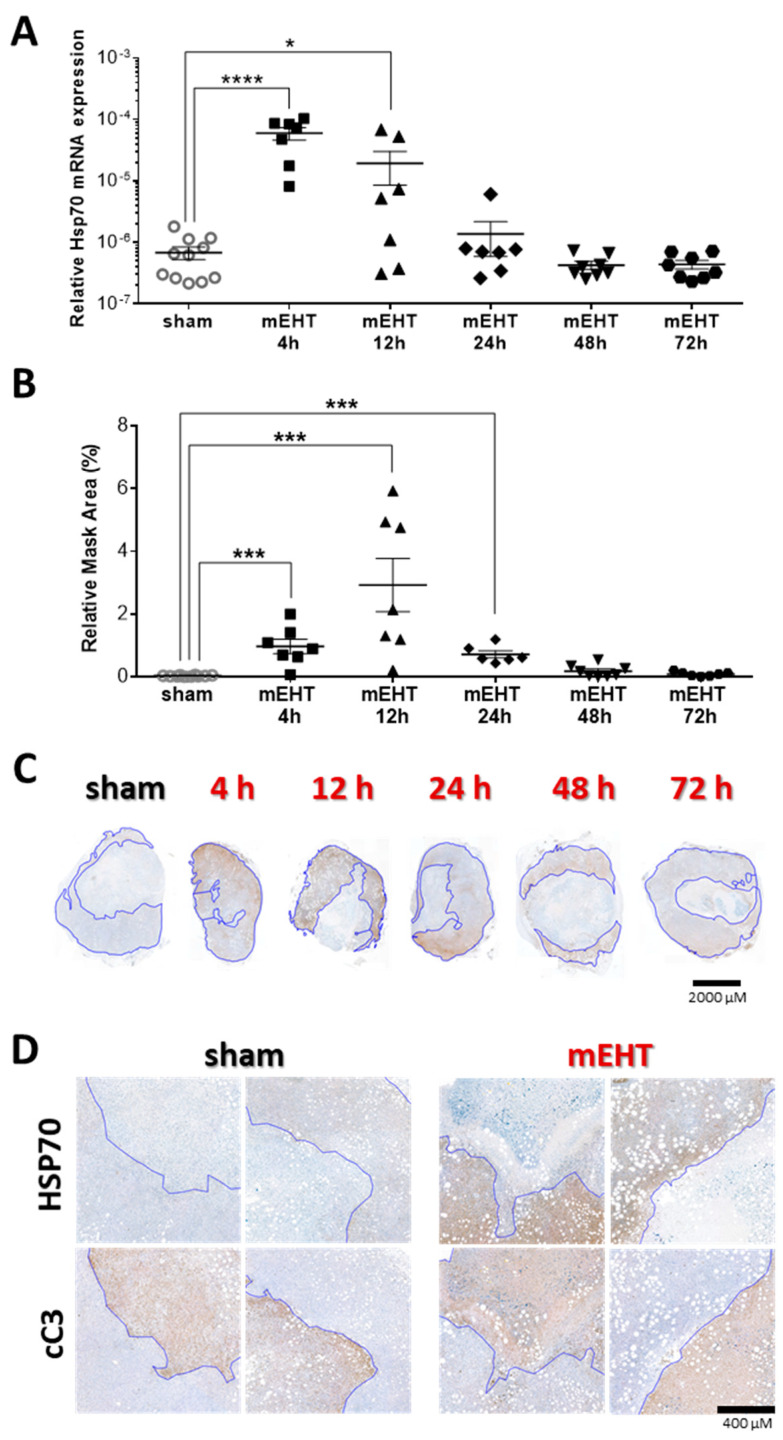
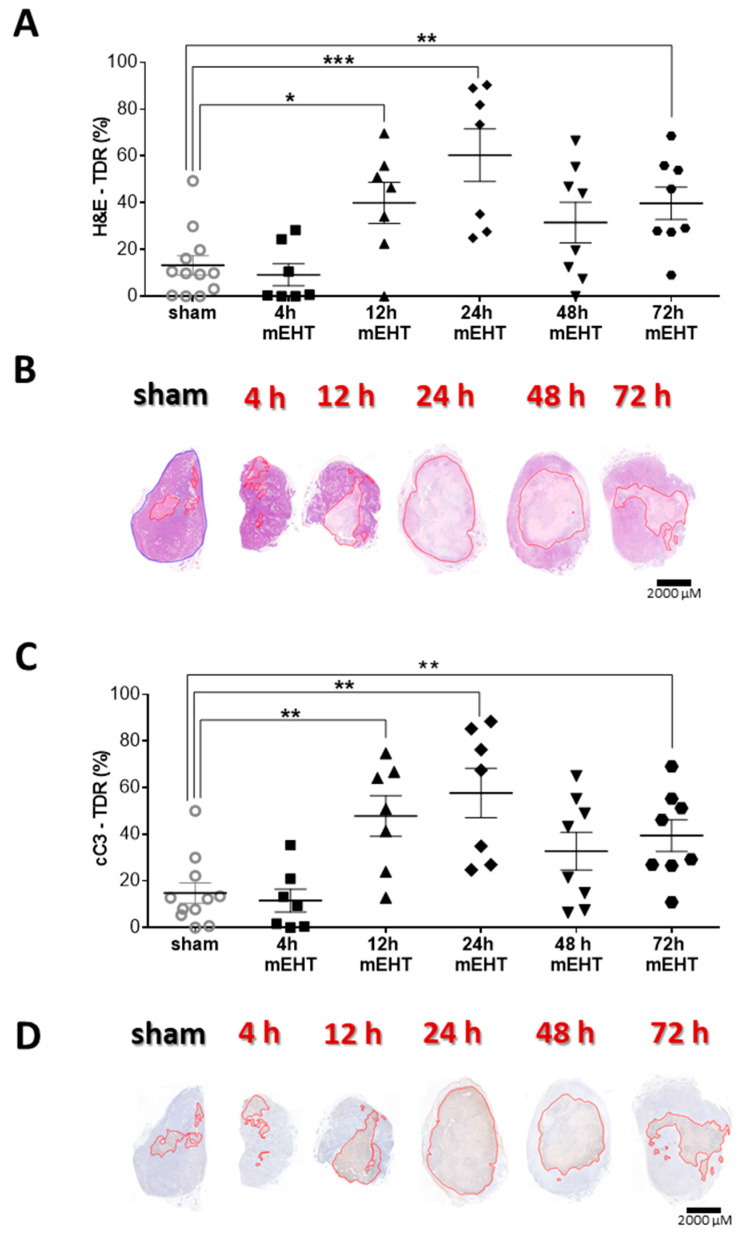
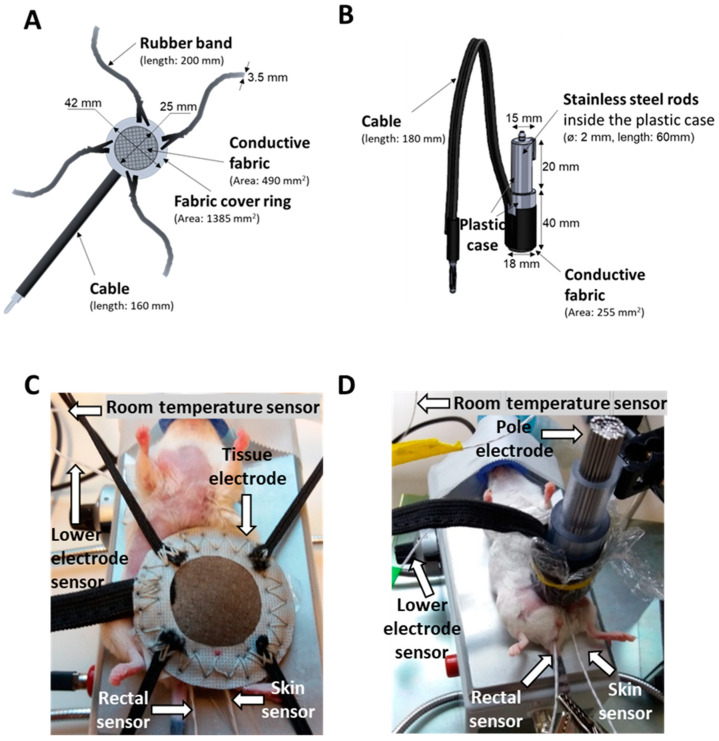
Modulated electro-hyperthermia (mEHT) is a complementary antitumor therapy applying capacitive radiofrequency at 13.56 MHz. Here we tested the efficiency of mEHT treatment in a BALB/c mouse isograft model using the firefly luciferase-transfected triple-negative breast cancer cell line, 4T1. Tumors inoculated orthotopically were treated twice using a novel ergonomic pole electrode and an improved mEHT device (LabEHY 200) at 0.7 ± 0.3 W for 30 min. Tumors were treated one, two, or three times every 48 h. Tumor growth was followed by IVIS, caliper, and ultrasound. Tumor destruction histology and molecular changes using immunohistochemistry and RT-qPCR were also revealed. In vivo, mEHT treatment transitionally elevated Hsp70 expression in surviving cells indicating heat shock-related cell stress, while IVIS fluorescence showed a significant reduction of viable tumor cell numbers. Treated tumor centers displayed significant microscopic tumor damage with prominent signs of apoptosis, and major upregulation of cleaved/activated caspase-3-positive tumor cells. Serial sampling demonstrated substantial elevation of heat shock (Hsp70) response twelve hours after the treatment which was exhausted by twenty-four hours after treatment. Heat shock inhibitors Quercetin or KRIBB11 could synergistically amplify mEHT-induced tumor apoptosis in vitro. In conclusion, modulated electro-hyperthermia exerted a protective heat shock response as a clear sign of tumor cell stress. Exhaustion of the HSR manifested in caspase-dependent apoptotic tumor cell death and tissue damage of triple-negative breast cancer after mEHT monotherapy. Inhibiting the HSR synergistically increased the effect of mEHT. This finding has great translational potential.

Keywords: BALB/C mouse; heat-shock protein-70; isogenic mouse cancer; modulated electro-hyperthermia (mEHT); triple-negative breast cancer (TNBC).


Conflict of interest statement

The authors declare no conflict of interest.

Figures

Figure 1
Figure 1
Comparison of LabEHY-100 tissue electrode and LabEHY-200 pole electrode. (A) LabEHY-100 with tissue electrode: skin-, rectal-, heating pad- and room-temperatures and applied power during treatment. Representative recording from 1 treatment; (B) LabEHY-200 with pole electrode: skin-, rectal-, heating pad-, and room-temperatures and applied power during treatment. Representative recording from 1 treatment; (C) temperature recordings from 12 mEHT and 12 sham treatments with LabEHY-200 and pole electrode. n = 12/group, Mean ± SEM.
Figure 2
Figure 2
Selective warming of the tumor tissue. (A) Temperature curves of the tumor, skin, and rectum during mEHT-treatment (n = 5). (B) Temperature gradient between the tumor core and skin above the tumor (n = 5). Mean ± SEM. (C,D) Temperature of skin (C) or rectum (D) vs. tumor core during treatment. Average and box and whiskers: min to max, **** p < 0.0001.
Figure 3
Figure 3
The effects of modulated electro-hyperthermia (mEHT) on tumor size. (A,B) Total fluorescent flux measured by IVIS 24 h before and after two mEHT treatments; (CE) Tumor volumes after two mEHT treatments, measured by a digital caliper (C) ultrasound (D) and tumor weight after removal (E) (n = 6/group); (F,G) Total fluorescent flux measured by IVIS before and after one mEHT treatment, at day 0, 3, 5, and 7; (H,I) Tumor volume after one mEHT treatment, measured by a digital caliper (H) and ultrasound (I). (nsham = 4, nmEHT = 6. Mean ± SEM; (A,F) two-way ANOVA, Bonferroni correction, ** p < 0.01; (CE,H,I) Mann–Whitney test.
Figure 4
Figure 4
mEHT-induced tumor destruction. (A,B) Tumor destruction 24 h after two mEHT treatments. (A) Tumor destruction ratio (TDR) evaluated on hematoxylin-eosin (H&E) stained sections; (B) Apoptotic areas (red contour) and Matrigel® (blue contour) on representative H&E stained sections; (C) Matrigel® and damaged tumor areas on H&E stained sections (Magnification: 36×); (D) representative image of intact vs. damaged area and Matrigel® (magnified from the H&E section: B/black rectangle, magnification: 8.5×); (E,F) Tumor destruction 24 h after one mEHT treatment; (E) TDR evaluated on H&E stainings; (F) Apoptotic areas (red contour) and Matrigel (blue contour) on representative H&E stained sections. Mean ± SEM, Mann–Whitney test, n = 6/group, * p = 0.0174.
Figure 5
Figure 5
Ki67 expression 24 h after two mEHT treatments. (A) Number of all cell nuclei in the intact tumor area; (B) Ki67 staining in the viable tumor tissue (blue assigned areas), representative sections; (C) Number of strong Ki67-positive nuclei; (D) Ki67 mRNA expression in tumor tissue (normalized to 18 S rRNA). Mean ± SEM, unpaired t-test, n = 6/group, * p = 0.0494.
Figure 6
Figure 6
mEHT-induced tumor destruction was cleaved caspase-3 mediated. (A,B) Tumor destruction 24 h after two mEHT treatments. (A) Tissue destruction ratio (TDR) evaluated in cleaved caspase-3 (cC3) stained sections; (B) Apoptotic areas (red contour) and Matrigel® (blue contour) on representative cC3-stained sections and consecutive H&E stained sections. (C) Matrigel® and damaged tumor areas on cC3 and H&E stained sections (Magnification: 36×); (D) Representative images of intact vs. damaged area and Matrigel® (magnified from H&E and cC3 sections: B/black rectangles, magnification: 8.5×); (E,F) Tumor destruction 24 h after one mEHT treatment; (E) TDR evaluated on cC3 stainings; (F) Apoptotic areas (red contour) and Matrigel (blue contour) on representative cC3-stained sections and consecutive H&E-stained sections. Mean ± SEM, Mann–Whitney test, n = 6/group, ** p = 0.0020.
Figure 7
Figure 7
Heat shock protein 70 (Hsp70) expression in tumor tissue 24 h after two mEHT treatments. (A) Representative cC3- and Hsp70-stained sections with high and low magnification. The damaged area is cC3-positive (marked with *). The living area is cC3-negative (marked with #). Red line: the border between the damaged and living area. The Hsp70 expression was measured in the living area (marked with *). Blue line: borders of the living area; (B) Relative Hsp70-stained mask area of the viable tumor tissue; (C) Hsp70 mRNA expression (normalized to 18S rRNA); Mean ± SEM, Mann-Whitney test, n = 6/group, **** p < 0.0001.
Figure 8
Figure 8
Time kinetics of Hsp70 expression after three mEHT treatments. (A) Hsp70 mRNA expression of the tumors at different time-points after treatment; (B) Area-proportional expression of Hsp70 protein at different time points after treatment; (C) Representative tumor images from the sham and mEHT groups; (D) High-magnification images of cC3 and Hsp70 stainings from sham and mEHT treated tumors. Blue line marks the border between live and damaged tumor area assigned based on the cC3-stainings, (Magnification: 5×); (A,B) sham vs. mEHT, unpaired Mann–Whitney test. Mean ± SEM, * p = 0.03, *** p < 0.001, **** p < 0.0001.
Figure 9
Figure 9
Time kinetics of tumor tissue destruction after mEHT. (A) Quantification of tumor destruction ratio (TDR %) on hematoxylin-eosin (H&E)-stained tumors; (B) Representative images of H&E-stained sections from sham and mEHT-treated tumors from 4, 12, 24, 48, and 72 h after 3 treatments. Red lines mark the damaged area; (C) Quantification of TDR % on cC3 stained sham and mEHT treated tumors; (D) Representative images of cC3-stained sections from sham- and mEHT-treated tumors. Red lines mark the damaged area; (A,C) unpaired Mann–Whitney test. Mean ± SEM, n = 6–12/group, * p < 0.05, ** p < 0.01, *** p < 0.001.
Figure 10
Figure 10
Synergistic effect of mEHT and heat shock inhibitors. 4T1 cells pre-treated with heat shock response inhibitors, Quercetin or KRIBB11, or vehiculum (DMSO) for 1 h before mEHT (42 °C, 30 min) treatment. (A) Resazurin viability assay, 24 h post-mEHT, viability expressed as percent of control (37 °C, vehiculum only). (B) Hsp70 mRNA 2 h post- mEHT, normalized to 18S rRNA. Two-way ANOVA, Mean ± SEM, n = 5–12/group, * p < 0.05, ** p < 0.01, *** p < 0.001, **** p < 0.0001.
Figure 11
Figure 11
Modulated electro-hyperthermia small animal treatment device. (A) LabEHY-100 device and the treating setup: temperature-controlled (heated) lower electrode and tissue electrode (upper electrode). (B) LabEHY-200 device and the newly developed treating setup: temperature-controlled (heated) lower electrode and position-adjustable pole electrode (upper electrode).
Figure 12
Figure 12
Comparison of the mEHT treatment setups. Schematic diagram and dimensions of the (A,C) previously used tissue electrode and (B,D) improved pole electrode. Animal on the lower electrode with (A,C) the tissue electrode and (B,D) the pole electrode. The electromagnetic field was established between the lower electrode and the upper electrode positioned on the tumor. The temperature at the four locations is monitored by temperature sensors (rectal, skin, lower electrode, and background).
Figure 13
Figure 13
In vitro treatment setup.

Similar articles

Cited by

References

    1. McGuire S. World Cancer Report 2014. Geneva, Switzerland: World Health Organization, International Agency for Research on Cancer, WHO Press, 2015. Adv. Nutr. 2016;7:418–419. doi: 10.3945/an.116.012211. - DOI - PMC - PubMed
    1. Foulkes W.D., Smith I.E., Reis-Filho J.S. Triple-negative breast cancer. N. Engl. J. Med. 2010;363:1938–1948. doi: 10.1056/NEJMra1001389. - DOI - PubMed
    1. Den Brok W.D., Speers C.H., Gondara L., Baxter E., Tyldesley S.K., Lohrisch C.A. Survival with metastatic breast cancer based on initial presentation, de novo versus relapsed. Breast Cancer Res. Treat. 2017;161:549–556. doi: 10.1007/s10549-016-4080-9. - DOI - PubMed
    1. Vancsik T., Kovago C., Kiss E., Papp E., Forika G., Benyo Z., Meggyeshazi N., Krenacs T. Modulated electro-hyperthermia induced loco-regional and systemic tumor destruction in colorectal cancer allografts. J. Cancer. 2018;9:41–53. doi: 10.7150/jca.21520. - DOI - PMC - PubMed
    1. Meggyeshazi N., Andocs G., Balogh L., Balla P., Kiszner G., Teleki I., Jeney A., Krenacs T. DNA fragmentation and caspase-independent programmed cell death by modulated electrohyperthermia. Strahlenther. Onkol. 2014;190:815–822. doi: 10.1007/s00066-014-0617-1. - DOI - PubMed