. 2020 Sep 10;12(9):2580.
doi: 10.3390/cancers12092580.

FUT9-Driven Programming of Colon Cancer Cells towards a Stem Cell-Like State

Affiliations

FUT9-Driven Programming of Colon Cancer Cells towards a Stem Cell-Like State

Athanasios Blanas et al. Cancers (Basel). .

Abstract

Cancer stem cells (CSCs) are located in dedicated niches, where they remain inert to chemotherapeutic drugs and drive metastasis. Although plasticity in the CSC pool is well appreciated, the molecular mechanisms implicated in the regulation of cancer stemness are still elusive. Here, we define a fucosylation-dependent reprogramming of colon cancer cells towards a stem cell-like phenotype and function. De novo transcriptional activation of Fut9 in the murine colon adenocarcinoma cell line, MC38, followed by RNA seq-based regulon analysis, revealed major gene regulatory networks related to stemness. Lewisx, Sox2, ALDH and CD44 expression, tumorsphere formation, resistance to 5-FU treatment and in vivo tumor growth were increased in FUT9-expressing MC38 cells compared to the control cells. Likewise, human CRC cell lines highly expressing FUT9 displayed phenotypic features of CSCs, which were significantly impaired upon FUT9 knock-out. Finally, in primary CRC FUT9+ tumor cells pathways related to cancer stemness were enriched, providing a clinically meaningful annotation of the complicity of FUT9 in stemness regulation and may open new avenues for therapeutic intervention.

Keywords: colon cancer; drug resistance; fucosylation; glycosylation; pluripotency; stem cells.


Conflict of interest statement

The authors declare no conflict of interest.

Figures

Figure 1
Figure 1
Identification of gene regulatory networks linking FUT9 expression to stemness in glyco-engineered colon cancer cells. (A) RT-PCR-based assessment of mRNA levels of murine fucosyltransferases (FUT) upon transcriptional activation of the Fut9 gene in MC38 cells using the CRISPR-dCas9-VPR technology. Expression was normalized to the housekeeping gene Gapdh (M. musculus). Differences (fold change) relative to MC38-MOCK cells are depicted in triplicates. Data representative of two independent experiments. (B) Western blot analysis for FUT9 in MC38-glycovariants. Data representative of two independent experiments. (C) Flow cytometric analysis of the Lewisx expression on the surface of MC38 glyco-engineered cells. Histograms representative of two independent experiments. (D) Representative images of anti-Lewisx immunofluorescence staining in MC38-MOCK and MC38-FUT9 cells. DAPI staining represents nucleic acid (nuclear) staining. Scale bar 10 μm. (E) Venn diagram depicting the number of differentially expressed genes (DEGs) between MC38-WT vs. MC38-MOCK and MC38-FUT9 vs. MC38-MOCK cells identified by RNA-seq analysis. In MC38-FUT9 cells compared to MC38-MOCK cells, 1709 genes were upregulated and 1874 genes were downregulated. (F) The top 3 of the predicted transcription factors (TFs) identified by the RNA-seq-based regulon analysis (iRegulon) corresponding to the upregulated genes (top panel) and the downregulated genes (lower panel) in MC38-FUT9 cells. NES represents the normalized enrichment score. The number of the predicted direct targets among DEGs and the significantly enriched motifs corresponding to each regulator is provided in the table. More details on the motifs and TF-associated genes can be found in Tables S2–S5. (G) Normalized counts of the top regulators identified with iRegulon. Statistical significance was assessed using the Benjamini–Hochberg false discovery rate (FDR) <0.05 (* p < 0.05, ** p < 0.01 and *** p < 0.001). (H,I) Regulatory networks for the upregulated (H) and downregulated (I) genes found in MC38-FUT9 cells reveal a strong overlap among the regulons and the predicted TFs. Direct targets (DEGs) are in grey circle nodes and TFs in white circle nodes. Regulons for each TF are represented by the different line colors. # indicates the gRNA number.
Figure 2
Figure 2
FUT9 neo-expression in MC38 cells results in an enhanced stem cell-like transcriptional profile and phenotype (A,B) Expression of DEGs associated with the Wnt pathway (A) or stem cell maintenance (B) in the MC38-MOCK and MC38-FUT9-expressing cells. Sox2 is highlighted in red. (C) Intracellular staining of Sox2 in MC38 cells using flow cytometry (left; n = 3). (D) Fold change in mean fluorescent intensity (MFI) of Sox2 in MC38-FUT9 cells compared to MC38-MOCK cells (n = 3). Statistical significance was determined by an unpaired Student’s t test. (E) ALDH activity in MC38-MOCK and MC38-FUT9 cells cultured either in 2D (left panel) or 3D (right panel), measured using the ALDEFLUOR assay. The DEAB inhibitor of ALDH was used as a control for gating and further analysis of the percentage of ALDH-High cells in each condition. Dotplots are representative of three independent experiments. (F) Fold change in the percentage of ALDH-High cells in the MC38-glycovariants upon 2D (n = 3) or 3D (n = 3) cultures (relative to MC38-MOCK cells). Statistical differences were determined by an unpaired Student’s t test (** p < 0.01). (G) Relative expression (MFI) of CD44 in MC38 cells cultured in 2D (n = 3) or 3D (n = 3). Statistical significance was determined by a one way ANOVA (ns; no significance, ** p < 0.01).
Figure 3
Figure 3
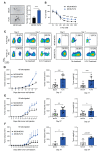
MC38-FUT9 cells display functional properties of cancer stem-like cells. (A) Representative images (left) and quantification (right) of tumorspheres formed by MC38 cells during 3D culture. Error bars represent SD. Data are representative of three independent experiments. Statistical significance was determined by an unpaired Student’s t test (*** p < 0.001). Scale bar 100 μm. (B) Viability of MC38-glycovariants upon treatment with indicated concentrations of 5-fluoruracil (5-FU) in 3D culture for 7 days. The percentage of living cells was determined using the CTB fluorometric assay and values were normalized to the corresponding concentration DMSO treatment for each cell line. Error bars represent SD; n = 3. Statistical significance was determined by multiple Student’s t tests (*** p < 0.001). (C) Cancer stem cell (CSC)-enrichment assay using flow cytometric analysis of the Lewisx antigen expression on the surface of MC38 cells cultured in 3D either alone (right panel; MC38-MOCK and MC38-FUT9) or in a heterogeneous cell suspension (left panel; FUT9-High Mix and FUT9-Low Mix) in the presence or absence of 5-FU treatment. (DF) MC38-MOCK and MC38-FUT9 cells were injected under the skin (left and right flank, respectively) of NSG mice (10 mice per group) at different absolute numbers, 105 (D), 104 (E) and 103 (F), and tumor growth was monitored over time (left panel). The tumor volume during the last measurement (middle panel) and the weight of the isolated tumors (right panel) at day 17, 27 or 34 are depicted. Measurements correspond to the mice that developed both a MC38-MOCK and MC38-FUT9 tumor. Statistical differences were determined by an unpaired Student’s t test (* p < 0.05, ** p < 0.01 and *** p < 0.001).
Figure 4
Figure 4
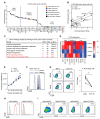
FUT9 expression in human colon cancer cell lines is correlated with high levels of Sox2 expression and ALDH activity. (A) Classification of human colon cancer cell lines based on FUT9 gene expression levels. Data were obtained from the Cancer Cell Line Encyclopedia (CCLE) database. The corresponding molecular subtype for each cell line (if known) is provided [50]. (B) Correlation between FUT9 and Sox2 gene expression in the subgroup of FUT9-High human colon cancer cell lines. (C) Gene Ontology Analysis in FUT9-High human colon cancer cells depicting all the statistically significant (p < 0.05) groups. (D) Relative surface expression (MFI) of type II Lewis antigens (Lewisx, Lewisy, sialyl Lewisx and VIM2) on the surface of selected FUT9-High/Medium/Low human colon cancer cell lines, measured by flow cytometry. MFI values were normalized to the binding of the secondary antibody alone. (E) Cell proliferation of KM12 and HCT116 cells cultured in 2D at different absolute numbers as determined by the CTB fluorometric assay. Error bars represent SD; n = 3. Statistical differences were determined by an unpaired Student’s t test (ns; no significance). (F) Flow cytometric analysis of intracellular Sox2 expression in KM12 and HCT116 cells cultured in 2D. Dotted lines represent staining with the secondary antibody alone, whereas solid lines represent Sox2 staining. (G) Representative dotplots (left) and quantification (right) of ALDH activity in KM12 and HCT116 cells cultured in 2D, measured by the ALDEFLUOR assay. The DEAB inhibitor of ALDH was used as a control for gating and further analysis of the percentage of ALDH-High cells for each condition (n = 4). Statistical differences were determined by an unpaired Student’s t test (** p < 0.01). (H) Flow cytometric analysis of Lewisx expression on the surface of KM12 cells glyco-engineered with CRISPR-Cas9. Grey lines represent staining with the second antibody only, red lines represent Lewisx staining. Numbers in red represent the MFI values for Lewisx staining normalized to the binding of the second antibody only. Histograms representative of two independent experiments are shown. (I) Representative dotplots of ALDH activity in KM12-MOCK and KM12-FUT9 KO cells measured by the ALDEFLUOR assay. The DEAB inhibitor of ALDH was used as a control for gating and the percentage of ALDH-High cells was calculated for each cell line.
Figure 5
Figure 5
FUT9-specific transcriptional programming of cancer stemness in primary CRC tumor cells. (A) Clustering of CRC patient-derived normal and tumor epithelial cells based on FUT9 expression. Expression data were obtained from a previously described single cell-RNA seq analysis [56] and were further analyzed. (B) Expression of gene sets related to cancer stemness and pluripotency in the generated FUT9+ and FUT9- normal and tumor epithelial clusters.

References

    1. Ferlay J., Colombet M., Soerjomataram I., Mathers C., Parkin D.M., Pineros M., Znaor A., Bray F. Estimating the global cancer incidence and mortality in 2018: GLOBOCAN sources and methods. Int. J. Cancer. 2019;144:1941–1953. doi: 10.1002/ijc.31937. - DOI - PubMed
    1. Guinney J., Dienstmann R., Wang X., de Reynies A., Schlicker A., Soneson C., Marisa L., Roepman P., Nyamundanda G., Angelino P., et al. The consensus molecular subtypes of colorectal cancer. Nat. Med. 2015;21:1350–1356. doi: 10.1038/nm.3967. - DOI - PMC - PubMed
    1. Tsikitis V.L., Malireddy K., Green E.A., Christensen B., Whelan R., Hyder J., Marcello P., Larach S., Lauter D., Sargent D.J., et al. Postoperative surveillance recommendations for early stage colon cancer based on results from the clinical outcomes of surgical therapy trial. J. Clin. Oncol. 2009;27:3671–3676. doi: 10.1200/JCO.2008.20.7050. - DOI - PMC - PubMed
    1. Douillard J.Y., Cunningham D., Roth A.D., Navarro M., James R.D., Karasek P., Jandik P., Iveson T., Carmichael J., Alakl M., et al. Irinotecan combined with fluorouracil compared with fluorouracil alone as first-line treatment for metastatic colorectal cancer: A multicentre randomised trial. Lancet. 2000;355:1041–1047. doi: 10.1016/S0140-6736(00)02034-1. - DOI - PubMed
    1. Giacchetti S., Perpoint B., Zidani R., Le Bail N., Faggiuolo R., Focan C., Chollet P., Llory J.F., Letourneau Y., Coudert B., et al. Phase III multicenter randomized trial of oxaliplatin added to chronomodulated fluorouracil-leucovorin as first-line treatment of metastatic colorectal cancer. J. Clin. Oncol. 2000;18:136–147. doi: 10.1200/JCO.2000.18.1.136. - DOI - PubMed