. 2020 Sep 10;12(9):2582.
doi: 10.3390/cancers12092582.

Isolation and Characterization of Two Novel Colorectal Cancer Cell Lines, Containing a Subpopulation with Potential Stem-Like Properties: Treatment Options by MYC/NMYC Inhibition

Affiliations

Isolation and Characterization of Two Novel Colorectal Cancer Cell Lines, Containing a Subpopulation with Potential Stem-Like Properties: Treatment Options by MYC/NMYC Inhibition

Jan Schulte Am Schulte Am Esch et al. Cancers (Basel). .

Abstract

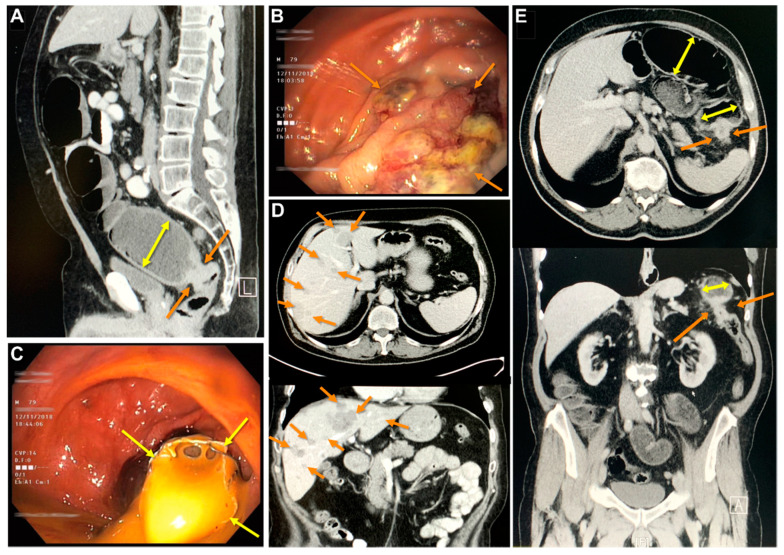
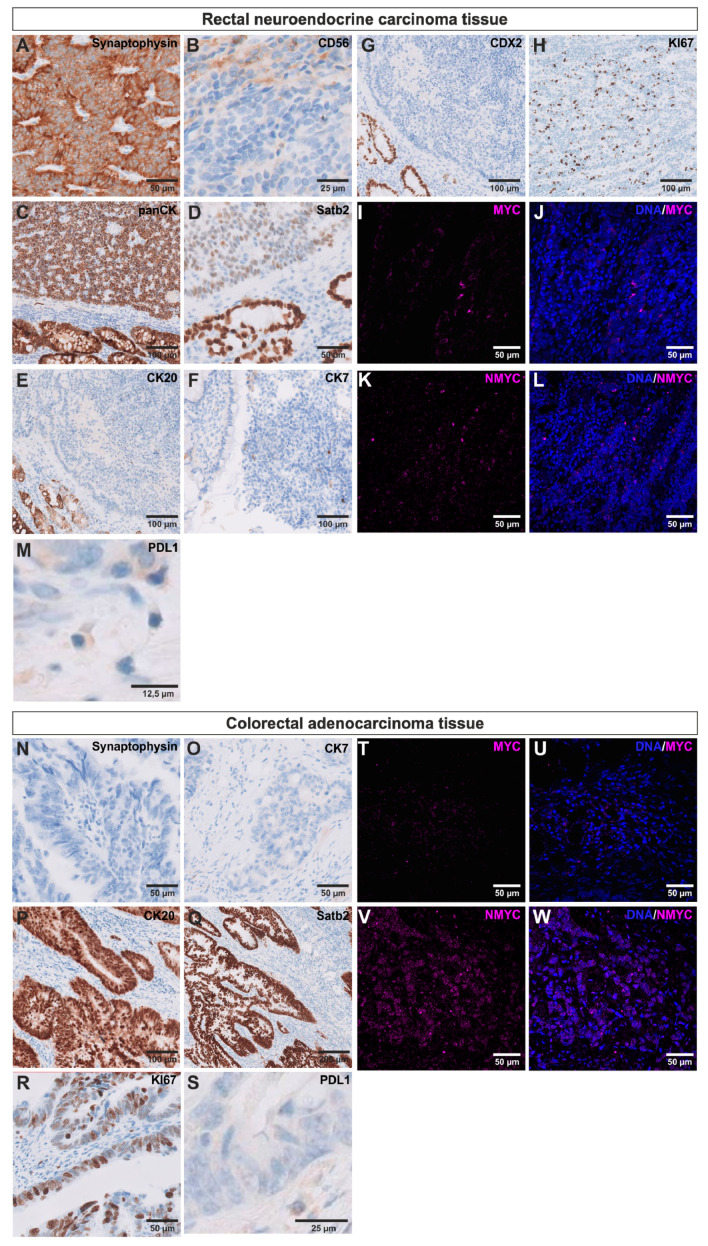
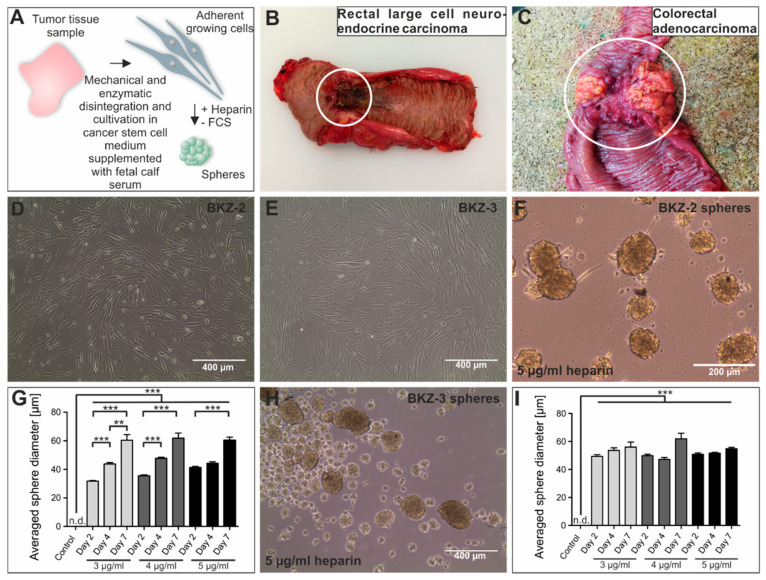
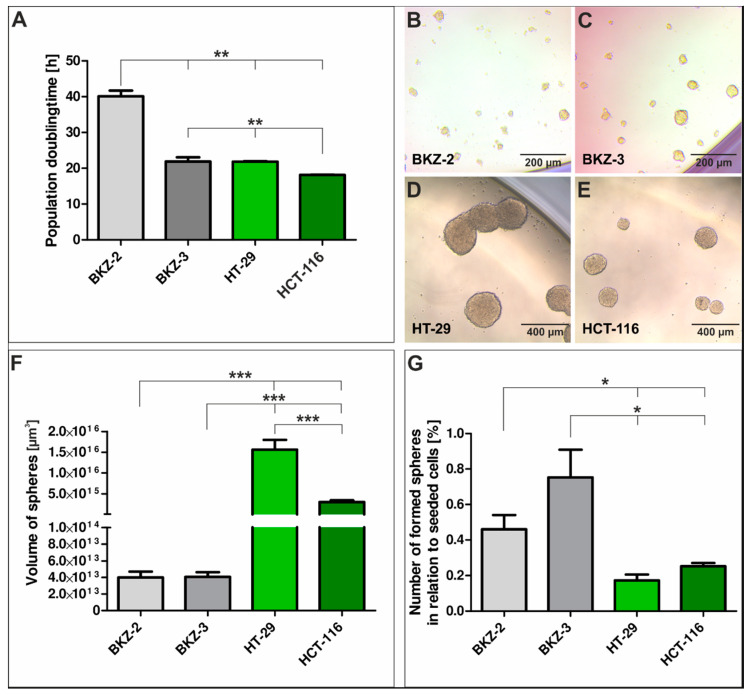
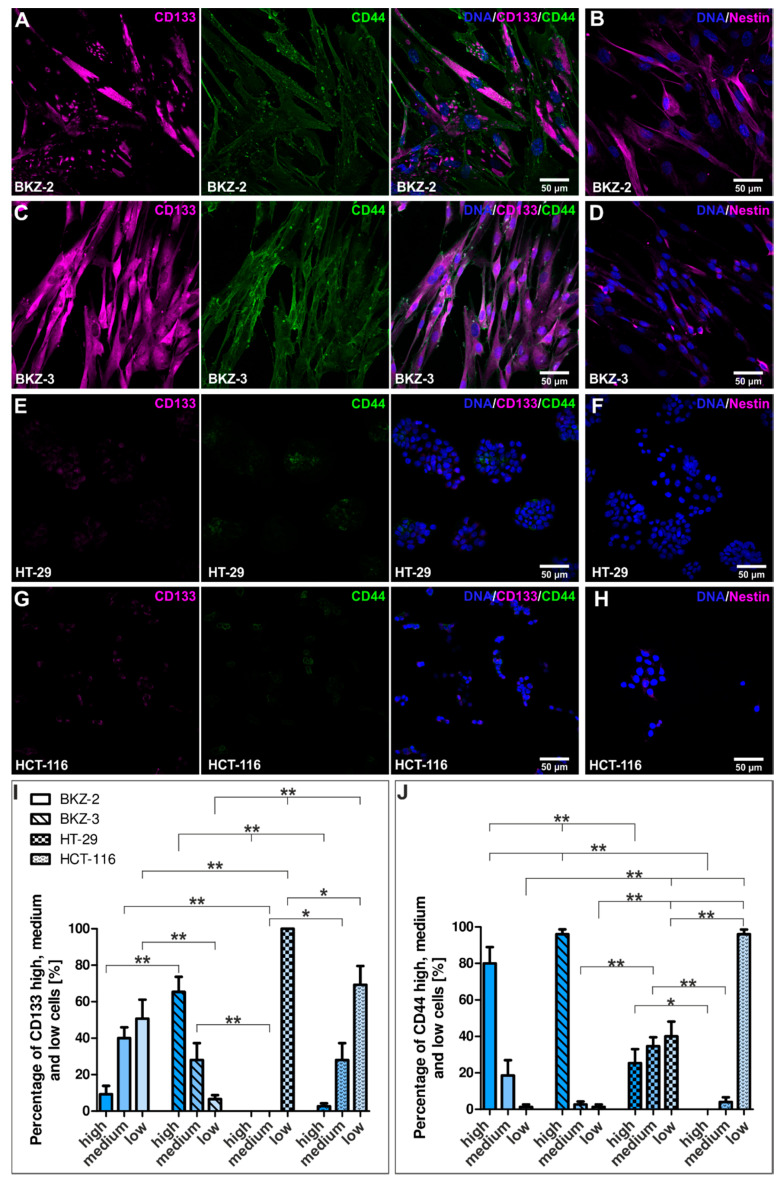
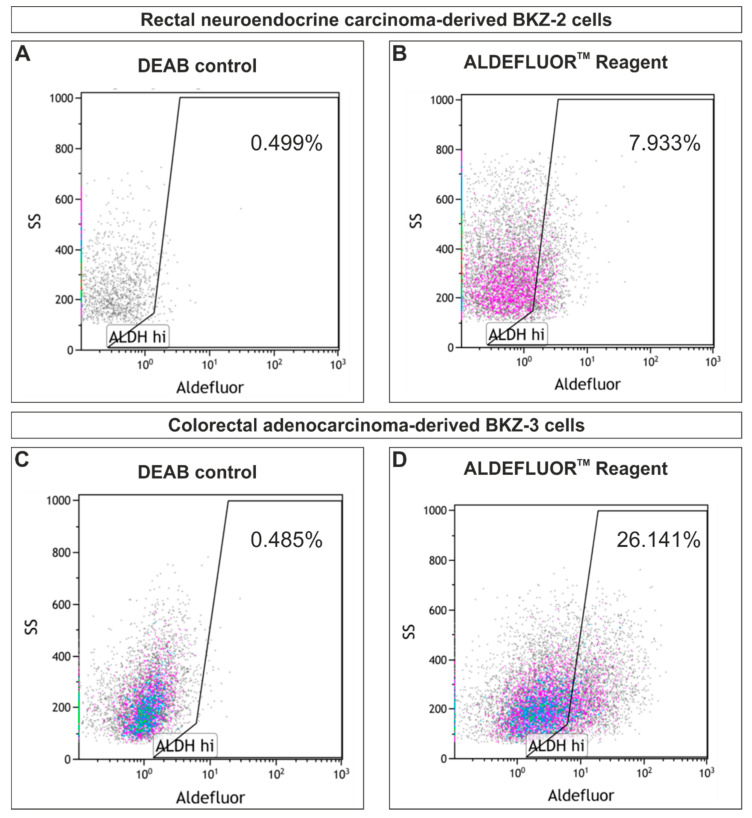
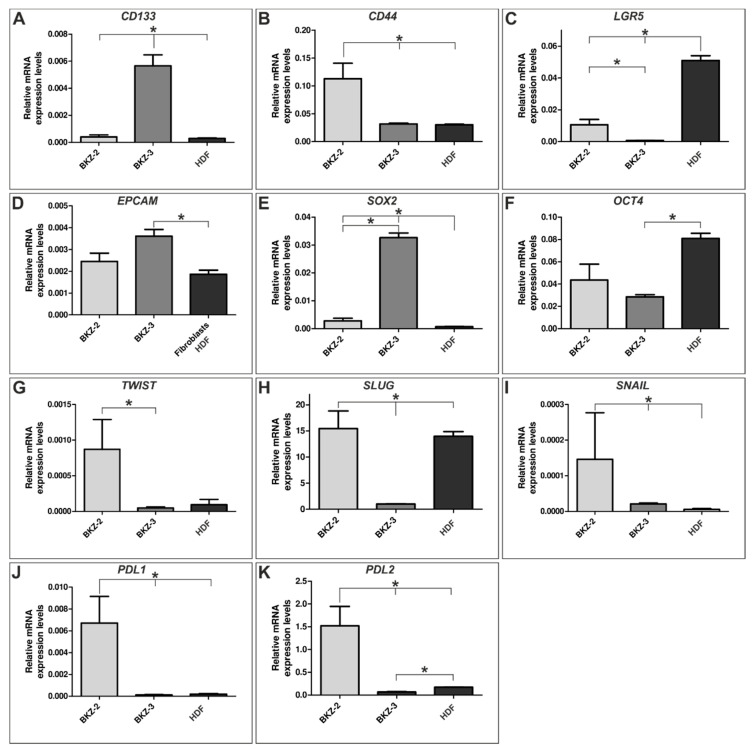
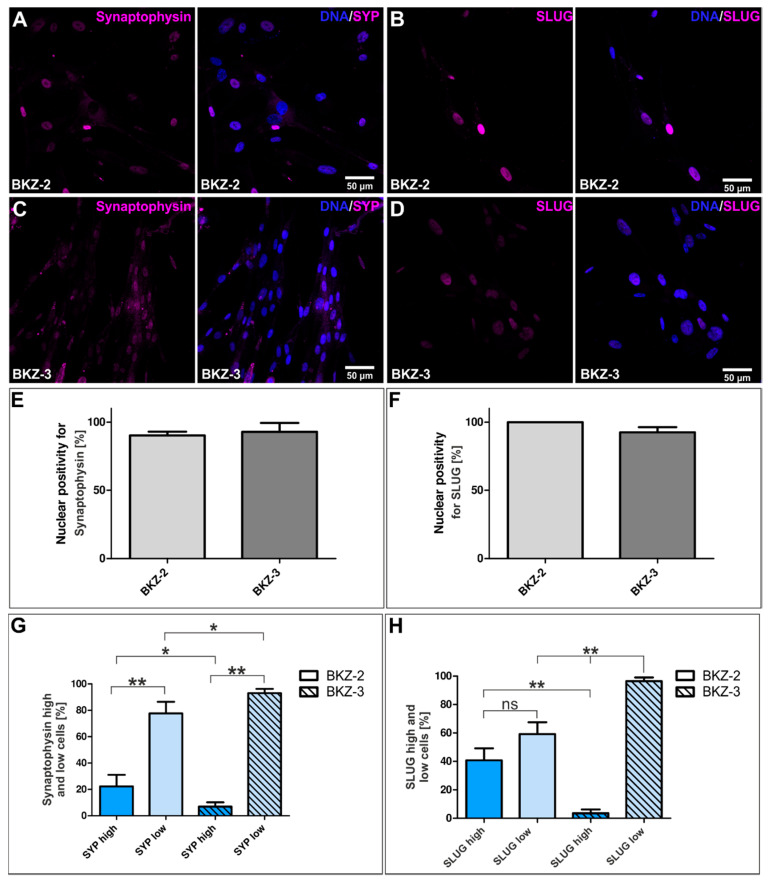
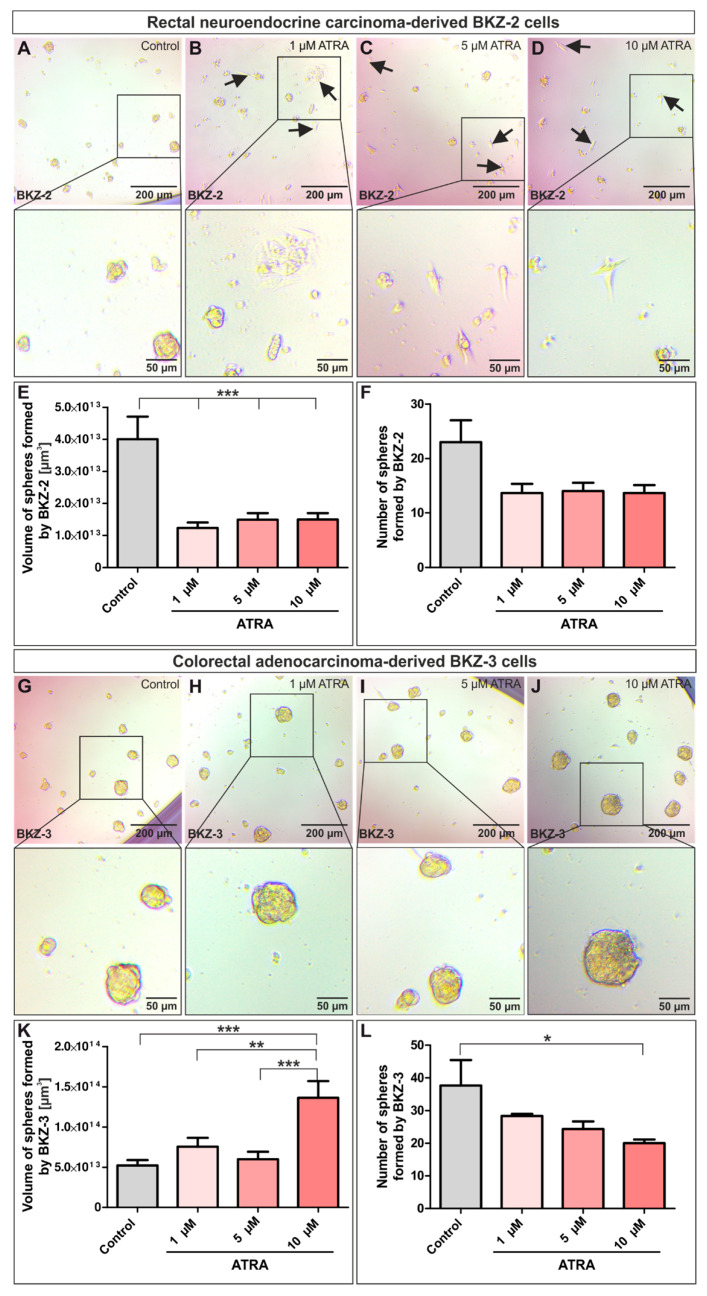
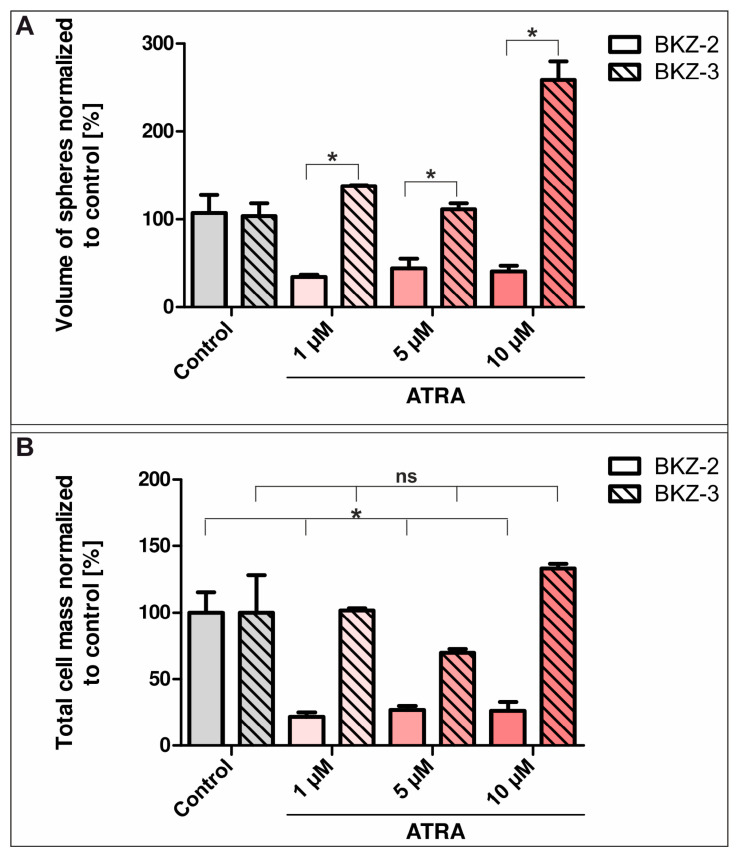
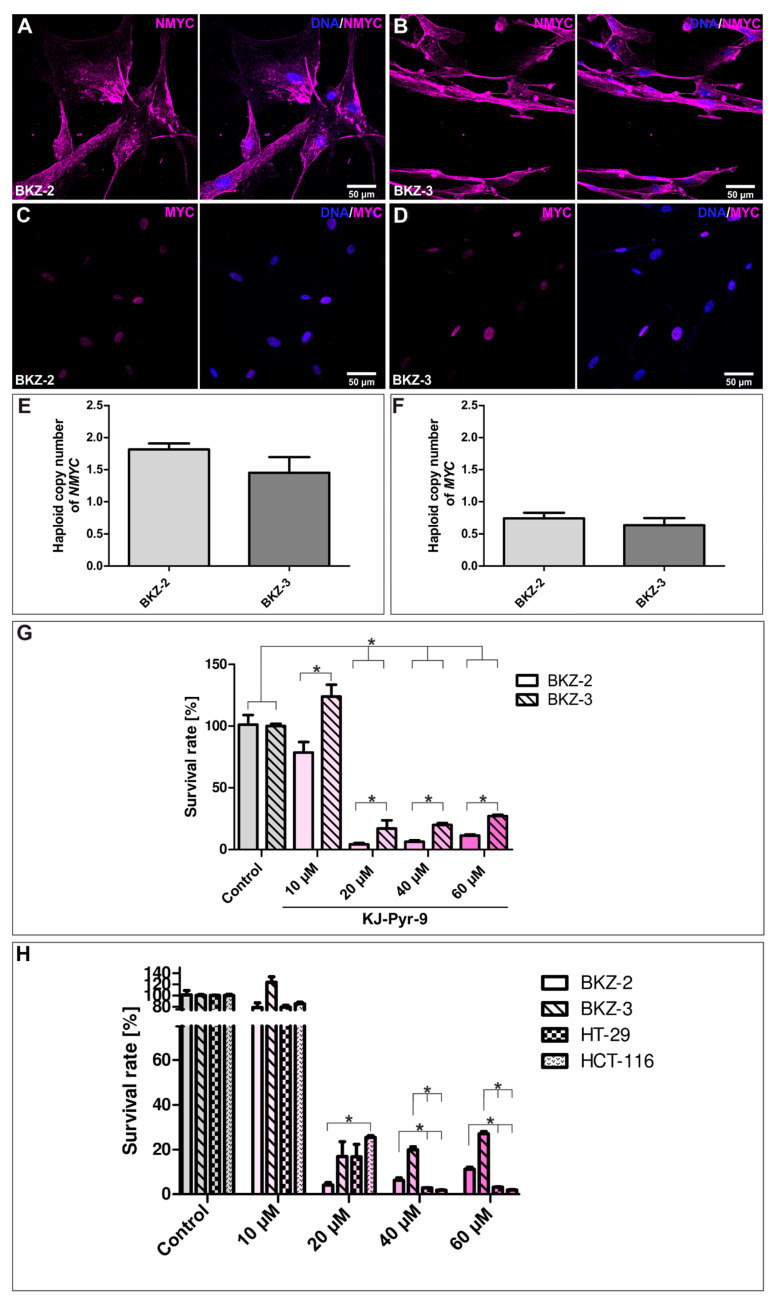
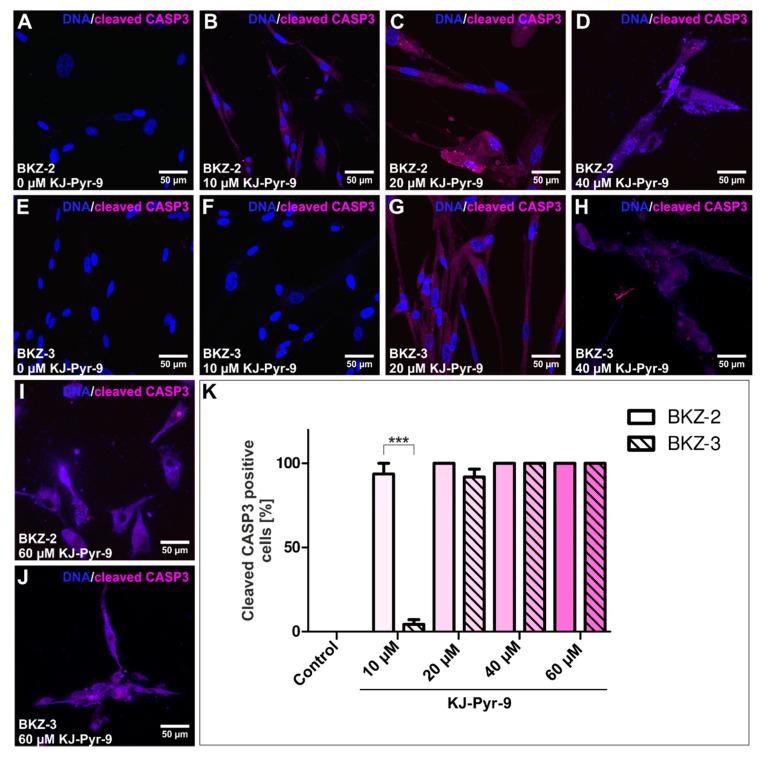
Cancer stem cells (CSC) are crucial mediators of cancer relapse. Here, we isolated two primary human colorectal cancer cell lines derived from a rectal neuroendocrine carcinoma (BKZ-2) and a colorectal adenocarcinoma (BKZ-3), both containing subpopulations with potential stem-like properties. Protein expression of CSC-markers prominin-1 and CD44 antigen was significantly higher for BKZ-2 and BKZ-3 in comparison to well-established colon carcinoma cell lines. High sphere-formation capacity further confirmed the existence of a subpopulation with potential stem-like phenotype. Epithelial-mesenchymal transition markers as well as immune checkpoint ligands were expressed more pronounced in BKZ-2. Both cell populations demonstrated N-myc proto-oncogene (NMYC) copy number gain. Myc proto-oncogene (MYC)/NMYC activity inhibitor all-trans retinoic acid (ATRA) significantly reduced the number of tumor spheres for both and the volume of BKZ-2 spheres. In contrast, the sphere volume of ATRA-treated BKZ-3 was increased, and only BKZ-2 cell proliferation was reduced in monolayer culture. Treatment with KJ-Pyr-9, a specific inhibitor of MYC/NMYC-myc-associated factor X interaction, decreased survival by the induction of apoptosis of both. In summary, here, we present the novel colorectal cancer cell lines BKZ-2 and BKZ-3 as promising cellular in vitro models for colorectal carcinomas and identify the MYC/NMYC molecular pathway involved in CSC-induced carcinogenesis with relevant therapeutic potential.

Keywords: ATRA; EMT; KJ-Pyr-9; MYC; NMYC; colorectal adenocarcinoma; colorectal cancer stem cells; rectal neuroendocrine carcinoma.


Conflict of interest statement

The authors declare no conflict of interest.

Figures

Figure 1
Figure 1
Clinical imaging derived from the two donors of the colorectal cancer cell lines. Patient BKZ-2: (A) Computerized tomography (CT)-scan with demonstration of a rectal stenotic mass (orange arrows) with pre-stenotic obstructed bowel (yellow double arrow). Endoscopic appearance of carcinoma BKZ-2 (B) with intestinal discharge following (C) endoscopic bowel stenting of the neoplastic stenosis. (D) Staging CT-scan visualizing hepatic metastases (orange arrows). Patient BKZ-3: (E) CT-scan indicating the neoplastic mass of the left colon (orange arrows) with pre-stenotic obstructed bowel (yellow double arrows).
Figure 2
Figure 2
Immunohistochemical characterization of the primary rectal large cell neuroendocrine carcinoma (NEC) and the colorectal adenocarcinoma (AC). NEC tissue was tested positive for (A) Synaptophysin, (B) neural cell adhesion molecule (CD56), (C) epithelial marker pan-cytokeratin (panCK) and (D) special AT-rich sequence-binding protein 2 (SATB2), but was negative for (E) cytokeratin 20 (CK20) and (F) cytokeratin 7 (CK7). Moreover, immunohistological staining for (G) the intestinal differentiation marker homeobox protein CDX2 was negative. (H) Staining for the proliferation marker protein Ki-67 (KI67) revealed 25% positive cells. Further immunohistochemical stainings of the NEC tissue displayed positivity for the (I/J) myc proto-oncogene protein (MYC) and (K/L) N-myc proto-oncogene protein (NMYC). (M) Immunohistochemical staining for programed death ligand 1 (PDL1) revealed only slight expression with 2% of vital tumor cells being positive. AC tissue was tested negative for neuroendocrine marker (N) Synaptophysin and (O) CK7, but was positive for (P) CK20 and (Q) SATB2. AC revealed (R) 50% KI67 highly positive cells and 25% cells with moderate KI67 expression. (S) Immunohistochemical characterization of PDL1 expression displayed 0% positive vital tumor cells, but revealed positivity for both (T/U) MYC and (V/W) NMYC in the AC tissue.
Figure 3
Figure 3
Successful isolation of the rectal large cell neuroendocrine carcinoma (NEC)-derived cancer cell line BKZ-2 and the colorectal adenocarcinoma (AC)-derived cancer cell line BKZ-3. (A) For the isolation of those cell lines that contain a subpopulation of cells with potential stem-like properties a tissue sample of either the (B) rectal large cell NEC or the (C) colorectal AC was obtained, mechanically and enzymatically disintegrated, and cultivated in CSC medium supplemented with fetal calf serum (FCS), leading to (D/E) adherent growing cells. (F/H) Cultivation of the cells with the addition of heparin and in the absence of FCS led to the formation of spheres, further validating stem-like properties of BKZ-2 and BKZ-3. (G/I) Quantification of the averaged sphere diameter showed a significant increase after the addition of heparin in comparison to the control for BKZ-2 and BKZ-3, regardless of the tested heparin concentrations. Moreover, BKZ-2 showed a continuous growth of the spheres over a time-period of one week. Non-parametric Kruskal-Wallis test (p ≤ 0.05), followed by Dunn’s Multiple Comparison post-hoc test. n = 5, *** p ≤ 0.001, ** p ≤ 0.01. Mean ± standard error of the mean (SEM). n.d. = not detectable.
Figure 4
Figure 4
BKZ-2 and BKZ-3 reveal higher population doubling times and formed higher numbers of spheres in comparison to HT-29 and HCT-116. (A) Quantification of the population doubling times of the newly isolated colorectal cancer cell lines BKZ-2 and BKZ-3 as well as the common colon adenocarcinoma cell line HT-29 and colon carcinoma cell line HCT-116 revealed a significantly higher population doubling time for BKZ-2 in comparison to BKZ-3, HT-29 and HCT-116. Moreover, BKZ-3 and HT-29 displayed a significantly higher population doubling time when compared with HCT-116. (BE) All cell populations formed spheres when 5000 cells per 200 μL cancer stem cell (CSC) medium containing 4 μg/mL heparin were cultured in low adhesion 96 well-plates. Quantification of the (F) volume of spheres formed by each cell line showed a significantly higher volume for HT-29 and HCT-116 when compared to BKZ-2 and BKZ-3. Moreover, sphere volume of HT-29 was significantly higher in comparison to HCT-116. Further quantification concerning (G) the number of formed spheres in relation to seeded cells revealed significantly less percent spheres for HT-29 and HCT-116 in comparison to BKZ-2 and BKZ-3. Non-parametric Mann-Whitney-test (p ≤ 0.05). n ≤ 3, *** p ≤ 0.001, ** p ≤ 0.01, * p ≤ 0.05. Mean ± SEM (standard error of the mean).
Figure 5
Figure 5
BKZ-2 and BKZ-3 express higher amounts of prominin-1 (CD133) and CD44 antigen (CD44) in comparison to HT-29 and HCT-116. Immunocytochemical analysis of BKZ-2 and BKZ-3 displayed high positivity for the cancer stem cell (CSC)-markers (A/C) CD133, CD44 and (B/D) Nestin, validating the isolation of two new cell lines that contain a subpopulation of cells with potential stem-like properties. Immunocytochemical analysis of the common colon carcinoma cell lines HT-29 and HCT-116 only displayed slight expression of the CSC-markers (E/G) CD133, CD44 and (F/H) Nestin. Quantification of the percentage of (I) CD133 high, medium and low cells revealed a significantly elevated amount of CD133 high BKZ-3 cells in comparison to BKZ-2, HT-29 and HCT-116. Moreover, the percentage of HT-29 and HCT-116 CD133 low cells was significantly higher when compared to BKZ-2 and BKZ-3. Quantification of (J) CD44 high, medium and low cells displayed for both populations a significantly higher percentage of CD44 high cells in comparison to HT-29 and HCT-116. Non-parametric Kruskal-Wallis equality-of-populations rank test (p ≤ 0.05) followed by Mann-Whitney test (p ≤ 0.05). n = 3, ** p ≤ 0.01, * p ≤ 0.05, ns = not significant. Mean ± SEM (standard error of the mean).
Figure 6
Figure 6
BKZ-2 and BKZ-3 both show aldehyde dehydrogenase (ALDH) activity. Flow-cytometric-analysis of ALDH activity of (B) BKZ-2 and (D) BKZ-3 revealed 7.993% ALDH high cells for BKZ-2 and 26.141% ALDH high cells for BKZ-3 in comparison to the appropriate (A/C) control with the specific ALDH inhibitor diethylaminobenzaldehyde (DEAB).
Figure 7
Figure 7
BKZ-2 and BKZ-3 show higher messenger ribonucleic acid (mRNA)-level of cancer stem cell (CSC)- and epithelial-mesenchymal-transition (EMT)-markers as well as immune checkpoint ligands in comparison to human dermal fibroblasts (HDF). Quantitative polymerase chain reaction revealed an expression of CSC-markers (A) prominin-1 (CD133), (B) CD44 antigen (CD44), (C) leucine rich repeat containing G protein-coupled receptor 5 (LGR5), (D) epithelial cell adhesion molecule (EPCAM), (E) SRY-box transcription factor 2 (SOX2) and (F) octamer-binding transcription factor 4 (OCT4) in both cell lines. Comparison of the two cell lines, demonstrated significant differences of the relative mRNA expression for CD133, CD44, LGR5 and SOX2. Further analysis revealed an expression of the key transcription factors of the process of EMT (G) twist family bHLH transcription factor 1 (TWIST), (H) snail family transcriptional repressor 2 (SLUG) and (I) snail family transcriptional repressor 1 (SNAIL), with TWIST and SLUG being significantly different expressed in BKZ-2 and BKZ-3. Moreover, quantification displayed a significantly altered expression of the immune checkpoint ligands (J) programmed death ligand 1 (PDL1) and (K) programmed death ligand 2 (PDL2) in the two cell lines. Non-parametric Mann-Whitney-test (p ≤ 0.05). n = 3, * p ≤ 0.05. Mean ± SEM (standard error of the mean).
Figure 8
Figure 8
BKZ-2 cells reveal higher levels of Synaptophysin (SYP) and snail family transcriptional repressor 2 (SLUG) protein in comparison to BKZ-3 cells. Immunocytochemical stainings revealed the expression of neuroendocrine and cancer stem cell marker (A/C) Synaptophysin as well as the expression of (B/D) SLUG, one of the key transcription factors of the process of epithelial to mesenchymal transition in both populations. (E) Quantification of cells positive for nuclear Synaptophysin revealed a mean of 90.27% for BKZ-2 and 92.92% for BKZ-3. (G) Further classification in Synaptophysin high and low cells, showed a significantly higher amount of Synaptophysin low nuclei in comparison to Synaptophysin high nuclei for both BKZ-2 and BKZ-3. However, BKZ-2 revealed a significantly higher percentage of Synaptophysin high nuclei in comparison to BKZ-3. (F) Quantification of nuclear positivity for SLUG displayed 100% positive cells for BKZ-2 and a mean of 92.57% positive cells for BKZ-3. (H) Comparison of SLUG high and low cells displayed a significantly higher amount of SLUG high cells of BKZ-2 when compared to BKZ-3. Moreover, BKZ-3 cells in general showed a significantly higher percentage of SLUG low cells in comparison to the amount of SLUG high cells. Non-parametric Mann-Whitney-test (p ≤ 0.05). n = 3, ** p ≤ 0.01, * p ≤ 0.05, ns = not significant. Mean ± SEM (standard error of the mean).
Figure 9
Figure 9
All-trans retinoic acid (ATRA) reduce number of BKZ-2 and BKZ-3 formed spheres respectively, but cause opposed effects concerning sphere volume of BKZ-2 and BKZ-3. Cells were cultured in an amount of 5000 cells per 200 μL cancer stem cell (CSC) medium containing 4 μg/mL heparin in a low adhesion 96 well-plate. Medium was supplemented with (A/G) dimethylsulfoxide, (B/H) 1 μM ATRA, (C/I) 5 μM ATRA or (D/J) 10 μM ATRA. (AD) Representative images already display a morphological change of BKZ-2 after the cultivation with 1 μM ATRA, indicated by the adherence of the cells (arrows). Quantification of the (E) volume of spheres formed by BKZ-2 cells showed a significant decrease after ATRA-treatment. Further quantification concerning (F) the number of spheres revealed a tendency for fewer spheres after ATRA-treatment for BKZ-2. (GJ) Representative images of BKZ-3 spheres and quantification of the (K) volume of spheres formed by BKZ-3 cells showed a significant increase subsequent to treatment with 10 μM ATRA. Further quantification concerning the (L) number of spheres revealed a significant decrease of the number of spheres after the treatment with 10 μM ATRA. Non-parametric Mann-Whitney-test (p ≤ 0.05). n = 3, *** p ≤ 0.001, ** p ≤ 0.01, * p ≤ 0.05. Mean ± SEM (standard error of the mean).
Figure 10
Figure 10
All-trans retinoic acid (ATRA)-treatment reduced total cell mass of BKZ-2 formed spheres, but does not have an effect on total cell mass of BKZ-3 formed spheres. Analysis of the quantification of the (A) volume of the spheres formed by the two colorectal cancer cell lines revealed a significant difference after ATRA-treatment. ATRA-treatment led to the formation of significant bigger spheres formed by BKZ-3 in comparison to BKZ-2. Further quantification of (B) the total cell mass revealed a significantly decreased cell mass for BKZ-2 upon ATRA stimulation, while the total cell mass of BKZ-3 was not altered. Non-parametric Mann-Whitney-test (p ≤ 0.05). n = 3, * p ≤ 0.05, ns = not significant. Mean ± SEM (standard error of the mean).
Figure 11
Figure 11
Inhibition of the myc proto-oncogene protein (MYC) and N-myc proto-oncogene protein (NMYC) significantly decreases the survival rate of BKZ-2 and BKZ-3 cells. Immunocytochemical staining revealed a strong expression of the oncogene (A/B) NMYC, as well as a nuclear expression of the oncogene (C/D) MYC, in both BKZ-2 and BKZ-3 on protein level. Evaluation of the haploid copy number of the two oncogenes, demonstrated a two-fold increase of the haploid copy number of (E) NMYC, but a normal haploid copy number for (F) MYC within both cell lines. To investigate the influence of the MYC/NMYC inhibitor KJ-Pyr-9 on the proliferation, 3000 cells per 100 μL cancer stem cell medium were cultured in a 96 well for 120 h with the inhibitor or dimethylsulfoxide and 10% fetal calf serum. Afterwards, metabolism was measured using OranguTM (Cell Guidance Systems, Cambridge, UK) and cell count was determined by using a standard curve. (G) Normalized survival rate was quantified and significantly decreased after exposure to values greater than 20 μM of KJ-Pyr-9 in comparison to the control for BKZ-2 and BKZ-3. Further comparisons between the two cell lines displayed a significant decrease of the survival rate of BKZ-2 in comparison to BKZ-3 for all inhibitor concentrations. (H) Although comparison of survival rates after KJ-Pyr-9-treatment showed significantly higher survival of HCT-116 when compared to BKZ-2 after 20 μM K-Pyr-9, cell survival of BKZ-2 and BKZ-3 was significantly improved in comparison to HT-29 and HCT-116 after treatment with inhibitor concentrations over 40 μM. Non-parametric Mann-Whitney-test (p ≤ 0.05). n = 3, * p ≤ 0.05. Mean ± SEM (standard error of the mean).
Figure 12
Figure 12
Myc proto-oncogene (MYC)/N-myc proto-oncogene (NMYC) inhibitor KJ-Pyr-9 induces apoptosis of BKZ-2 and BKZ-3. Representative images of immunocytochemical staining for cleaved caspase 3 (CASP3) after KJ-Pyr-9-treatment of (AE) BKZ-2 and (FJ) BKZ-3. (K) Quantification of the percentage of cleaved CASP3 positive cells after the addition of 10 μM KJ-Pyr-9 revealed a significantly higher amount for BKZ-2 with about 94% in comparison to BKZ-3 with about 4%. However, concentrations higher than 40 μM lead to 100% cleaved CASP3 positive cells for BKZ-2 and BKZ-3. Student’s t-test (p ≤ 0.05). n = 3, *** p ≤ 0.001. Mean ± SEM (standard error of the mean).

Similar articles

Cited by

References

    1. Bray F., Ferlay J., Soerjomataram I., Siegel R.L., Torre L.A., Jemal A. Global cancer statistics 2018: GLOBOCAN estimates of incidence and mortality worldwide for 36 cancers in 185 countries. CA Cancer J. Clin. 2018;68:394–424. doi: 10.3322/caac.21492. - DOI - PubMed
    1. Centelles J.J. General aspects of colorectal cancer. ISRN Oncol. 2012;2012:139268. doi: 10.5402/2012/139268. - DOI - PMC - PubMed
    1. Munro M.J., Wickremesekera S.K., Peng L., Tan S.T., Itinteang T. Cancer stem cells in colorectal cancer: A review. J. Clin. Pathol. 2018;71:110–116. doi: 10.1136/jclinpath-2017-204739. - DOI - PubMed
    1. Kim J.J., Park S.S., Lee T.-G., Lee H.-C., Lee S.-J. Large Cell Neuroendocrine Carcinoma of the Colon with Carcinomatosis Peritonei. Ann. Coloproctol. 2018;34:222–225. doi: 10.3393/ac.2018.02.27. - DOI - PMC - PubMed
    1. Saclarides T.J., Szeluga D., Staren E.D. Neuroendocrine cancers of the colon and rectum. Results of a ten-year experience. Dis. Colon Rectum. 1994;37:635–642. doi: 10.1007/BF02054405. - DOI - PubMed