. 2020 Nov 17;142(20):1905-1924.
doi: 10.1161/CIRCULATIONAHA.120.050281. Epub 2020 Sep 15.

Metabolic Architecture of Acute Exercise Response in Middle-Aged Adults in the Community

Affiliations

Metabolic Architecture of Acute Exercise Response in Middle-Aged Adults in the Community

Matthew Nayor et al. Circulation. .

Abstract

Background: Whereas regular exercise is associated with lower risk of cardiovascular disease and mortality, mechanisms of exercise-mediated health benefits remain less clear. We used metabolite profiling before and after acute exercise to delineate the metabolic architecture of exercise response patterns in humans.

Methods: Cardiopulmonary exercise testing and metabolite profiling was performed on Framingham Heart Study participants (age 53±8 years, 63% women) with blood drawn at rest (n=471) and at peak exercise (n=411).

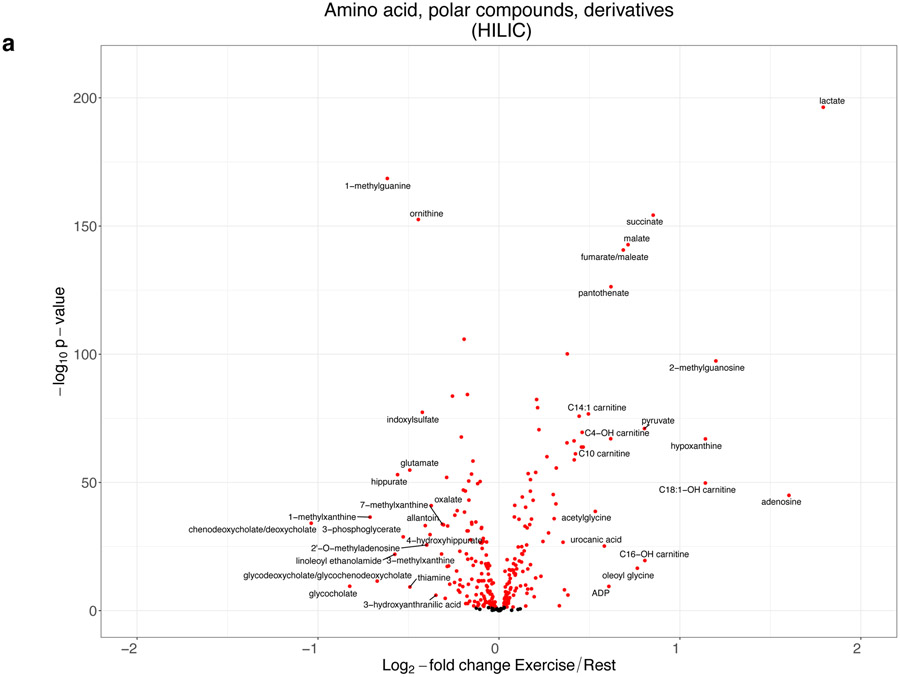
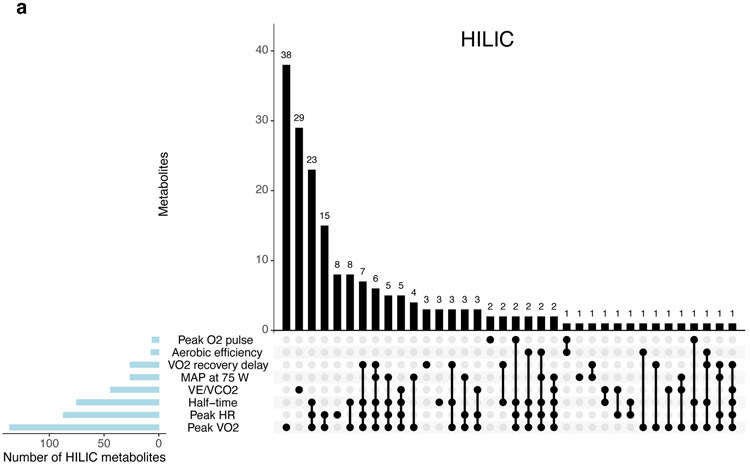
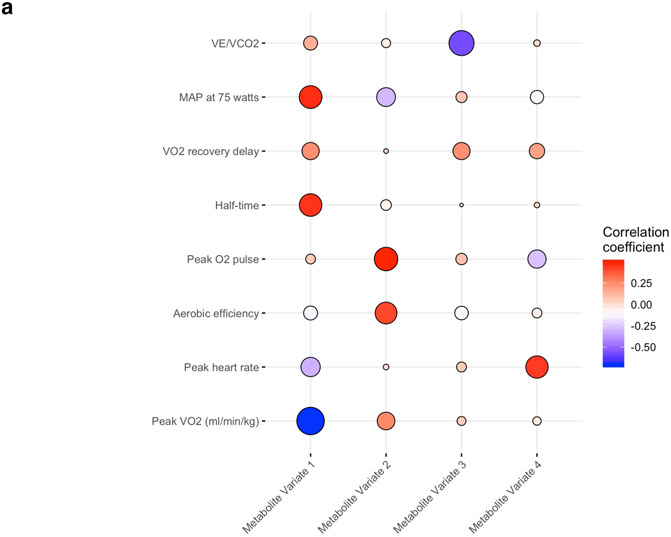
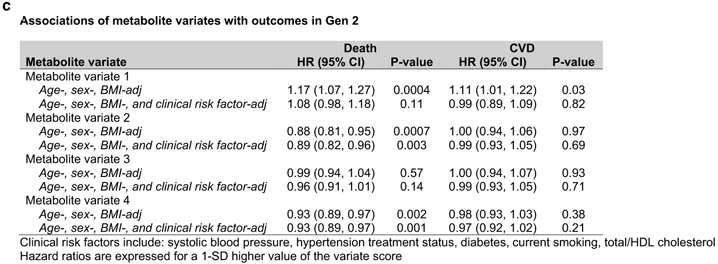
Results: We observed changes in circulating levels for 502 of 588 measured metabolites from rest to peak exercise (exercise duration 11.9±2.1 minutes) at a 5% false discovery rate. Changes included reductions in metabolites implicated in insulin resistance (glutamate, -29%; P=1.5×10-55; dimethylguanidino valeric acid [DMGV], -18%; P=5.8×10⁻¹⁸) and increases in metabolites associated with lipolysis (1-methylnicotinamide, +33%; P=6.1×10-67), nitric oxide bioavailability (arginine/ornithine + citrulline, +29%; P=2.8×10-169), and adipose browning (12,13-dihydroxy-9Z-octadecenoic acid +26%; P=7.4×10-38), among other pathways relevant to cardiometabolic risk. We assayed 177 metabolites in a separate Framingham Heart Study replication sample (n=783, age 54±8 years, 51% women) and observed concordant changes in 164 metabolites (92.6%) at 5% false discovery rate. Exercise-induced metabolite changes were variably related to the amount of exercise performed (peak workload), sex, and body mass index. There was attenuation of favorable excursions in some metabolites in individuals with higher body mass index and greater excursions in select cardioprotective metabolites in women despite less exercise performed. Distinct preexercise metabolite levels were associated with different physiologic dimensions of fitness (eg, ventilatory efficiency, exercise blood pressure, peak Vo2). We identified 4 metabolite signatures of exercise response patterns that were then analyzed in a separate cohort (Framingham Offspring Study; n=2045, age 55±10 years, 51% women), 2 of which were associated with overall mortality over median follow-up of 23.1 years (P≤0.003 for both).

Conclusions: In a large sample of community-dwelling individuals, acute exercise elicits widespread changes in the circulating metabolome. Metabolic changes identify pathways central to cardiometabolic health, cardiovascular disease, and long-term outcome. These findings provide a detailed map of the metabolic response to acute exercise in humans and identify potential mechanisms responsible for the beneficial cardiometabolic effects of exercise for future study.

Keywords: exercise; metabolomics; prevention & control.


Figures

Figure 1.
Figure 1.. The response of the circulating metabolome to acute exercise.
Panels (A-C) display a series of volcano plots of the change in individual metabolites with exercise for different metabolite platforms. Red indicates metabolite levels that are significant at a 5% FDR level. Metabolites are labeled arbitrarily. Of note, inosine is not displayed in the HILIC plot for visualization purposes, as it had an extreme increase with exercise (log2-fold change = 3.2, raw P=5.70x10−111). The full fold-change and significance levels are shown in Table II in the Supplement. Panel (D) displays selected ratios indicative of distinct metabolic phenotypes, including allantoin/urate (related to oxidative stress), kynurenine/tryptophan (related to higher indoleamine 2,3-dioxygenase activity and systemic inflammation), phenylalanine/tyrosine (related to higher inflammation), arginine/[ornithine + citrulline] (related to greater nitric oxide synthesis, improved endothelial function, and lower metabolic syndrome risk), glutamine/glutamate (related to lower cardiometabolic risk). Bars represent the 95% confidence interval for the log2-fold change. P-values are shown in the diagram. Point estimates are colored red for increasing with exercise and blue for decreasing with exercise. Panel (E) shows a plot of the metabolite log2 fold-change with exercise in the replication sample vs. the derivation sample (Table III in the Supplement). The sizes of the points are proportional to the sum of the log2 fold-change in the derivation and replication samples. The dashed line represents equal fold-change in both replication and derivation (y=x). Colors refer to: 1) green, significant (at 5% FDR) with same directionality in both samples; 2) red, significant (at 5% FDR) with opposite directionality in both samples; 3) blue, significant (at 5% FDR) in the derivation sample only; 4) magenta, significant (at 5% FDR) in the replication sample only. 2-methylguanosine was not shown due to a greater proportion of levels below the detection limit in the replication vs. derivation sample limiting interpretation.
Figure 2.
Figure 2.. Metabolic architecture of acute exercise.
Panel (A) shows the mean (dot) and 95% confidence interval (bar) for log2 fold-changes across three different BMI strata: lean (BMI <25 kg/m2), overweight (BMI 25 to <30 kg/m2), obese (BMI ≥30 kg/m2). These are crude (unadjusted) fold changes for each metabolite across BMI strata. Metabolites were selected for display based on significance for fold-change with exercise (Table II in the Supplement), significance for BMI in fully adjusted regressions (Tables IV-VI in the Supplement), and curation into pathways of cardiometabolic health (Table 4). Similarly, panel (B) shows the mean (dot) and 95% confidence interval (bar) for log2 fold-changes for men and women. With exercise, women displayed greater reductions in metabolites associated with impaired insulin sensitivity and increased vascular risk and greater increases in cardioprotective free fatty acids. By contrast, men demonstrated higher excursions in metabolites involved in cellular metabolism, likely due to greater muscle mass. Abbreviations: FAs, fatty acids; skel, skeletal
Figure 3.
Figure 3.. Resting metabolite profiles are differentially associated with multi-dimensional physiologic measurements during exercise.
Panels (A-C) display the number of resting metabolite levels (per platform, in columns) that are significantly associated (at a 5% FDR) with combinations of CPET measures (in rows) in age- and sex-adjusted linear regression models. Panel (D) displays the estimated regression coefficients for select metabolites in regressions for three key physiological exercise responses: peak VO2, VE/VCO2 nadir, and MAP at 75 watts. Each CPET variable demonstrates a pattern of associations with metabolites representing distinct physiologic processes as noted. Details of metabolite functions and associations with cardiometabolic traits are shown in Table 4. Asterisks are used to denote statistical significance as follows: * = FDR >0.01 to ≤0.05; ** = FDR >0.001 to ≤0.01; *** = FDR ≤0.001. Raw data for these plots are shown in Table VII-IX in the Supplement. Abbreviations: NO, nitric oxide
Figure 4.
Figure 4.. Correlations of metabolites with integrated exercise responses.
Panel (A) shows the age- and sex-adjusted partial correlations of each exercise measure with metabolite variates determined by canonical correlation analysis. The size of each circle is proportional to the absolute value of the correlation coefficient, and its color represents the directionality of correlation. Panel (B) represents a heatmap of the age- and sex-adjusted partial correlations of metabolites with metabolite variates. The metabolites shown here have a correlation coefficient ≥0.25 with any of the metabolite variates. Panel (C) displays the multivariable-adjusted associations of the four metabolite variates with death and incident CVD.

References

    1. Zaccardi F, O'Donovan G, Webb DR, Yates T, Kurl S, Khunti K, Davies MJ and Laukkanen JA. Cardiorespiratory fitness and risk of type 2 diabetes mellitus: A 23-year cohort study and a meta-analysis of prospective studies. Atherosclerosis. 2015;243:131–137. - PubMed
    1. Kokkinos P Cardiorespiratory Fitness, Exercise, and Blood Pressure. Hypertension. 2014;64:1160–1164. - PubMed
    1. Green DJ, Walsh JH, Maiorana A, Best MJ, Taylor RR and O'Driscoll JG. Exercise-induced improvement in endothelial dysfunction is not mediated by changes in CV risk factors: pooled analysis of diverse patient populations. Am J Physiol Heart Circ Physiol. 2003;285:H2679–H2687. - PubMed
    1. Lewis GD, Farrell L, Wood MJ, Martinovic M, Arany Z, Rowe GC, Souza A, Cheng S, McCabe EL, Yang E, et al. Metabolic signatures of exercise in human plasma. Sci Transl Med. 2010;2:33ra37. - PMC - PubMed
    1. Shah R, Yeri A, Das A, Courtright-Lim A, Ziegler O, Gervino E, Ocel J, Quintero-Pinzon P, Wooster L, Bailey CS, et al. Small RNA-seq during acute maximal exercise reveal RNAs involved in vascular inflammation and cardiometabolic health: brief report. Am J Physiol Heart Circ Physiol. 2017;313:H1162–H1167. - PMC - PubMed

Publication types