

GhCIPK6a increases salt tolerance in transgenic upland cotton by involving in ROS scavenging and MAPK signaling pathways
- PMID: 32928106
- PMCID: PMC7488661
- DOI: 10.1186/s12870-020-02548-4
GhCIPK6a increases salt tolerance in transgenic upland cotton by involving in ROS scavenging and MAPK signaling pathways
Abstract
Background: Salt stress is one of the most damaging abiotic stresses in production of Upland cotton (Gossypium hirsutum). Upland cotton is defined as a medium salt-tolerant crop. Salinity hinders root development, shoots growth, and reduces the fiber quality.
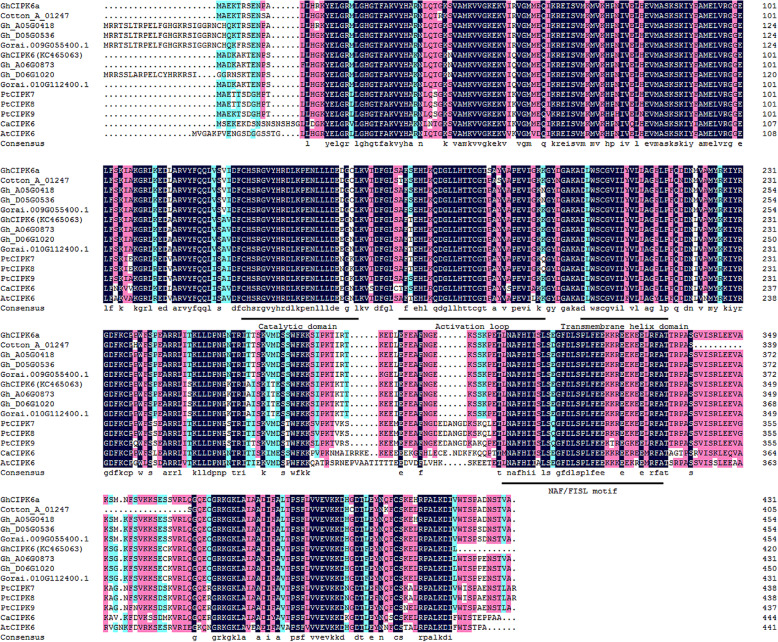
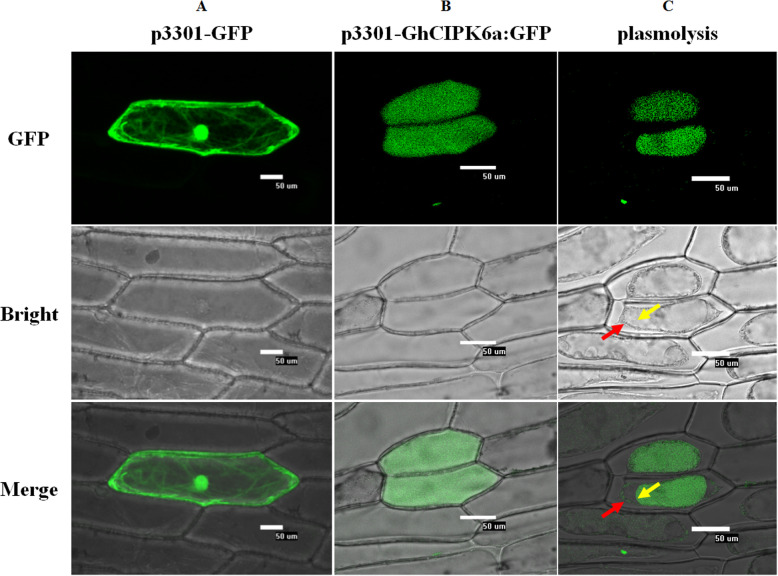
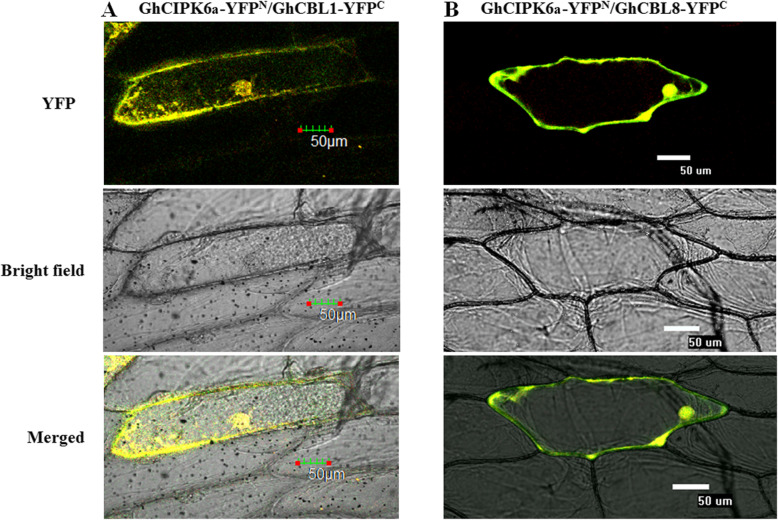
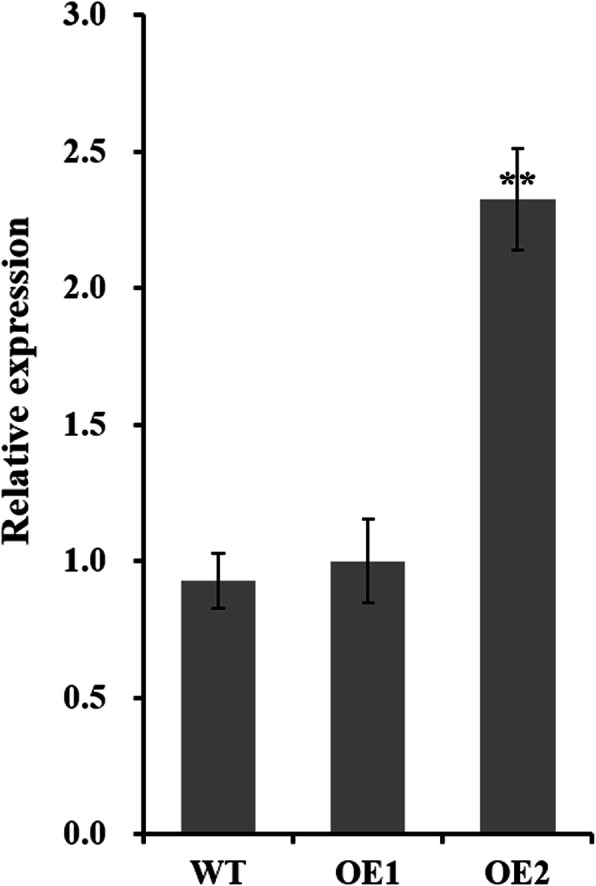
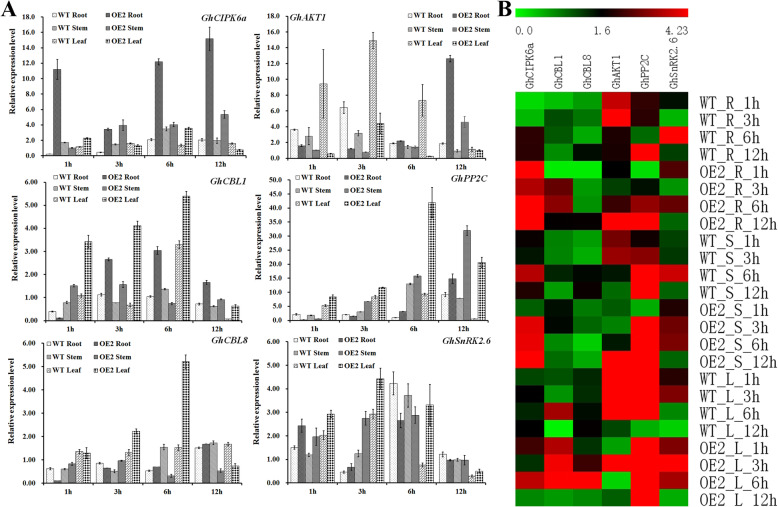
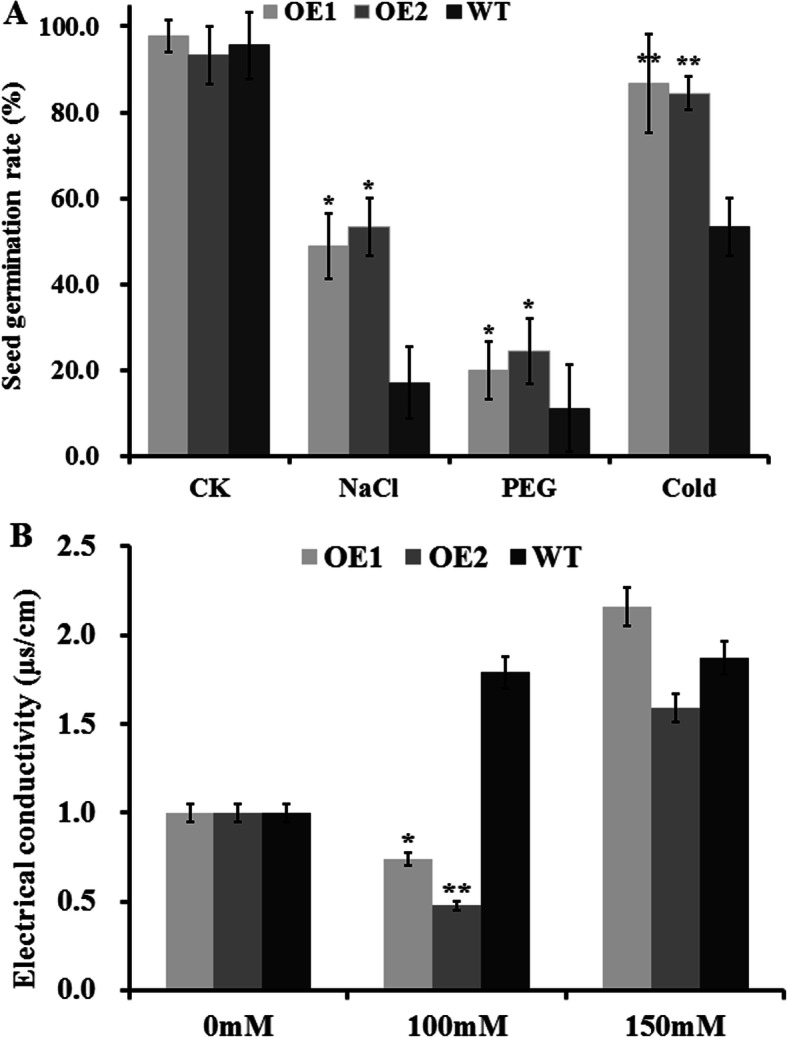
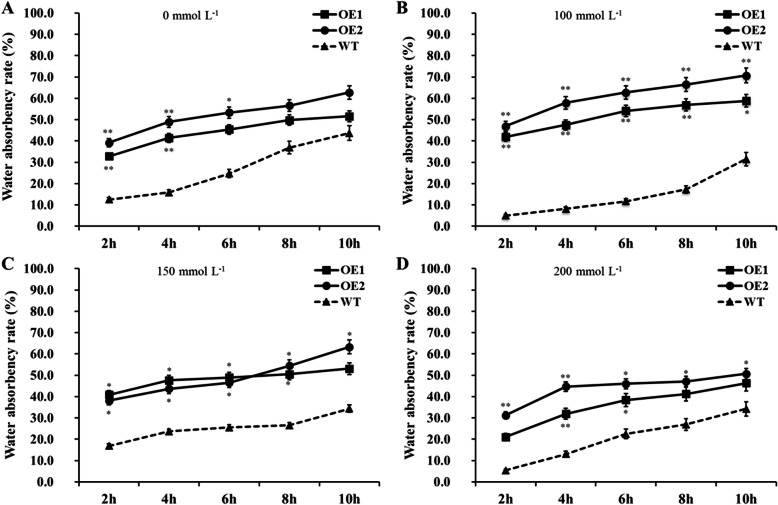
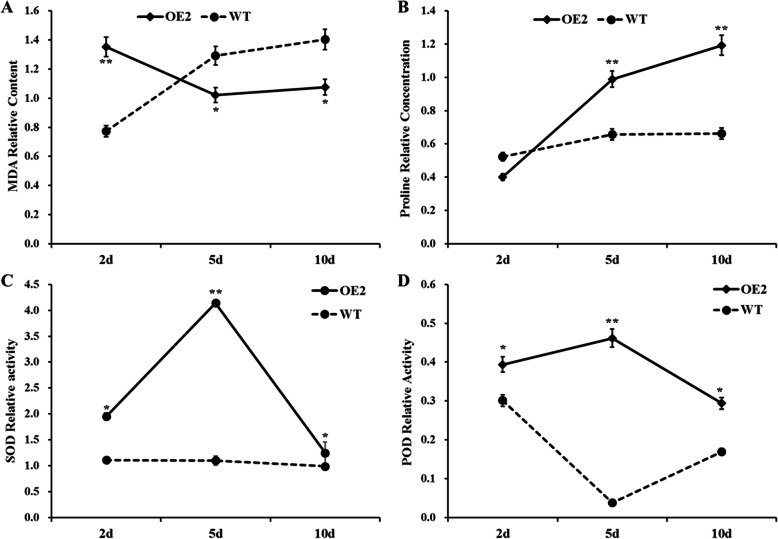
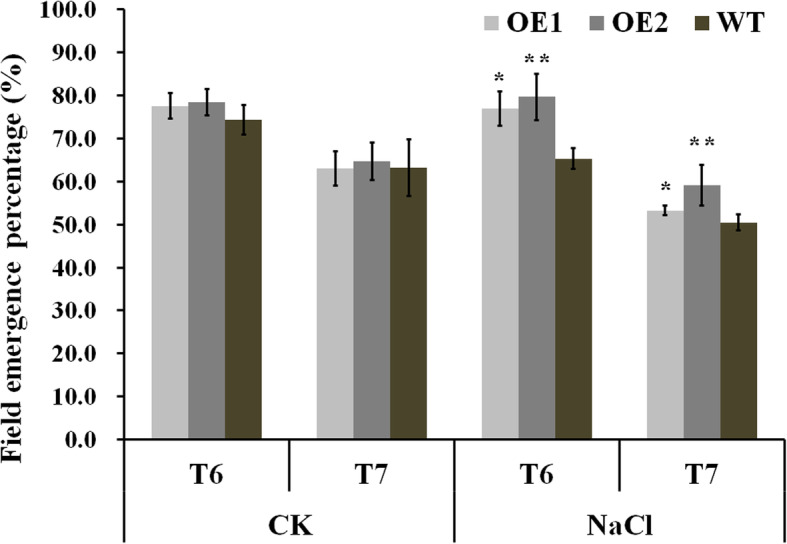
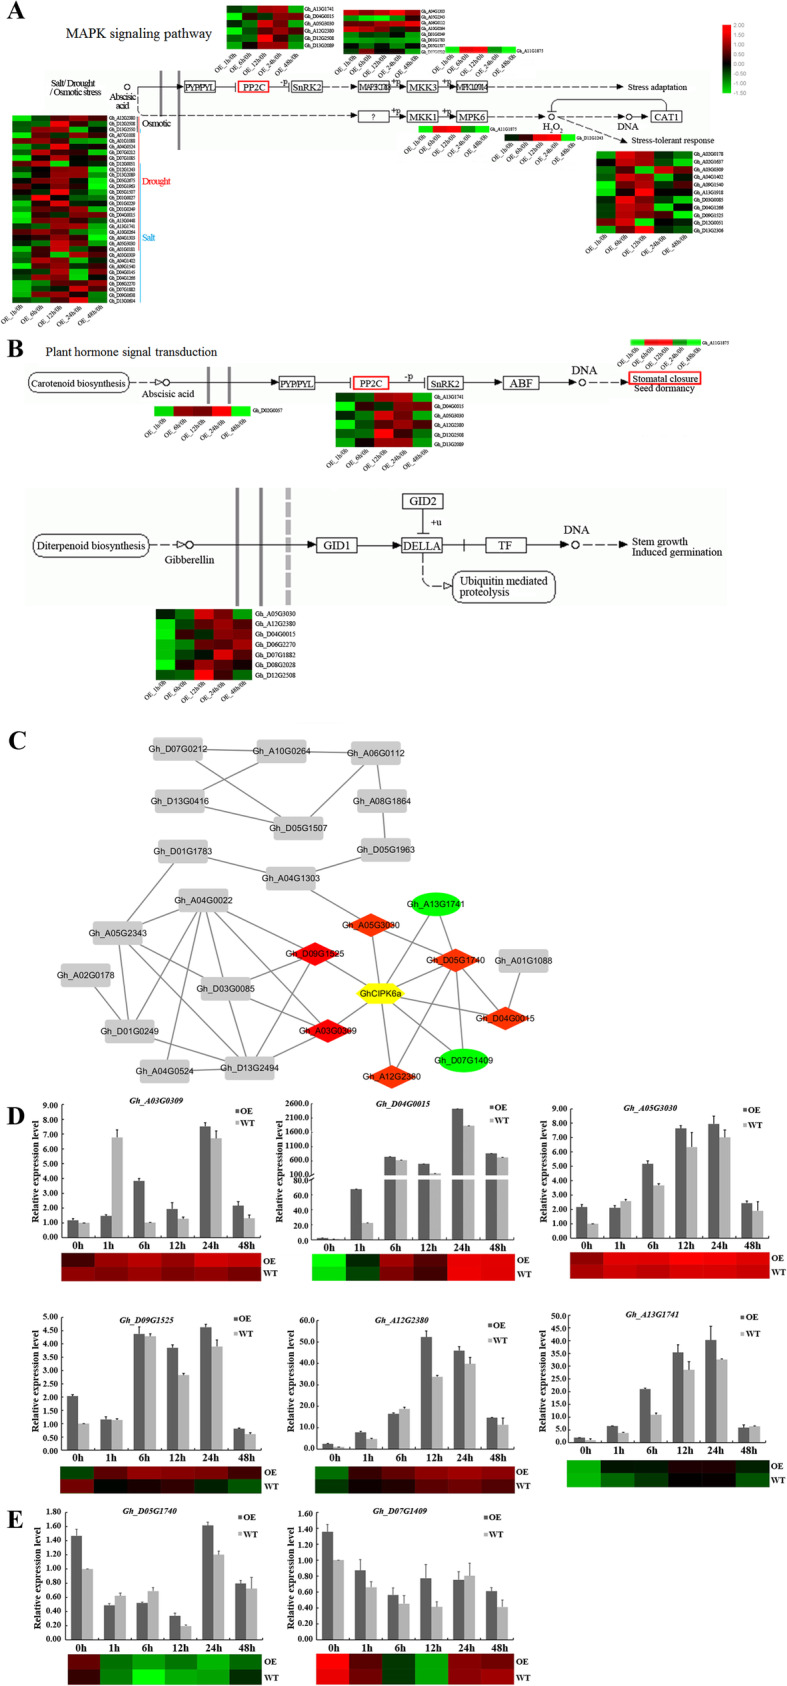
Results: Our previous study verified a GhCIPK6a gene response to salt stress in G. hirsutum. The homologs of GhCIPK6a were analyzed in A2 (G. arboreum), D5 (G. raimondii), and AD1 (G. hirsutum) genomes. GhCIPK6a localized to the vacuole and cell membrane. The GhCBL1-GhCIPK6a and GhCBL8-GhCIPK6a complexes localized to the nucleus and cytomembrane. Overexpression of GhCIPK6a enhanced expression levels of co-expressed genes induced by salt stress, which scavenged ROS and involved in MAPK signaling pathways verified by RNA-seq analysis. Water absorption capacity and cell membrane stability of seeds from GhCIPK6a overexpressed lines was higher than that of wild-type seeds during imbibed germination stage. The seed germination rates and seedling field emergence percentages of GhCIPK6a overexpressed lines were higher than that of control line under salt stress. Moreover, overexpressing of GhCIPK6a in cotton increased lint percentage, and fiber length uniformity under salt stress.
Conclusions: We verified the function of GhCIPK6a by transformation and RNA-seq analysis. GhCIPK6a overexpressed lines exhibited higher tolerance to abiotic stresses, which functioned by involving in ROS scavenging and MAPK pathways. Therefore, GhCIPK6a has the potential for cotton breeding to improve stress-tolerance.
Keywords: CIPK; Co-expression; Salt stress; Signaling pathway; Upland cotton.
Conflict of interest statement
The authors declare that they have no competing interests.
Figures
Similar articles
-
The cotton WRKY transcription factor GhWRKY17 functions in drought and salt stress in transgenic Nicotiana benthamiana through ABA signaling and the modulation of reactive oxygen species production.Plant Cell Physiol. 2014 Dec;55(12):2060-76. doi: 10.1093/pcp/pcu133. Epub 2014 Sep 26. Plant Cell Physiol. 2014. PMID: 25261532
-
Analyzing serial cDNA libraries revealed reactive oxygen species and gibberellins signaling pathways in the salt response of Upland cotton (Gossypium hirsutum L.).Plant Cell Rep. 2015 Jun;34(6):1005-23. doi: 10.1007/s00299-015-1761-5. Epub 2015 Feb 21. Plant Cell Rep. 2015. PMID: 25700980
-
GhEIN3, a cotton (Gossypium hirsutum) homologue of AtEIN3, is involved in regulation of plant salinity tolerance.Plant Physiol Biochem. 2019 Oct;143:83-93. doi: 10.1016/j.plaphy.2019.08.022. Epub 2019 Aug 27. Plant Physiol Biochem. 2019. PMID: 31491703
-
Advances in salt tolerance molecular mechanism in tobacco plants.Hereditas. 2020 Feb 24;157(1):5. doi: 10.1186/s41065-020-00118-0. Hereditas. 2020. PMID: 32093781 Free PMC article. Review.
-
An overview of salinity stress, mechanism of salinity tolerance and strategies for its management in cotton.Front Plant Sci. 2022 Oct 7;13:907937. doi: 10.3389/fpls.2022.907937. eCollection 2022. Front Plant Sci. 2022. PMID: 36275563 Free PMC article. Review.
Cited by
-
Genome-wide identification and analysis of the GUB_WAK_bind gene family in Gossypium hirsutum.Mol Biol Rep. 2022 Jul;49(7):6405-6413. doi: 10.1007/s11033-022-07449-3. Epub 2022 Apr 19. Mol Biol Rep. 2022. PMID: 35441355
-
Overexpression of GhGSTF9 Enhances Salt Stress Tolerance in Transgenic Arabidopsis.Genes (Basel). 2024 May 27;15(6):695. doi: 10.3390/genes15060695. Genes (Basel). 2024. PMID: 38927631 Free PMC article.
-
Two Aquaporin Genes, GhPIP2;7 and GhTIP2;1, Positively Regulate the Tolerance of Upland Cotton to Salt and Osmotic Stresses.Front Plant Sci. 2022 Feb 11;12:780486. doi: 10.3389/fpls.2021.780486. eCollection 2021. Front Plant Sci. 2022. PMID: 35222450 Free PMC article.
-
Regulatory Network of Cotton Genes in Response to Salt, Drought and Wilt Diseases (Verticillium and Fusarium): Progress and Perspective.Front Plant Sci. 2021 Nov 29;12:759245. doi: 10.3389/fpls.2021.759245. eCollection 2021. Front Plant Sci. 2021. PMID: 34912357 Free PMC article. Review.
-
Transcriptome-Wide Identification and Functional Characterization of CIPK Gene Family Members in Actinidia valvata under Salt Stress.Int J Mol Sci. 2023 Jan 2;24(1):805. doi: 10.3390/ijms24010805. Int J Mol Sci. 2023. PMID: 36614245 Free PMC article.
References
-
- Mai WX, Tian CY, Li L. Localized salt accumulation: the main reason for cotton root length decrease during advanced growth stages under drip irrigation with mulch film in a saline soil. J Arid Land. 2014;6(3):361–370.
-
- Yang Y, Guo Y. Elucidating the molecular mechanisms mediating plant salt-stress responses. New Phytol. 2018;217(2):523–539. - PubMed
-
- Yang Y, Guo Y. Unraveling salt stress signaling in plants. J Integr Plant Biol. 2018;60(9):796–804. - PubMed
MeSH terms
Substances
LinkOut - more resources
Full Text Sources
