

Accurate determination of node and arc multiplicities in de bruijn graphs using conditional random fields
- PMID: 32928110
- PMCID: PMC7491180
- DOI: 10.1186/s12859-020-03740-x
Accurate determination of node and arc multiplicities in de bruijn graphs using conditional random fields
Abstract
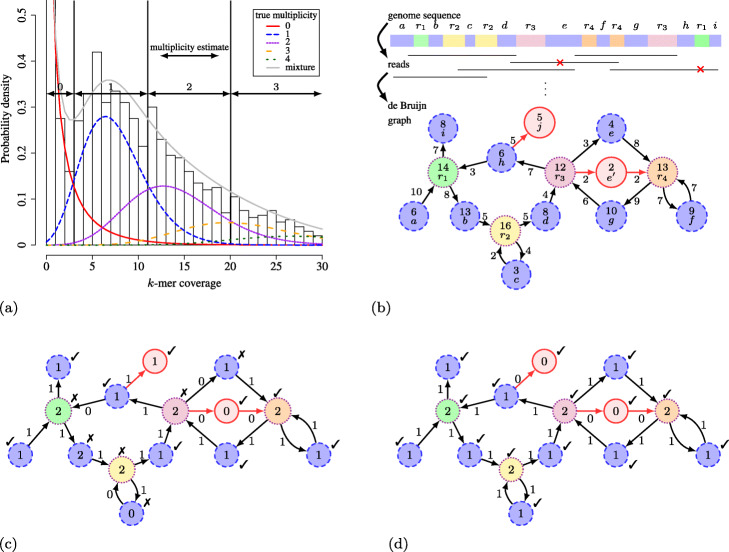
Background: De Bruijn graphs are key data structures for the analysis of next-generation sequencing data. They efficiently represent the overlap between reads and hence, also the underlying genome sequence. However, sequencing errors and repeated subsequences render the identification of the true underlying sequence difficult. A key step in this process is the inference of the multiplicities of nodes and arcs in the graph. These multiplicities correspond to the number of times each k-mer (resp. k+1-mer) implied by a node (resp. arc) is present in the genomic sequence. Determining multiplicities thus reveals the repeat structure and presence of sequencing errors. Multiplicities of nodes/arcs in the de Bruijn graph are reflected in their coverage, however, coverage variability and coverage biases render their determination ambiguous. Current methods to determine node/arc multiplicities base their decisions solely on the information in nodes and arcs individually, under-utilising the information present in the sequencing data.
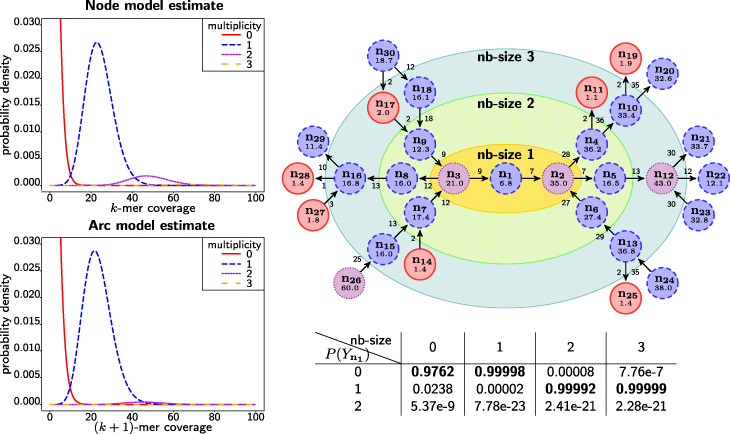
Results: To improve the accuracy with which node and arc multiplicities in a de Bruijn graph are inferred, we developed a conditional random field (CRF) model to efficiently combine the coverage information within each node/arc individually with the information of surrounding nodes and arcs. Multiplicities are thus collectively assigned in a more consistent manner.
Conclusions: We demonstrate that the CRF model yields significant improvements in accuracy and a more robust expectation-maximisation parameter estimation. True k-mers can be distinguished from erroneous k-mers with a higher F1 score than existing methods. A C++11 implementation is available at https://github.com/biointec/detox under the GNU AGPL v3.0 license.
Keywords: De Bruijn graphs; Next-generation sequencing; Probabilistic graphical models.
Conflict of interest statement
A patent application has been submitted by imec vzw based on this methodology.
Figures


Similar articles
-
Improved Node and Arc Multiplicity Estimation in De Bruijn Graphs Using Approximate Inference in Conditional Random Fields.IEEE/ACM Trans Comput Biol Bioinform. 2023 May-Jun;20(3):1995-2006. doi: 10.1109/TCBB.2022.3229085. Epub 2023 Jun 5. IEEE/ACM Trans Comput Biol Bioinform. 2023. PMID: 37015543
-
Integrating long-range connectivity information into de Bruijn graphs.Bioinformatics. 2018 Aug 1;34(15):2556-2565. doi: 10.1093/bioinformatics/bty157. Bioinformatics. 2018. PMID: 29554215 Free PMC article.
-
BrownieAligner: accurate alignment of Illumina sequencing data to de Bruijn graphs.BMC Bioinformatics. 2018 Sep 4;19(1):311. doi: 10.1186/s12859-018-2319-7. BMC Bioinformatics. 2018. PMID: 30180801 Free PMC article.
-
The present and future of de novo whole-genome assembly.Brief Bioinform. 2018 Jan 1;19(1):23-40. doi: 10.1093/bib/bbw096. Brief Bioinform. 2018. PMID: 27742661 Review.
-
Applications of de Bruijn graphs in microbiome research.Imeta. 2022 Mar 1;1(1):e4. doi: 10.1002/imt2.4. eCollection 2022 Mar. Imeta. 2022. PMID: 38867733 Free PMC article. Review.
Cited by
-
ELLIPSIS: robust quantification of splicing in scRNA-seq.Bioinformatics. 2025 Feb 4;41(2):btaf028. doi: 10.1093/bioinformatics/btaf028. Bioinformatics. 2025. PMID: 39936571 Free PMC article.
References
-
- Myers EW, Sutton GG, Delcher AL, Dew IM, Fasulo DP, Flanigan MJ, Kravitz SA, Mobarry CM, Reinert KHJ, Remington KA, Anson EL, Bolanos RA, Chou HH, Jordan CM, Halpern AL, Lonardi S, Beasley EM, Brandon RC, Chen L, Dunn PJ, Lai ZW, Liang Y, Nusskern DR, Zhan M, Zhang Q, Zheng XQ, Rubin GM, Adams MD, Venter JC. A whole-genome assembly of Drosophila. Science. 2000;287(5461):2196–204. doi: 10.1126/science.287.5461.2196. - DOI - PubMed
-
- Simpson JT, Pop M. The Theory and Practice of Genome Sequence Assembly In: Chakravarti A, Green E, editors. Annual Review of Genomics and Human Genetics, vol 16: 2015. p. 153–72. 10.1146/annurev-genom-090314-050032. - PubMed
MeSH terms
LinkOut - more resources
Full Text Sources
Miscellaneous
