. 2020 Sep 14;21(1):637.
doi: 10.1186/s12864-020-07063-2.

CrustyBase: an interactive online database for crustacean transcriptomes

Affiliations

CrustyBase: an interactive online database for crustacean transcriptomes

Cameron J Hyde et al. BMC Genomics. .

Abstract

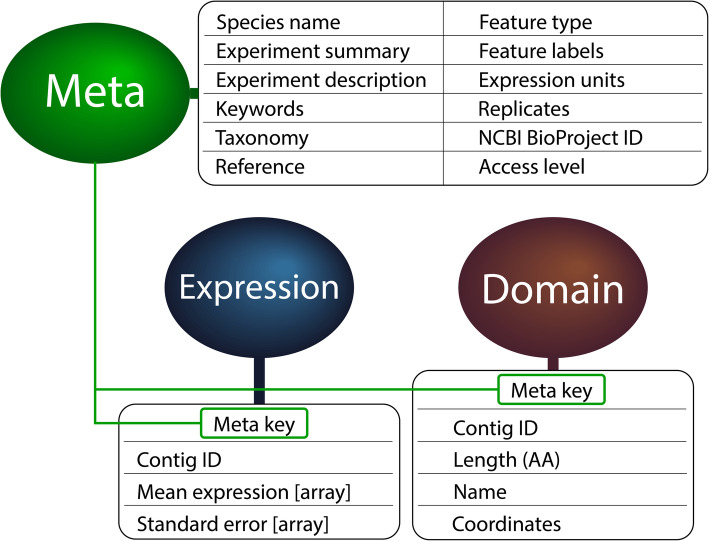
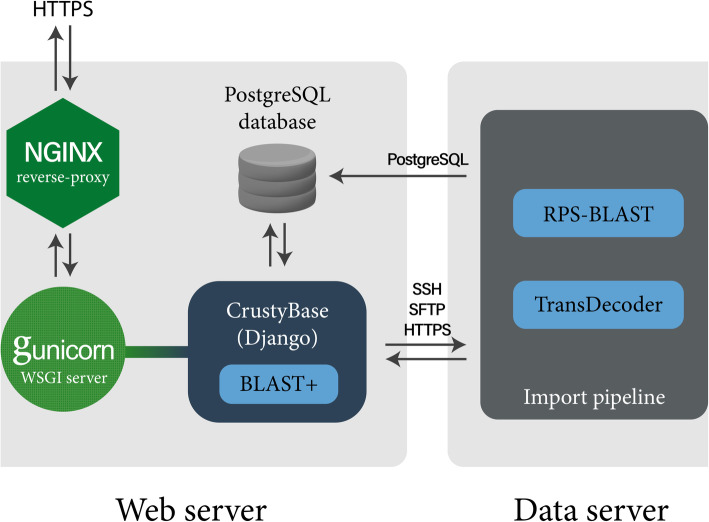
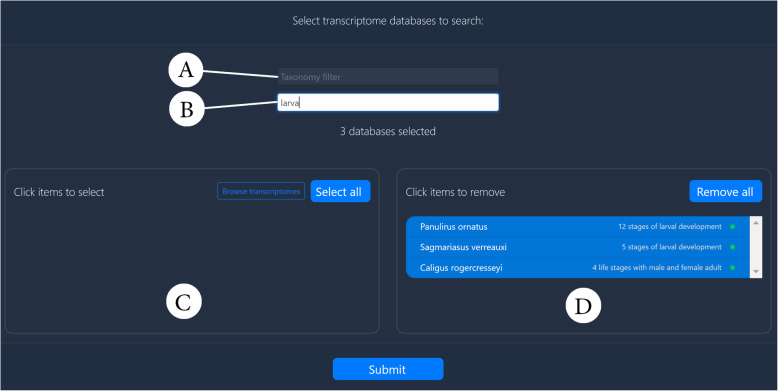
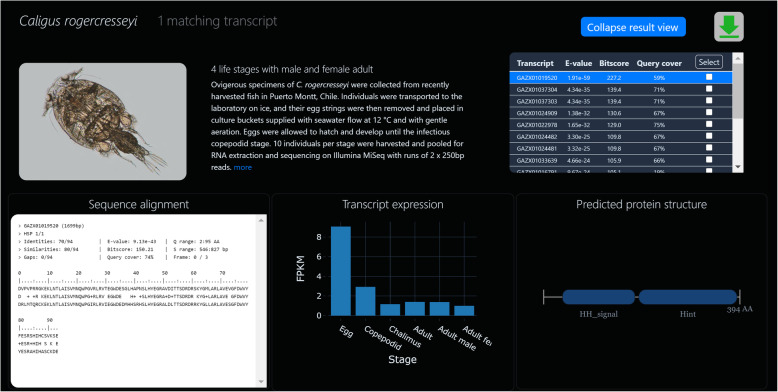
Transcriptome sequencing has opened the field of genomics to a wide variety of researchers, owing to its efficiency, applicability across species and ability to quantify gene expression. The resulting datasets are a rich source of information that can be mined for many years into the future, with each dataset providing a unique angle on a specific context in biology. Maintaining accessibility to this accumulation of data presents quite a challenge for researchers.The primary focus of conventional genomics databases is the storage, navigation and interpretation of sequence data, which is typically classified down to the level of a species or individual. The addition of expression data adds a new dimension to this paradigm - the sampling context. Does gene expression describe different tissues, a temporal distribution or an experimental treatment? These data not only describe an individual, but the biological context surrounding that individual. The structure and utility of a transcriptome database must therefore reflect these attributes. We present an online database which has been designed to maximise the accessibility of crustacean transcriptome data by providing intuitive navigation within and between datasets and instant visualization of gene expression and protein structure.The site is accessible at https://crustybase.org and currently holds 10 datasets from a range of crustacean species. It also allows for upload of novel transcriptome datasets through a simple web interface, allowing the research community to contribute their own data to a pool of shared knowledge.

Keywords: Crab; Crayfish; Expression; Gene; Genomics; Lobster; RNA-seq; Search; Shrimp; Visualize.


Conflict of interest statement

None to declare.

Figures

Fig. 1
Fig. 1
Data model architecture. The Meta, Expression and Domain models define the core of the database schema, with each Meta entry serving as a master record for each dataset. Each Meta record is linked to associated Expression and Domain records through a one-to-many relationship (shown by green lines and boxes). Adjacent tables show the main attributes of each model. “Features” describe the experimental variables used in the study, such as tissue type, treatment or phenotype
Fig. 2
Fig. 2
Server architecture. Nginx functions as a reverse proxy, handling HTTP requests and passing them on to Gunicorn which then distributes them to a worker thread. These worker threads then execute request handlers defined in the CrustyBase codebase. RNA-seq datasets uploaded for import are routed to a dedicated data server for processing. New datasets are remotely imported to the PostgreSQL database when processing is complete
Fig. 3
Fig. 3
BLAST database selection. Database selection in the BLAST interface allows for trivial searching of datasets by two text-based input filters (a and b). Input A allows for filtering based on the available taxonomy in the CB database on the basis of class, order, genus and species. Input B allows for keyword filtering of experimental conditions. In this case, the term “larva” filtered the available datasets (c) to three transcriptomes, which could then be added to the selection (d) in a single click
Fig. 4
Fig. 4
BLAST results – overview. Target datasets appear as a stack of “panes” showing a generic image of the animal with a brief description of the experiment and a hit table of BLAST summary statistics. Here, the user can scroll down the page to get an overview of all datasets with transcripts matching their query sequence. The user can then click the “expand” button (top-right) for a detailed view of that dataset, or select transcripts for data download (top-right)
Fig. 5
Fig. 5
BLAST results - expanded view. After expanding a dataset, the user receives a full-page, detailed view of that dataset’s BLAST hits including the BLAST alignment and statistics (bottom-left), an interactive expression graph (bottom-middle), and a predicted protein plot (bottom-right). The hit table (top-right) shows summary statistics for matching transcripts. The user can navigate these hits with either arrow keys or mouse clicks while the below panes update in real-time to display data for the selected transcript
Fig. 6
Fig. 6
BLAST results – data download. This window appears when the user has selected one or more transcripts in the hit table (Fig. 4) and hit the download icon. The user can select the data formats most appropriate to them and enter a prefix for the pending file before downloading

References

    1. Matthews BJ, Vosshall LB. How to turn an organism into a model organism in 10 easy steps. J Exp Biol. 2020;223(Suppl 1):jeb218198. - PMC - PubMed
    1. National Centre for Biotechnology Information National Library of Medicinehttps://ncbi.nlm.nih.gov Accessed 01 Nov 2019.
    1. Wolf JB. Principles of transcriptome analysis and gene expression quantification: an RNA-seq tutorial. Mol Ecol Resour. 2013;13(4):559–572. doi: 10.1111/1755-0998.12109. - DOI - PubMed
    1. Nguyen TV, Jung H, Rotllant G, Hurwood D, Mather P, Ventura T. Guidelines for RNA-seq projects: applications and opportunities in non-model decapod crustacean species. Hydrobiologia. 2018;825(1):5–27. doi: 10.1007/s10750-018-3682-0. - DOI
    1. Altschul SF, Gish W, Miller W, Myers EW, Lipman DJ. Basic local alignment search tool. J Mol Biol. 1990;215(3):403–410. doi: 10.1016/S0022-2836(05)80360-2. - DOI - PubMed

LinkOut - more resources