. 2020 Sep 14;19(1):143.
doi: 10.1186/s12943-020-01248-9.

Identification of miPEP133 as a novel tumor-suppressor microprotein encoded by miR-34a pri-miRNA

Affiliations

Identification of miPEP133 as a novel tumor-suppressor microprotein encoded by miR-34a pri-miRNA

Min Kang et al. Mol Cancer. .

Erratum in

Abstract

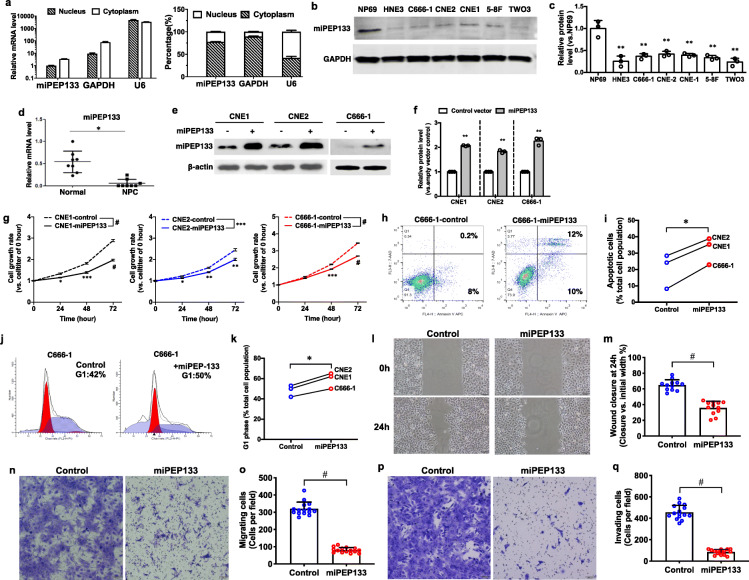
Background: Very few proteins encoded by the presumed non-coding RNA transcripts have been identified. Their cellular functions remain largely unknown. This study identifies the tumor-suppressor function of a novel microprotein encoded by the precursor of miR-34a. It consists of 133 amino acid residues, thereby named as miPEP133 (pri-microRNA encoded peptide 133).

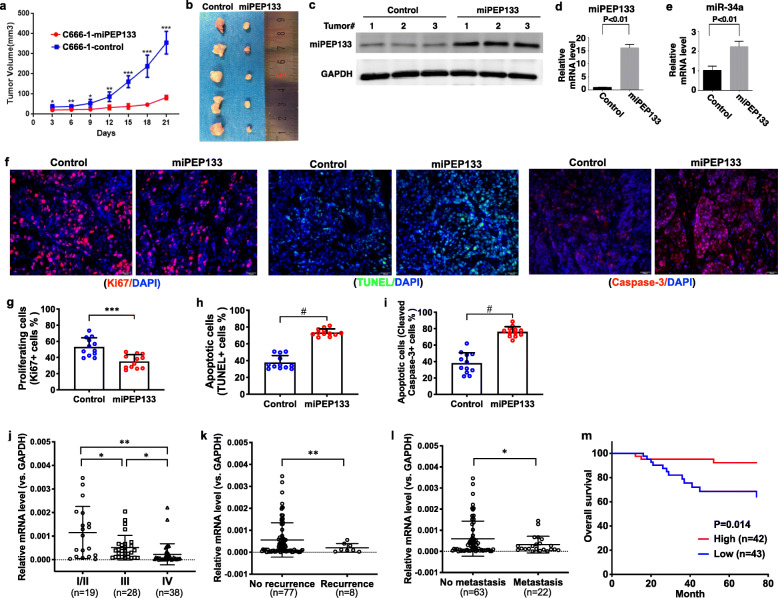
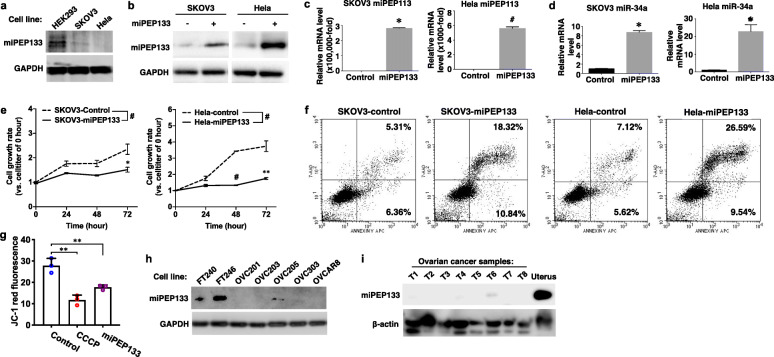
Methods: We overexpressed miPEP133 in nasopharyngeal carcinoma (NPC), ovarian cancer and cervical cancer cell lines to determine its effects on cell growth, apoptosis, migration, or invasion. Its impact on tumor growth was evaluated in a xenograft NPC model. Its prognostic value was analyzed using NPC clinical samples. We also conducted western blot, immunoprecipitation, mass spectrometry, confocal microscopy and flow cytometry to determine the underlying mechanisms of miPEP133 function and regulation.

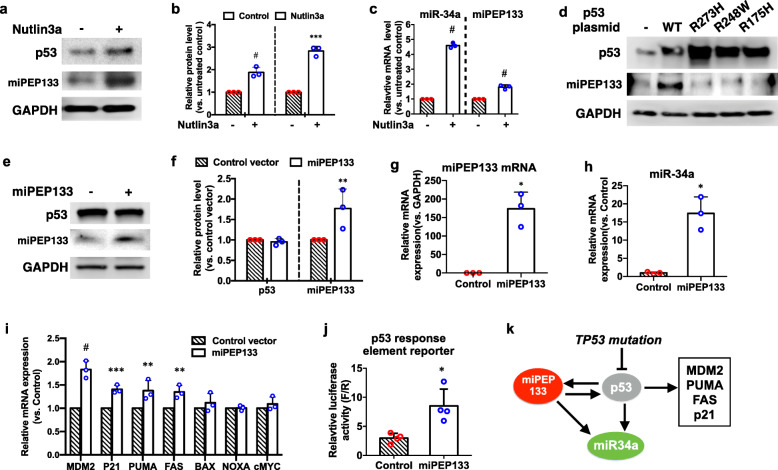
Results: miPEP133 was expressed in normal human colon, stomach, ovary, uterus and pharynx. It was downregulated in cancer cell lines and tumors. miPEP133 overexpression induced apoptosis in cancer cells and inhibited their migration and invasion. miPEP133 inhibited tumor growth in vivo. Low miPEP133 expression was an unfavorable prognostic marker associated with advanced metastatic NPC. Wild-type p53 but not mutant p53 induced miPEP133 expression. miPEP133 enhanced p53 transcriptional activation and miR-34a expression. miPEP133 localized in the mitochondria to interact with mitochondrial heat shock protein 70kD (HSPA9) and prevent HSPA9 from interacting with its binding partners, leading to the decrease of mitochondrial membrane potential and mitochondrial mass.

Conclusion: miPEP133 is a tumor suppressor localized in the mitochondria. It is a potential prognostic marker and therapeutic target for multiple types of cancers.

Keywords: Nasopharyngeal carcinoma; Pri-miRNA-encoded protein; Tumor suppressor; miPEP133; miR-34a.


Conflict of interest statement

The authors declare that they have no competing interests.

Figures

Fig. 1
Fig. 1
Identification of miPEP133. a Schematic graph of the open reading frame (ORF) that encodes miPEP133. The ORF (labeled in red) was identified in the gene of miR34a, MIR34AHG. b Coomassie blue staining of SDS-PAGE gel that analyzed cell lysate of HEK293 cells transfected with the control plasmid (−) or the plasmid containing miPEP133 ORF (+). c Mass spectrometry analysis of the 15KDa protein band excised from SDS-PAGE gel, which confirmed the presence of 4 peptide fragments (#1–4) that match the sequence of miPEP133. d Western blot of miPEP133 in HEK293 cells transfected with the control plasmid (−) or the plasmid containing miPEP133 ORF (+). β-actin was used as loading control. e The overexpression of miPEP133 in HEK293 cells was assessed at mRNA level by RT-QPCR. Student’s t-test, *p < 0.001. f Western blot images of miPEP133 in HEK293 cells transfected with control and 3 siRNAs. siRNAs #1 and #3 knocked down the expression of miPEP133 protein. Student’s t-test, *p < 0.001. g RT-QPCR data confirmed the knockdown of miPEP133 mRNA by siRNAs #1 and #3. Student’s t-test, *p < 0.5. h Sequencing result demonstrates the CRISPR/Gas9-mediated partial deletion of miPEP133 ORF. Two clones contain the desired deletions of the ORF, MUT1 (28 bp) and MUT2 (5 bp). Red dotted lines indicate the deleted fragments. i Western blot images of miPEP133 in HEK293 cells. MUT1 and MUT2 clones both lost the expression of miPEP133 protein comparing to the parent cell line (blank) and the cells transfected with empty vectors (CN). j RT-QPCR of miPEP133 mRNA in the nuclear and cytoplasmic fractions of HEK293 cells. U6 and GAPDH were used as control genes. k Western blot of miPEP133 protein in normal human tissues
Fig. 2
Fig. 2
Tumor suppressor functions of miPEP133 in nasopharyngeal carcinoma (NPC) cells. a RT-QPCR of miPEP133 mRNA in the nuclear and cytoplasmic fractions of NP69 cells. U6 and GAPDH were used as control genes. b Representative images of miPEP133 western blot in NP69 and NPC cell lines. c Quantification of miPEP133 band intensity in western blot. Student’s t-test, **p < 0.005. d RT-QPCR of miPEP133 in normal pharynx and NPC samples (n = 8). Student’s t-test, *p < 0.05. e Western blot of miPEP133 in three NPC cell lines transfected with control (−) or miPEP133 plasmid (+). f Quantification of miPEP133 band intensity in western blot. Student’s t-test, **p < 0.005. g Cell growth rates of NPC cell lines. Two-way ANOVA followed by Sidak’s test, *p < 0.05, **p < 0.005, ***p < 0.001, #p < 0.0001. h Flow cytometry dot plots of C666–1 cells stained with AnnexinV/7-ADD. i Summarized flow cytometry results of AnnexinV/7-ADD-staining in NPC cells lines. Student’s t-test, *p < 0.05. j Cell cycle status of C666–1 cells determined by PI staining and flow cytometry. k Summarized flow cytometry results of PI-staining in three NPC cells lines. Student’s t-test, *p < 0.05. l Representative images of wound healing assay at 0 h and 24 h of control C666–1 cells and the miPEP133-overexpressing C666–1 cells. m Quantification of wound closure of control C666–1 cells and the miPEP133-overexpressing C666–1 cells at 24 h. Wound closure was presented as the percentage of wound width that was closed. Student’s t-test, #p < 0.0001. n Representative images of migrating cells in trans-well assay. o Quantification of migrating cells in the transwell migration assay. Student’s t-test, #p < 0.0001. p Representative images of invading cells in trans-well assay. q Quantification of invading cells in the transwell invasion assay. Student’s t-test, #p < 0.0001
Fig. 3
Fig. 3
Tumor suppressor functions of miPEP133 in NPC in vivo. a Tumor growth curves of nude mice that were injected with control C666–1 cells or miPEP133-overexpressing C666–1 cells. Two-way ANOVA test followed by Sidak test, *p < 0.05, **p < 0.005, ***p < 0.0005. b Tumors xenografts from nude mice. c Western blot images of miPEP133 in the tumors formed by control C666–1 cells and miPEP133-overexpressing C666–1 cells. d QPCR of miPEP133 in tumors. Student’s t-test, p < 0.01. e QPCR of miR-34a in the tumors. Student’s t-test, p < 0.01. f Representative images of Ki67, TUNEL, and cleaved caspase-3 staining in tumors from nude mice. DAPI was used to stain the nuclei. g Quantification of Ki67 positive proliferating cells in mouse tumors. Student’s t-test, ***p < 0.001. h Quantification of TUNEL positive apoptotic cells in mouse tumors. Student’s t-test, #p < 0.0001. i Quantification of cleaved capsase-3 positive apoptotic cells in mouse tumors. Student’s t-test, #p < 0.0001. j Decreased mRNA levels of miPEP133 were associated with advanced NPC in 85 human tumor samples. Student’s t-test, *p < 0.05, **p < 0.005. k mRNA levels of miPEP133 were lower in recurrent NPC. Student’s t-test, **p < 0.005. l mRNA levels of miPEP133 were lower in metastatic NPC. Student’s t-test, *p < 0.05. m High level of miPEP133 mRNA is a favorable prognostic marker for NPC patient. Kaplan–Meier analysis and log-rank test were performed (p = 0.014)
Fig. 4
Fig. 4
miPEP133 protein function. a The miPEP133-interacting proteins in HEK293 cells identified by mass spectrometry. b Representative confocal microscopy images of flag-tag-labeled miPEP133 in the cytoplasm of HEK293 and C666–1 cells. c Western blot images of miPEP133 in cellular fractions of HEK293 cells and co-IP of miPEP133 and HSPA9 in the mitochondrial fraction. TOM20, DNA topoisomerase 1 (TOP1), and GAPDH were used as loading controls for mitochondrial, nuclear, and cytoplasmic fractions, respectively. d Co-IP of HSPA9 and its interacting proteins demonstrated the ability of miEPE133 to block the interaction of HSPA9 to other proteins, including HSP60, TIM44, and VDAC1. e Representative images of western blot of mitochondrial proteins in from the control HEK293 cells and the miPEP133-overexpressing HEK293 cells. f Summarized flow cytometry result of JC-1-staining in HEK293 cells transfected with control or miPEP133 plasmid. CCCP-treated HEK293 cells were used as positive control. Student’s t-test, **p < 0.005. g Representative confocal microscopy images of HEK293 cells transfected with control vector or miPEP133-expressing vector. GFP (green) indicated the cells were transfected with the vectors. TOM20 (red) labeled the mitochondrial outer membrane. DAPI (blue) was used to stain the nuclei. Dotted circles indicate the cells with shrinking nucleus. h Cellular ATP level in control and miPEP133-expressing HEK293 cells. Two-way ANOVA, #p < 0.0001. i Schematic model of miPEP133-regulated mitochondrial integrity and function
Fig. 5
Fig. 5
miPEP133 and wild-type p53 reciprocal regulation. a Representative western blot images of p53 and miPEP133 in HEK293 cells untreated or treated with Nutlin3a. GAPDH was used as loading control. b Quantification of p53 and miPEP133 band intensity in western blot. Student’s t-test, ***p < 0.0005, #p < 0.0001. c RT-QPCR of miPEP133 and miR-34a mRNA in HEK293 cells untreated or treated with Nutlin3a. Student’s t-test, #p < 0.0001. d Representative western blot images of wild-type (WT) or mutant p53 and miPEP133 in HEK293 cells transfected with WT or mutant p53 plasmids. GAPDH was used as loading control. e Representative western blot images of p53 and miPEP133 in control and miPEP133-overexpressing HEK293 cells. GAPDH was used as loading control. f Quantification of p53 and miPEP133 band intensity in western blot. Student’s t-test, **p < 0.005. g RT-QPCR of miPEP133 mRNA in control and miPEP133-overexpressing HEK293 cells. Student’s t-test, *p < 0.05. h RT-QPCR of miR-34a in control and miPEP133-overexpressing HEK293 cells. Student’s t-test, *p < 0.05. i RT-QPCR of p53 target genes in control and miPEP133-overexpressing HEK293 cells. Two-way ANOVA followed by Sidak’s test, **p < 0.005, ***p < 0.001, #p < 0.0001. j p53 response element luciferase reporter assay in control and miPEP133-overexpressing HEK293 cells. Student’s t-test, *p < 0.05. k Schematic model of the reciprocal regulation between miPEP133 and p53
Fig. 6
Fig. 6
miPEP133 has p53-independent functions. a Representative western blot images of miPEP133 in ovarian cancer cell line SKOV3 and cervical cancer cell line Hela. GAPDH was used as loading control. b Representative western blot images of miPEP133 in control and miPEP133-overexpressing SKOV3 and Hela cells. c RT-QPCR of miPEP133 in control and miPEP133-overexpressing SKOV3 and Hela cells. Student’s t-test, *p < 0.01, #p < 0.0001. d RT-QPCR of miR-34a in control and miPEP133-overexpressing SKOV3 and Hela cells. Student’s t-test, *p < 0.01. e Cell growth rates of SKOV3 and Hela cells. Two-way ANOVA followed by Sidak’s test, *p < 0.05, **p < 0.005, ***p < 0.001, #p < 0.0001. f Flow cytometry dot plots of SKOV3 and Hela cells transfected with control or miPEPqee plasmid and stained with AnnexinV/7-ADD. g Summarized flow cytometry result of JC-1-staining in Hela cells transfected with control or miPEP133 plasmid. CCCP-treated Hela cells were used as positive control. Student’s t-test, **p < 0.005. h Representative western blot images of miPEP133 in patient-derived ovarian cancer cell lines, OVC201, OVC203, OVC205 and OVC303. Normal human fallopian tube epithelial cell lines, FT240 and FT246, were used as noncancerous control cells. GAPDH was used as loading control. i Representative western blot images of miPEP133 in ovarian cancer samples (T1-T8. Human normal uterus tissue protein lysate was used as a positive control in western blot. β-actin was used as loading control

References

    1. Bartel DP. MicroRNAs: target recognition and regulatory functions. Cell. 2009;136:215–33. 10.1016/j.cell.2009.01.002 - DOI - PMC - PubMed
    1. Ha M, Kim VN. Regulation of microRNA biogenesis. Nat Rev Mol Cell Biol. 2014;15:509–24. 10.1038/nrm3838 - DOI - PubMed
    1. Lauressergues D, Couzigou JM, Clemente HS, Martinez Y, Dunand C, Becard G, et al. Primary transcripts of microRNAs encode regulatory peptides. Nature. 2015;520:90–3. 10.1038/nature14346 - DOI - PubMed
    1. Anderson DM, Anderson KM, Chang CL, Makarewich CA, Nelson BR, McAnally JR, et al. A micropeptide encoded by a putative long noncoding RNA regulates muscle performance. Cell. 2015;160:595–606. 10.1016/j.cell.2015.01.009 - DOI - PMC - PubMed
    1. Nelson BR, Makarewich CA, Anderson DM, Winders BR, Troupes CD, Wu F, et al. A peptide encoded by a transcript annotated as long noncoding RNA enhances SERCA activity in muscle. Science. 2016;351:271–5. 10.1126/science.aad4076 - DOI - PMC - PubMed

Publication types