. 2020 Sep 14;13(1):123.
doi: 10.1186/s13045-020-00952-9.

Tie2-mediated vascular remodeling by ferritin-based protein C nanoparticles confers antitumor and anti-metastatic activities

Affiliations

Tie2-mediated vascular remodeling by ferritin-based protein C nanoparticles confers antitumor and anti-metastatic activities

Young Sun Choi et al. J Hematol Oncol. .

Abstract

Background: Conventional therapeutic approaches for tumor angiogenesis, which are primarily focused on the inhibition of active angiogenesis to starve cancerous cells, target the vascular endothelial growth factor signaling pathway. This aggravates hypoxia within the tumor core and ultimately leads to increased tumor proliferation and metastasis. To overcome this limitation, we developed nanoparticles with antiseptic activity that target tumor vascular abnormalities.

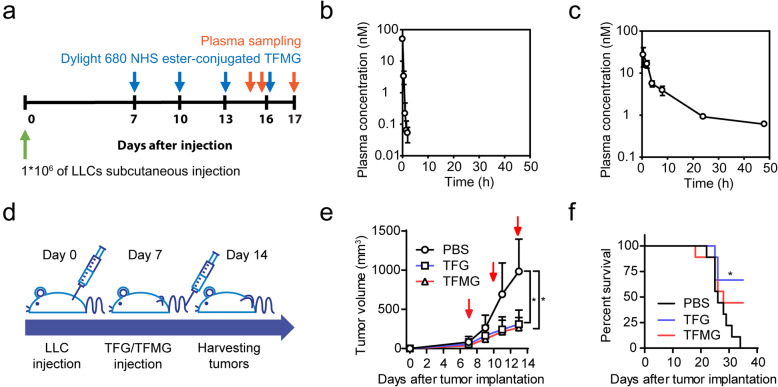
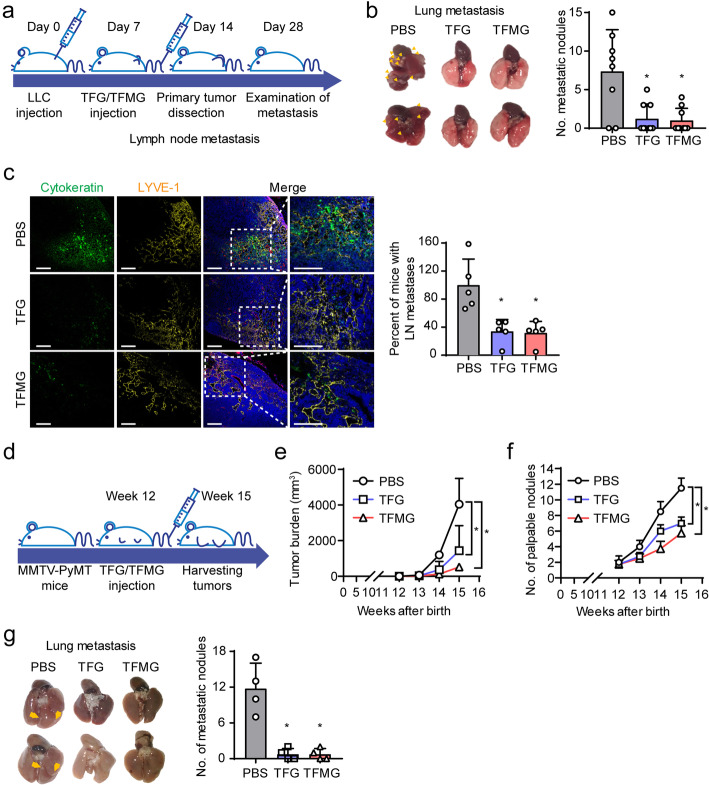
Methods: Ferritin-based protein C nanoparticles (PCNs), known as TFG and TFMG, were generated and tested in Lewis lung carcinoma (LLC) allograft and MMTV-PyMT spontaneous breast cancer models. Immunohistochemical analysis was performed on tumor samples to evaluate the tumor vasculature. Western blot and permeability assays were used to explore the role and mechanism of the antitumor effects of PCNs in vivo. For knocking down proteins of interest, endothelial cells were transfected with siRNAs. Statistical analysis was performed using one-way ANOVA followed by post hoc Dunnett's multiple comparison test.

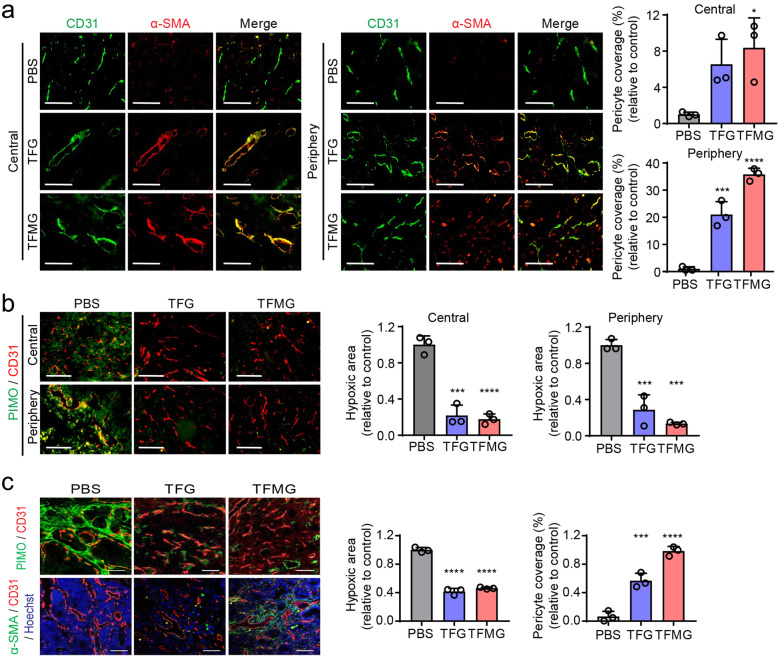
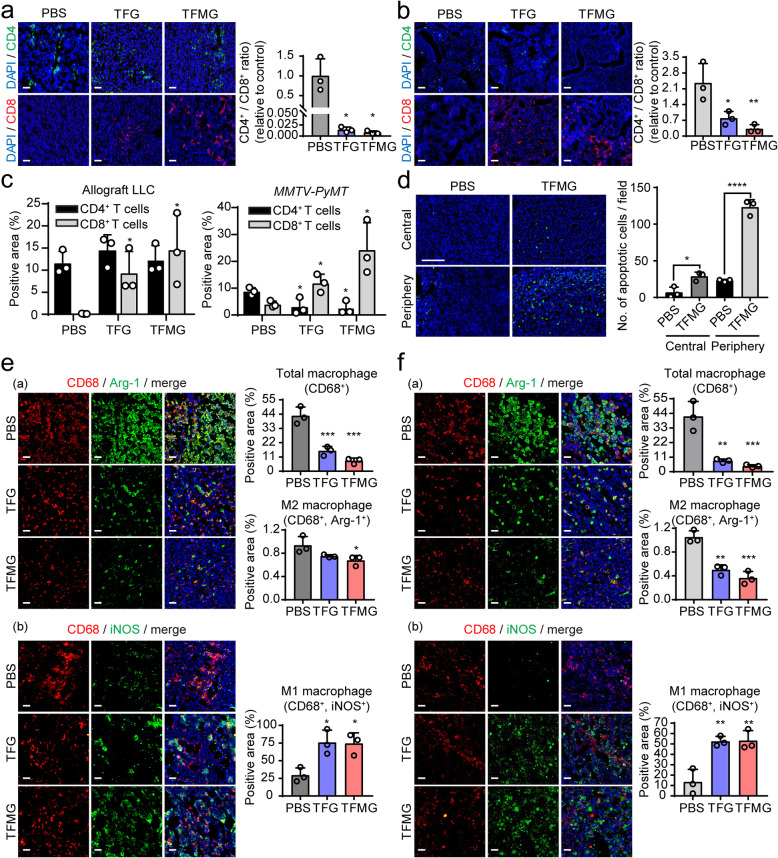
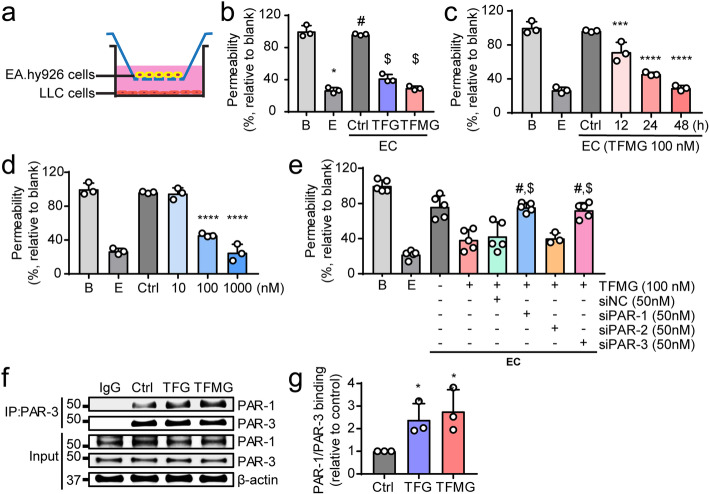
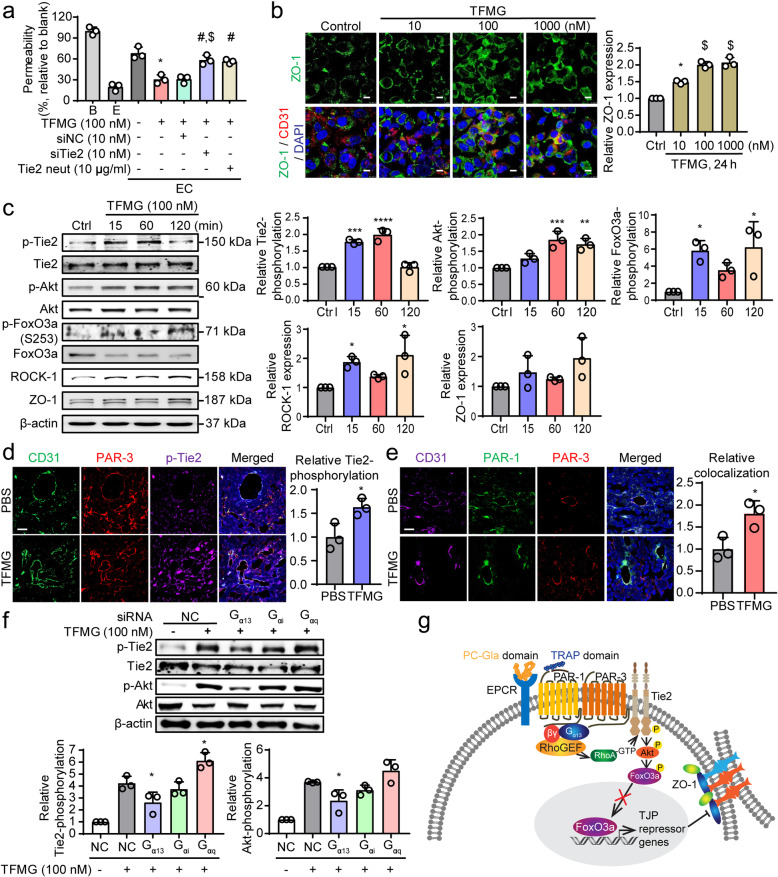
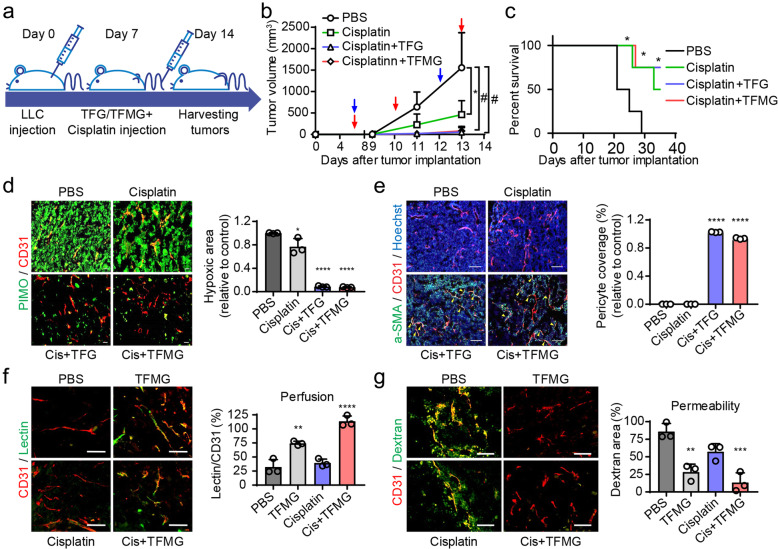
Results: PCNs significantly inhibited hypoxia and increased pericyte coverage, leading to the inhibition of tumor growth and metastasis, while increasing survival in LLC allograft and MMTV-PyMT spontaneous breast cancer models. The coadministration of cisplatin with PCNs induced a synergistic suppression of tumor growth by improving drug delivery as evidenced by increased blood prefusion and decreased vascular permeability. Moreover, PCNs altered the immune cell profiles within the tumor by increasing cytotoxic T cells and M1-like macrophages with antitumor activity. PCNs induced PAR-1/PAR-3 heterodimerization through EPCR occupation and PAR-1 activation, which resulted in Gα13-RhoA-mediated-Tie2 activation and stabilized vascular tight junctions via the Akt-FoxO3a signaling pathway.

Conclusions: Cancer treatment targeting the tumor vasculature by inducing antitumor immune responses and enhancing the delivery of a chemotherapeutic agent with PCNs resulted in tumor regression and may provide an effective therapeutic strategy.

Keywords: Antitumor immune response; EPCR; Ferritin-based protein C nanoparticles; Tie2; Vascular normalization.


Conflict of interest statement

The authors declare that they have no competing interests.

Figures

Fig. 1
Fig. 1
TGMG exhibits high pharmacokinetic stability and PCNs suppress tumor growth in vivo. a Schematic diagram depicting the schedule of TRAF or TFMG treatment and plasma sampling in LLC allograft models. LLC tumor-bearing mice, following LLC cell inoculation, were administered TRAF peptide (10 nmol/kg), TFMG (10 nmol/kg), or vehicle control (PBS) subcutaneously. The blue arrowheads represent the point of TRAF or TFMG administration and the red arrowheads represent the point of plasma sampling. b, c Plasma concentrations of TRAP (b) and TFMG (c) in LLC tumor-bearing mice following intravenous injection of TRAP (10 nmol/kg) or TFMG (10 nmol/kg), respectively (n = 3). d Schematic diagram depicting the development of the LLC allograft models and treatment schedule. LLC tumor-bearing mice, following LLC cell inoculation, were administered TFG (10 nmol/kg), TFMG (10 nmol/kg), or vehicle control (PBS) intravenously on days 7, 10, and 13. The tumors were sampled on day 14. e Pattern of tumor growth in LLC tumor-bearing mice treated with TFG, TFMG, or vehicle control (PBS). Tumor volumes were measured on days 7, 9, 11, and 13. The red arrowheads represent the point of TFG/TFMG administration (n ≥ 9). f Survival curves of the LLC tumor-bearing mice. Data information: Data are presented as the mean ± SD. Significant enrichment: *P < 0.0001 (two-way ANOVA) in (e); *P < 0.01 (Mantel-Cox test) in (f)
Fig. 2
Fig. 2
TFG and TFMG suppresses metastasis in mouse models. a Schematic diagram depicting the generation of metastatic tumor models and treatment schedule. LLC tumor-bearing mice, following LLC cell inoculation, were administered, intravenously, TFG (10 nmol/kg), TFMG (10 nmol/kg), or vehicle control (PBS) on days 7, 10, and 13, and the primary tumors were dissected on day 14. Inguinal lymph nodes (LNs) and lungs were sampled on day 28. b Representative photographic images of metastatic lungs resected from mice from the control, TFG, or TFMG groups. Graphical representation of the observed metastatic nodules in each group (n ≥ 8). c Confocal images of sections of inguinal LNs showing cytokeratin+ tumor metastatic areas. Sections of inguinal LNs from vehicle control (PBS), TFG, or TFMG-treated mice were stained with cytokeratin (green, epithelial cells), LYVE-1 (yellow, lymphatic vessels), and Hoechst 33258 (blue, nuclei) (n = 5). Scale bars: 100 μm. Quantitation (c) was done using ImageJ software. d Schematic diagram depicting the treatment schedule for MMTV-PyMT mice. Tumor growth was analyzed weekly in the MMTV-PyMT transgenic mouse models from week 12 and onwards following birth. The mice were treated with TFG (10 nmol/kg), TFMG (10 nmol/kg), or vehicle control (PBS) every 3 days until the tumors were sampled and analyzed at week 15. e Pattern of increase in tumor burden in the vehicle control (PBS), TFG-, or TFMG-treated MMTV-PyMT mice. Tumor burden was calculated as the sum of the volumes of all tumor masses (n = 4). f Pattern of increase in the number of palpable tumor nodules in the MMTV-PyMT mice (n = 4). g Photographic images of representative metastatic lungs resected from the MMTV-PyMT mice at week 15. The yellow arrowheads indicate metastatic nodules in the lungs of the respective groups (n = 4). Data are presented as the mean ± SD. Data information: Data are presented as the mean ± SD. Statistical analysis was done using two-way ANOVA for growth curves or a student t test for No. of metastatic nodules. *P < 0.05 (b, c), *P < 0.0001 (e, f), *P < 0.001 (g).
Fig. 3
Fig. 3
TFG and TFMG-induced tumor vascular normalization. a Confocal images of tumor sections showing α-SMA+ pericyte coverage on tumor vessels in the central and peripheral regions of allograft tumors from the LLC tumor model. Frozen tumor sections were stained with CD31 (green, blood vessels) and α-SMA (red, pericyte). Scale bars: 100 μm. Right graphs show the quantitation of fluorescent images by ImageJ software (n ≥ 3). b Confocal images of tumor sections showing hypoxic regions in the center and periphery of the LLC tumors stained with Hypoxicprobe™ (green, PIMO, hypoxic areas) and CD31 (red, blood vessels). Scale bars: 100 μm. Right graphs show the quantitation of fluorescent images by ImageJ software (n ≥ 3). c Confocal images of tumor sections showing hypoxic regions in the center of the tumor from the MMTV-PyMT mice stained with Hypoxicprobe™ (green, PIMO, hypoxic areas) and CD31 (red, blood vessels). Confocal images of tumor sections showing α-SMA+ pericyte coverage on tumor vessels. Frozen tumor sections were stained with α-SMA (green, pericyte), CD31 (red, blood vessels), and Hoechst 33258 (blue). Scale bars: 100 μm (n = 3). The quantitation in (ac) were conducted using ImageJ software. Data information: Data are presented as the mean ± SD. Significant enrichment: *P < 0.05; ***P < 0.001; ****P < 0.0001 (Sidak’s multiple comparisons test)
Fig. 4
Fig. 4
TFG and TFMG enhanced immune responses in LLC tumors and spontaneous MMTV-PyMT breast tumors. a, b Fluorescence microscopic images of tumor sections harvested from the LLC tumor-bearing mice (a) and from the MMTV-PyMT tumor-bearing mice (b) to illustrate CD4+ and CD8+ T lymphocytes. Frozen tumor sections from vehicle (PBS), TFG, or TFMG-treated groups were immunostained using PE-conjugated CD4 and Alexa Fluor 647-conjugated CD8a antibodies (n = 3). The scale bars: 50 μm. c The percentages of CD4+ T cells and CD8+ T cells population in the mouse tumor model with/without TFG or TFMG treatment (n = 3 per group). *P < 0.05 vs. the vehicle control (PBS). The data are presented as the mean ± SD. d TUNEL assay was performed with LLC and MMTV-PyMT tumor tissues in central and peripheral regions of the tissues, quantified for positive fluorescent cells, and graphed. DAPI staining for nucleus was performed (n = 3). ****P < 0.0001, *P < 0.05. The scale bars: 50 μM. e, f Macrophage infiltration into the LLC tumor (e) and into the MMTV-PyMT tumor (f) were evaluated. The number of infiltrating macrophages was determined by counting CD68+/arginase-1 (Arg-1)+ M2 macrophages (a) or CD68+/induced nitric oxide synthase (iNOS)+ M1 macrophages (b) in the tumor area. Quantitation of the CD68+, iNOS+, and Arg-1+ areas in three random microscopic fields in mice (n = 3) per group was performed using Image J software. Scale bars: 50 μm. Data information: Data are presented as the mean ± SD. Significant enrichment: *P < 0.05, **P < 0.01; ***P < 0.001; (Sidak’s multiple comparisons test)
Fig. 5
Fig. 5
Endothelial PAR-3 is required for TFMG-induced normalization of vasculature. a Schematic diagram of the endothelial cell/cancer cell (EC) co-culture system. EA.hy926 cells (5 × 10⁵) were co-cultured with LLC cells (2.5 × 10⁵) in Transwell plates (pore size, 3 μm). b Permeability assay of TFG and TFMG using EC co-cultures. EC co-cultures were treated with TFG (100 nM) or TFMG (100 nM) for 48 h, and the permeability (%) of FITC-dextran was measured relative to untreated control co-cultures. B, Blank (no EA.hy926, no LLC); E, endothelial cell only (EA.hy926 seeded onto the Transwell membrane, no LLC); *P < 0.0001 vs. B; #P < 0.0001 vs. E; $P < 0.0001 vs. control (n = 3). c, d Permeability assay of TFMG using EC co-cultures to demonstrate the time- and dose-dependent effects. EC co-cultures were treated with 100 nM TFMG for 12, 24, or 48 h (c) and with 10, 100, and 1000 nM TFMG for 24 h (d), and the permeability (%) of FITC-dextran was measured relative to untreated control co-cultures (n = 3). e Effect of siRNA-mediated endothelial PAR-1, PAR-2, and PAR-3 silencing on TFMG-induced reduction of in vitro permeability. EC co-cultures, with or without siRNA-mediated silencing of endothelial PAR-1, PAR-2, or PAR-3, were treated with 100 nM TFMG for 24 h, and the permeability (%) of FITC-dextran was measured relative to untreated control co-cultures. *P < 0.0001 vs. untreated control EC co-culture; #P < 0.001 vs. TFMG-treated EC co-culture; $P < 0.001 vs. TFMG-treated EC co-culture with siNC (negative control siRNA) silencing; ns, no significant difference vs. TFMG-treated EC-cultures with or without siNC silencing (n = 5). f, g Co-immunoprecipitation assay of PAR-1 and PAR-3 following TFG or TFMG treatment. EA.hy926 cells were treated with TFG or TFMG (100 nM) for 24 h. The PAR-1/PAR-3 interaction was investigated by immunoprecipitation with anti-PAR3 antibody followed by western blot analysis using anti-PAR-1 antibody in TFG/TFMG-treated or untreated control cells (f). Relative binding of PAR-1/PAR-3 after TFG or TFMG treatment was quantitated using GelQuant software (g). Data information: Data are presented as the mean ± SD. Significant enrichment: *P < 0.05; ***P < 0.001; ****P < 0.0001 (c, d, f, g) (Sidak’s multiple comparisons test)
Fig. 6
Fig. 6
Endothelial Tie2 activation is essential for TFMG-induced vascular normalization. a EC co-cultures, with or without siRNA-mediated silencing of endothelial Tie2 or Tie2 neutralizing antibody-mediated blockage of Tie2, were treated with 100 nM TFMG for 24 h, and the permeability (%) of FITC-dextran was measured relative to untreated control co-cultures. *P < 0.0001 vs. untreated control EC co-culture (E); #P < 0.01 vs. TFMG-treated EC co-culture; $P < 0.001 vs. TFMG-treated EC co-culture with siNC silencing (n = 3). b EA.hy926 cells were treated with 10, 100, and 1000 nM of TFMG for 24 h, and immunofluorescent images were recorded to illustrate the level of ZO-1. (right panel) Quantitation of the relative ZO-1 level was performed. *P < 0.001 vs. Ctrl; $P < 0.0001 vs. Ctrl (n = 3). c Western blot analyses to demonstrate the activation of Tie2 and Akt, along with the levels of ROCK-1 (Rho kinase), FoxO3a, and zonula occludens-1 (ZO-1) in endothelial cells following TFMG treatment. EA.hy926 cells were treated with 100 nM TFMG for 15, 60, and 120 min, and Western blot analysis was done to visualize the levels of phosphorylated Tie2 (p-Tie2), Tie2, p-Akt, Akt, ROCK-1, p-FoxO3a, FoxO3a, FoxO1, and ZO-1. d, e A frozen section of tumor tissues of each group was costained with anti-CD31/anti- PAR-3/anti-pTie2 antibodies (d) or anti-CD31/anti-PAR-1/anti-PAR-3 antibodies (e) and appropriate secondary fluorescent antibodies by IHC. Immunofluorescence was observed under the fluorescent microscope (× 400). Scale bar: 50 μm. f Ea.hy926 cells were transfected with negative control (NC), Gα13, Gαi, or Gαq siRNA (100 nM). Cells were harvested at 60 min after TFMG (100 nM) treatment and analyzed for activation of Tie2 signaling and Akt expression by western blot analysis. Quantitation in (b–d) were conducted using ImageJ software. g Proposed underlying mechanism of TFG and TFMG-induced vascular normalization in cancer. EPCR binding and PAR-1 activation by TFG/TFMG resulted in PAR-1/PAR-3 heterodimerization, which induced Gα13-mediated endothelial Tie2 activation, resulting finally in the induction of tight-junction proteins and vascular normalization. Data information: Data are presented as the mean ± SD. Significant enrichment: *P < 0.05; **P < 0.01; ***P < 0.001 (c, d) (Sidak’s multiple comparisons test)
Fig. 7
Fig. 7
TFG and TFMG enhance the chemotherapeutic efficacy of cisplatin in LLC tumor-bearing mice. a Schematic diagram depicting the LLC allograft model development and treatment schedule. LLC tumor-bearing mice, following LLC cell inoculation, were administered intravenous injections of vehicle control (PBS) on days 7, 10, and 13, or cisplatin (3 mg/kg) on days 7 and 12, with or without TFG (10 nmol/kg) or TFMG (10 nmol/kg) on day 7s, 10, and 13. Tumors were harvested on day 14. b Tumor growth pattern in LLC tumor-bearing mice administered PBS, cisplatin, cisplatin and TFG, or cisplatin and TFMG. The red arrowheads represent the time points of TFG/TFMG administration, while the blue arrowheads represent the time points of cisplatin administration. Tumor volumes in each group at days 7, 9, 11, and 13 were calculated (n = 8). *P < 0.001; #P < 0.0001 vs. PBS control. c Survival curves of LLC tumor-bearing mice. d Confocal images of tumor sections showing hypoxic regions in the center of the LLC tumors stained with Hypoxicprobe™ (green, PIMO, hypoxic areas) and CD31 (red, blood vessels) (n = 4). Scale bars: 100 μm. e Confocal images of tumor sections showing α-SMA+ pericyte coverage on tumor vessels. Frozen tumor sections were stained with α-SMA (green, pericyte), CD31 (red, blood vessels), and Hoechst 33258 (blue) (n = 4). Scale bars: 100 μm. f Mice bearing LLC tumor grafts were intravenously injected with (100 nmol/mouse) TFMG or PBS every other day three times. On the second day after the last injection, the tumor grafts were removed and sectioned (10 μm) while frozen. The endothelium was visualized using an antibody against CD31. After treatment, the mice were intravenously injected with 100 μg of Dylight488-lectin. Approximately 30 min later, tumor grafts were collected (n = 4). g To measure the permeability of tumor blood vessels after treatment, mice were intravenously injected with 2.5 mg FITC-dextran followed by 30 min of circulation. The tumor grafts were removed after heart perfusion (n = 3). The quantitations in (d–g) were conducted using ImageJ software. Data information: Data are presented as the mean ± SD. Significant enrichment: *P < 0.05; **P < 0.01; ***P < 0.001; ****P < 0.0001 (cg) (two-way ANOVA in (b); Mantel-Cox test in (c); and Sidak’s multiple comparisons test)

Similar articles

Cited by

References

    1. Carmeliet P, Jain RK. Molecular mechanisms and clinical applications of angiogenesis. Natur. 2011;473(7347):298–307. - PMC - PubMed
    1. Jain RK. Antiangiogenesis strategies revisited: from starving tumors to alleviating hypoxia. Cancer Cell. 2014;26(5):605–622. - PMC - PubMed
    1. Mazzone M, Dettori D, de Oliveira RL, Loges S, Schmidt T, Jonckx B, et al. Heterozygous deficiency of PHD2 restores tumor oxygenation and inhibits metastasis via endothelial normalization. Cell. 2009;136(5):839–851. - PMC - PubMed
    1. Kim C, Yang H, Fukushima Y, Saw PE, Lee J, Park JS, et al. Vascular RhoJ is an effective and selective target for tumor angiogenesis and vascular disruption. Cancer Cell. 2014;25(1):102–117. - PubMed
    1. Ferrara N, Kerbel RS. Angiogenesis as a therapeutic target. Nature. 2005;438(7070):967–974. - PubMed

Publication types

MeSH terms