. 2020 Sep 14;13(1):125.
doi: 10.1186/s13041-020-00658-6.

Glutamate-glutamine homeostasis is perturbed in neurons and astrocytes derived from patient iPSC models of frontotemporal dementia

Affiliations

Glutamate-glutamine homeostasis is perturbed in neurons and astrocytes derived from patient iPSC models of frontotemporal dementia

Blanca I Aldana et al. Mol Brain. .

Abstract

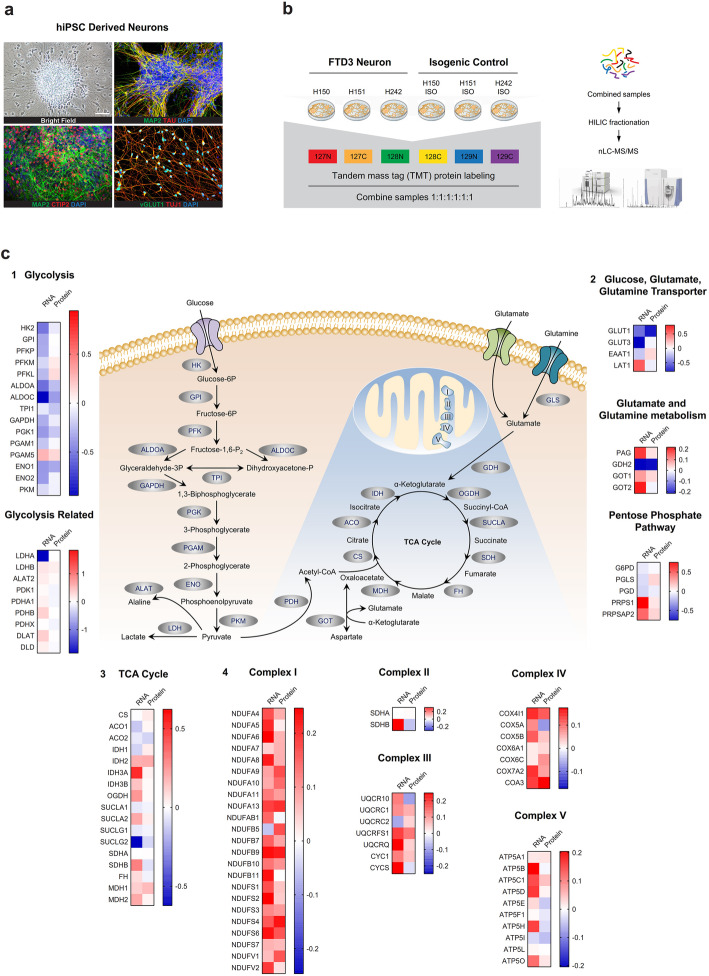
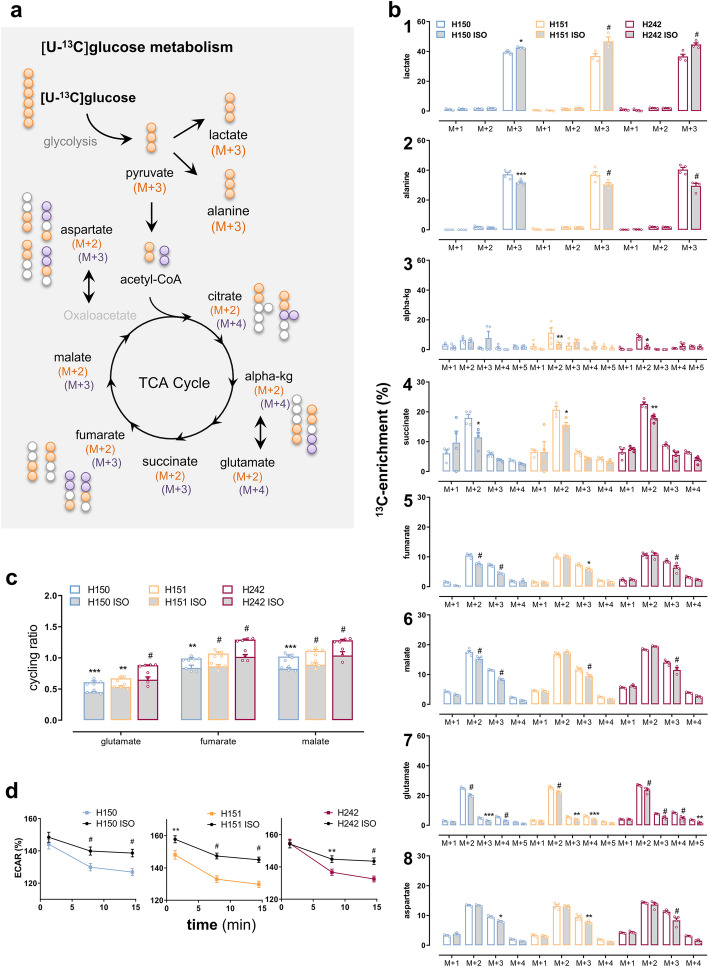
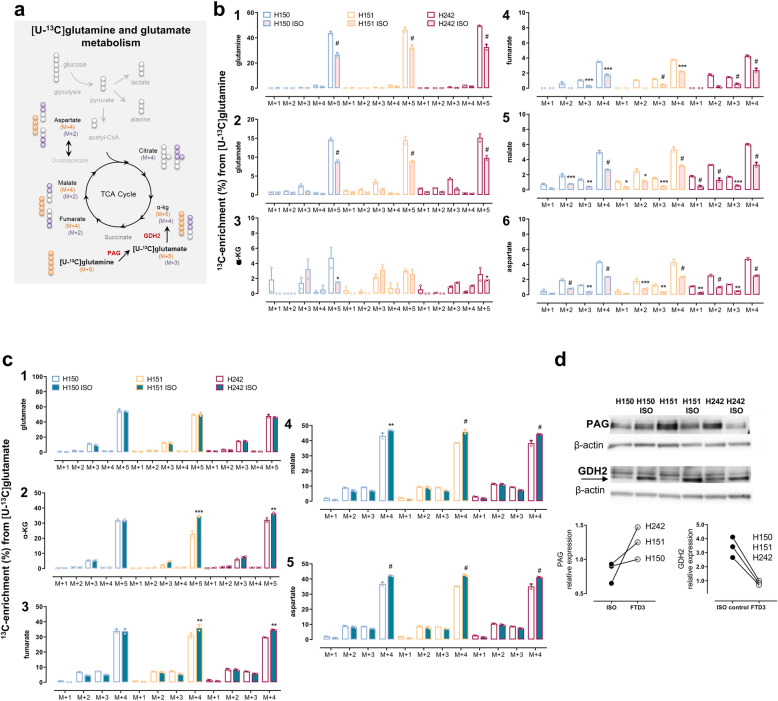
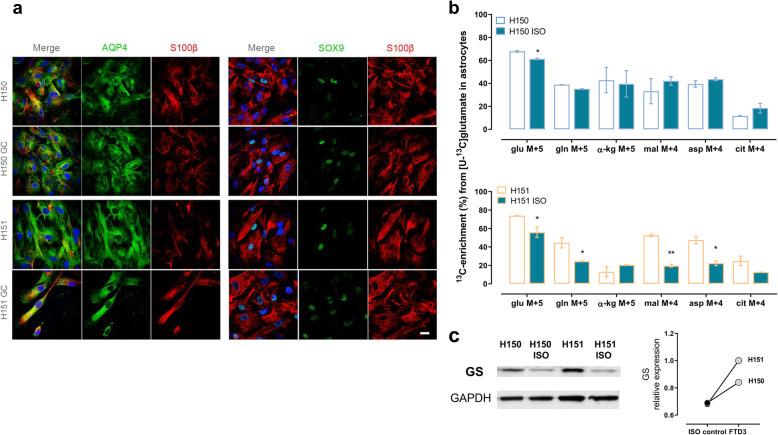
Frontotemporal dementia (FTD) is amongst the most prevalent early onset dementias and even though it is clinically, pathologically and genetically heterogeneous, a crucial involvement of metabolic perturbations in FTD pathology is being recognized. However, changes in metabolism at the cellular level, implicated in FTD and in neurodegeneration in general, are still poorly understood. Here we generate induced human pluripotent stem cells (hiPSCs) from patients carrying mutations in CHMP2B (FTD3) and isogenic controls generated via CRISPR/Cas9 gene editing with subsequent neuronal and glial differentiation and characterization. FTD3 neurons show a dysregulation of glutamate-glutamine related metabolic pathways mapped by 13C-labelling coupled to mass spectrometry. FTD3 astrocytes show increased uptake of glutamate whilst glutamate metabolism is largely maintained. Using quantitative proteomics and live-cell metabolic analyses, we elucidate molecular determinants and functional alterations of neuronal and glial energy metabolism in FTD3. Importantly, correction of the mutations rescues such pathological phenotypes. Notably, these findings implicate dysregulation of key enzymes crucial for glutamate-glutamine homeostasis in FTD3 pathogenesis which may underlie vulnerability to neurodegeneration. Neurons derived from human induced pluripotent stem cells (hiPSCs) of patients carrying mutations in CHMP2B (FTD3) display major metabolic alterations compared to CRISPR/Cas9 generated isogenic controls. Using quantitative proteomics, 13C-labelling coupled to mass spectrometry metabolic mapping and seahorse analyses, molecular determinants and functional alterations of neuronal and astrocytic energy metabolism in FTD3 were characterized. Our findings implicate dysregulation of glutamate-glutamine homeostasis in FTD3 pathogenesis. In addition, FTD3 neurons recapitulate glucose hypometabolism observed in FTD patient brains. The impaired mitochondria function found here is concordant with disturbed TCA cycle activity and decreased glycolysis in FTD3 neurons. FTD3 neuronal glutamine hypermetabolism is associated with up-regulation of PAG expression and, possibly, ROS production. Distinct compartments of glutamate metabolism can be suggested for the FTD3 neurons. Endogenous glutamate generated from glutamine via PAG may enter the TCA cycle via AAT (left side of neuron) while exogenous glutamate taken up from the extracellular space may be incorporated into the TCA cycle via GDH (right side of the neuron) FTD3 astrocytic glutamate uptake is upregulated whilst glutamate metabolism is largely maintained. Finally, pharmacological reversal of glutamate hypometabolism manifesting from decreased GDH expression should be explored as a novel therapeutic intervention for treating FTD3.

Keywords: CHMP2B; FTD3; GC-MS; GDH; GS; Glucose metabolism; Glutamate; Glutamine; PAG; iPSC-derived neuron.


Conflict of interest statement

The authors declare that they have no competing interests.

Figures

Fig. 1
Fig. 1
Genes encoding proteins regulating energy metabolism are differentially expressed in FTD3 versus control neurons derived from patient-specific iPSCs. a Immunocytochemistry of hiPSC-derived neurons for MAP 2, TAU, CTIP2, vGLUT1 and TUJ1. Scale bar, 50 μm for all. b Schematic of tandem mass tag (TMT) protein labelling of hiPSC-derived neurons for mass spectrometry-based quantitative analyses. c Key metabolism-relevant genes and metabolites involved in energy metabolic pathways including glycolysis and oxidative metabolism. Heatmaps for gene expression changes determined at both mRNA and protein levels, including genes encoding proteins responsible for glycolysis, the tricarboxylic acid (TCA) cycle, the mitochondrial electron transport chain and glucose and amino acid transportation. mRNA expression data were extracted from previously-published RNA-seq data. Fold-changes are represented by Log2 ratio for FTD3 neurons versus isogenic controls
Fig. 2
Fig. 2
FTD3 neurons display glucose hypometabolism contrasting with increased TCA cycle activity. a Schematic representation of the main labelling patterns obtained after incubation with [U-13C] glucose and 13C-enrichment depicted as percentage labelling in metabolites from neuronal glucose metabolism. b Cultures were incubated for 90 min with [U-13C] glucose (2.5 mM) then cell extracts were collected and analysed using GC-MS for determination of the percentage distribution of 13C-labelled metabolites in CRISPR/Cas9-generated isogenic controls (grey bars) and the respective FTD3 patient cell lines (H150, H151 and H242; white bars). [U-13C] glucose is metabolized to [U-13C] pyruvate during glycolysis which can either be converted to [U-13C] alanine (alanine M + 3) or be rapidly transformed into [U-13C] lactate (lactate M + 3). In addition, pyruvate can be further metabolized in the TCA cycle, entering as [1,2-13C]Acetyl-Coenzyme A (Ac-CoA [1,2-13C]) which reacts with unlabelled oxaloacetate. Hence, double-labelled TCA cycle metabolites are produced from the first turn metabolism of [1,2-13C]Ac-CoA in the TCA cycle [18] while a second turn of the TCA cycle yields M + 4 and M + 3 labelled metabolites. Subsequent turns will give rise to complex labelling patterns and labelling in further isotopologues (M + X). Decreased labelling (%) in lactate M + 3 indicates reduced glycolytic activity while increased labelling in the TCA cycle metabolites and amino acids indicates increased TCA cycle activity, directly evaluated by calculating the cycling ratios shown in c as the ratio of % labelling in isotopologue (M + X) from every other TCA cycle turns divided by M + 2% labelling obtained from a first turn of the TCA cycle (see Methods). These showed increased TCA cycle turnover (staked white bars) in the FTD3 neurons. Data are presented as labelling (%) of M + X, where M is the mass of the unlabeled metabolite and X is the number of 13C-labeled carbon atoms. d Extracellular acidification rate as an indicator of glycolytic activity was measured in real using the XFe96 Extracellular Flux Analyzer (Seahorse Biosciences-Agilent Technologies) with glucose as substrate in isogenic controls (black lines) and FTD3 patient cell lines (color lines). ECAR is denoted as percentage of the respective non-glycolytic medium acidification values (last point taken at the end of the assay). The decrease in ECAR demonstrates diminished lactate release from hampered glycolytic activity. Results are means ± S.E.M. obtained from three different patient cell lines indicated by small circles from at least three different culture preparations of hiPSC-derived neurons. *P < 0.05 or **P < 0.001, ***P < 0.0005, # P < 0.0001, two-way ANOVA correcting for multiple comparisons was employed
Fig. 3
Fig. 3
Dysregulation of glutamine and glutamate metabolism mirror each other in FTD3 neurons. a Scheme depicting the main labelling patterns from neuronal [U-13C] glutamine and [U-13C] glutamate metabolism and 13C-enrichment as percentage labelling in metabolites. Cultures were incubated for 90 min with b [U-13C] glutamine (0.5 mM), or c [U-13C] glutamate (0.25 mM) in the presence of unlabelled glucose (2.5 mM) then cell extracts were collected and analysed using GC-MS for determination of the percentage distribution of 13C-labelled metabolites in isogenic controls (pink bars/green bars) and the respective FTD3 patient cell lines incubated with 13C-labelled glutamine or glutamate (white bars). b The increased labelling in the TCA cycle metabolites and amino acids after [U-13C] glutamine incubation indicates increased metabolism of this amino acid. c In contrast, unmodified labelling in glutamate M + 5 and increased labelling in direct metabolites from [U-13C] glutamate indicates intact glutamate transport but decreased glutamate metabolism. d Protein expression assayed for by Western blot analyses of the two main enzymes involved in glutamine and glutamate degradation, namely PAG and GDH, respectively. Expression of PAG protein was upregulated while that of GDH was substantially reduced in FTD3 neurons from the three different patient cell lines (H150, H151 and H242). β-Actin was used as loading control. Results represent means ± S.E.M. obtained from three different patient cell lines indicated by small circles from three different culture preparations of hiPSC-derived neurons. *P < 0.05 or **P < 0.001, ***P < 0.0005, # P < 0.0001, two-way ANOVA correcting for multiple comparisons was employed
Fig. 4
Fig. 4
Increased glutamate uptake and metabolism in FTD3 astrocytes. a Representative immunocytochemistry images of astrocytes from FTD3 patient cell lines (H150 and H151) and their respective isogenic control cell lines at 10 weeks of maturation. All cell lines express astrocyte markers Aquaporin-4 (AQP4), S100beta (S100β) and SOX9. Scale bar: 25 μm. b Percentage distribution of 13C-labelled metabolites obtained from direct metabolism [U-13C] glutamate in FTD3 astrocytes from the patient cell lines (white bars) and their respective isogenic controls (green bars). Astrocytes in culture were incubated for 90 min with [U-13C] glutamate (0.25 mM) in the presence of unlabelled glucose (2.5 mM): astrocyte extracts were subsequently collected and analysed using GC-MS for determination of 13C-enrichment. The increased labelling in the intracellular glutamate and other TCA cycle metabolites and amino acids after [U-13C] glutamate incubation indicates increased uptake and metabolism of this amino acid. Results represent means ± S.E.M. obtained from three different patient cell lines from three different culture preparations of hiPSC-derived neurons. *P < 0.05 or **P < 0.001; two-way ANOVA correcting for multiple comparisons was employed. c Representative Western blot analyses of protein expression of glutamine synthetase (GS). Glyceraldehyde 3-phosphate dehydrogenase (GAPDH) was used as loading control. Expression of GS protein was found to be upregulated in FTD3 neurons from the two different patient cell lines (H150 and H151)

References

    1. Rossor MN, Fox NC, Mummery CJ, Schott JM, Warren JD. The diagnosis of young-onset dementia. Lancet Neurol. 2010;9:793–806. - PMC - PubMed
    1. Bang J, Spina S, Miller BL. Frontotemporal dementia. Lancet. 2015;386:1672–1682. - PMC - PubMed
    1. Ahmed RM, et al. Amyotrophic lateral sclerosis and frontotemporal dementia: distinct and overlapping changes in eating behaviour and metabolism. Lancet Neurol. 2016;15:332–342. - PubMed
    1. Diehl-Schmid J, et al. Decline of cerebral glucose metabolism in frontotemporal dementia: a longitudinal 18F-FDG-PET-study. Neurobiol Aging. 2007;28:42–50. - PubMed
    1. Zhang Y, et al. An RNA-sequencing transcriptome and splicing database of glia, neurons, and vascular cells of the cerebral cortex. J Neurosci. 2014;34:11929–11947. - PMC - PubMed

Publication types