. 2020 Dec 1;26(23):6362-6373.
doi: 10.1158/1078-0432.CCR-20-1762. Epub 2020 Sep 14.

The Capacity of the Ovarian Cancer Tumor Microenvironment to Integrate Inflammation Signaling Conveys a Shorter Disease-free Interval

Affiliations

The Capacity of the Ovarian Cancer Tumor Microenvironment to Integrate Inflammation Signaling Conveys a Shorter Disease-free Interval

Kimberly R Jordan et al. Clin Cancer Res. .

Abstract

Purpose: Ovarian cancer has one of the highest deaths to incidence ratios across all cancers. Initial chemotherapy is effective, but most patients develop chemoresistant disease. Mechanisms driving clinical chemo-response or -resistance are not well-understood. However, achieving optimal surgical cytoreduction improves survival, and cytoreduction is improved by neoadjuvant chemotherapy (NACT). NACT offers a window to profile pre- versus post-NACT tumors, which we used to identify chemotherapy-induced changes to the tumor microenvironment.

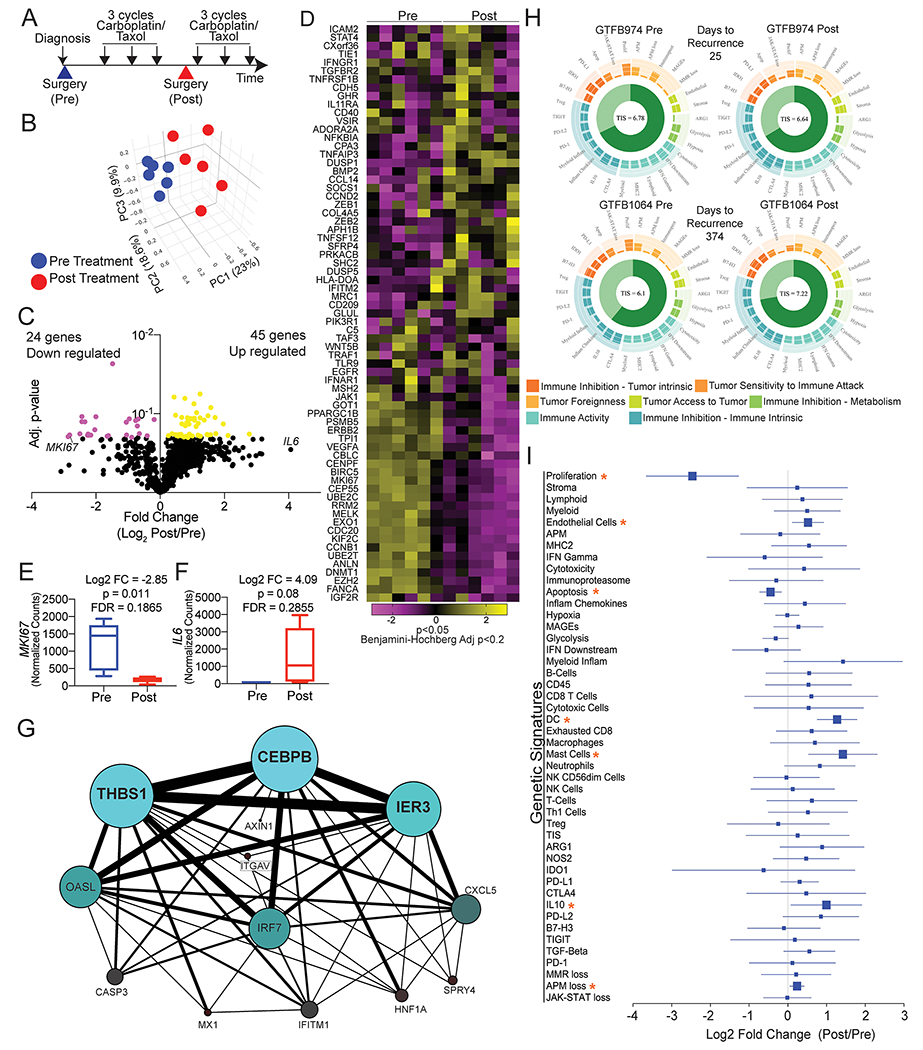
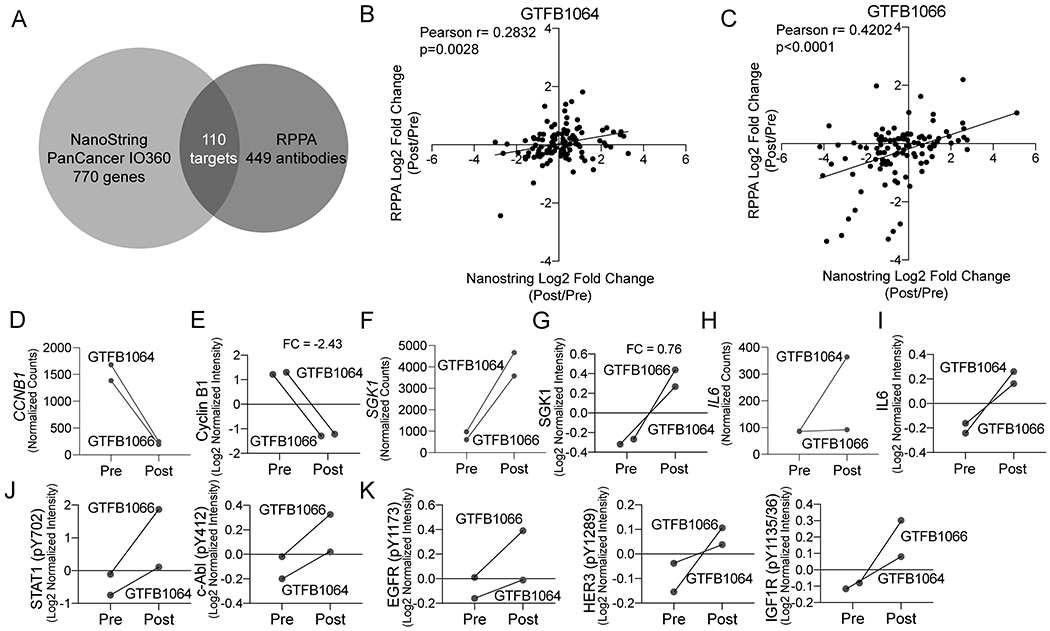
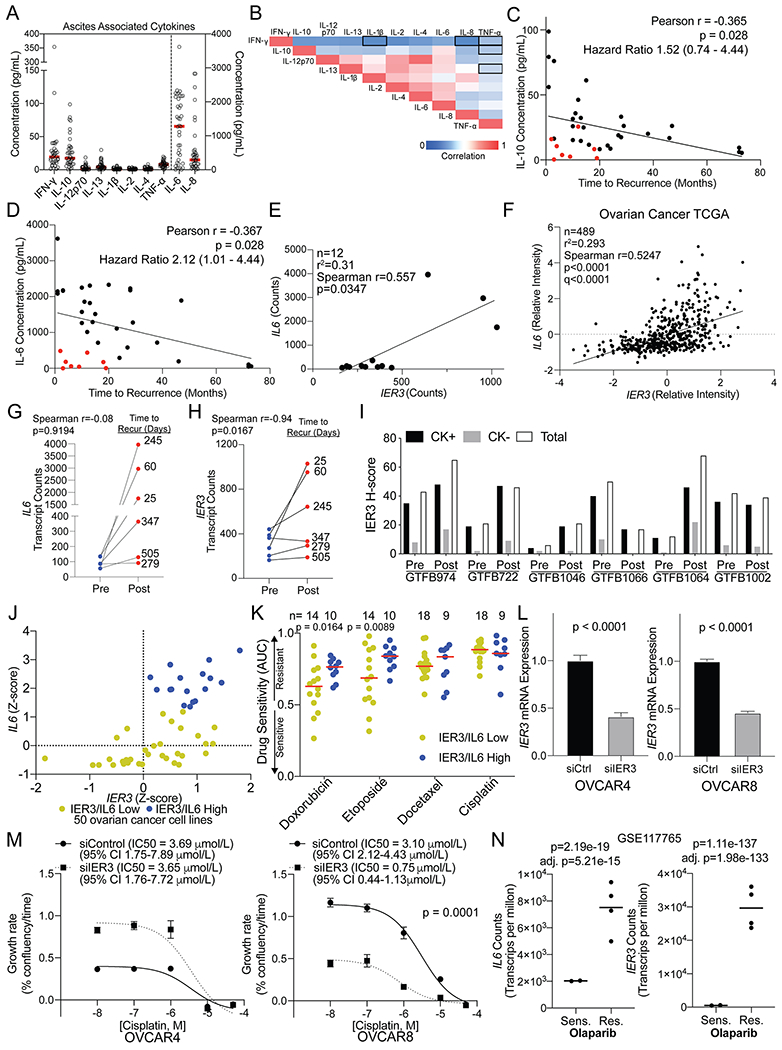
Experimental design: We obtained matched pre- and post-NACT archival tumor tissues from patients with high-grade serous ovarian cancer (patient, n = 6). We measured mRNA levels of 770 genes (756 genes/14 housekeeping genes, NanoString Technologies), and performed reverse phase protein array (RPPA) on a subset of matched tumors. We examined cytokine levels in pre-NACT ascites samples (n = 39) by ELISAs. A tissue microarray with 128 annotated ovarian tumors expanded the transcriptional, RPPA, and cytokine data by multispectral IHC.

Results: The most upregulated gene post-NACT was IL6 (16.79-fold). RPPA data were concordant with mRNA, consistent with elevated immune infiltration. Elevated IL6 in pre-NACT ascites specimens correlated with a shorter time to recurrence. Integrating NanoString (n = 12), RPPA (n = 4), and cytokine (n = 39) studies identified an activated inflammatory signaling network and induced IL6 and IER3 (immediate early response 3) post-NACT, associated with poor chemo-response and time to recurrence.

Conclusions: Multiomics profiling of ovarian tumor samples pre- and post-NACT provides unique insight into chemo-induced changes to the tumor microenvironment. We identified a novel IL6/IER3 signaling axis that may drive chemoresistance and disease recurrence.


Conflict of interest statement

The authors declare no potential conflicts of interest.

Figures

Figure 1.
Figure 1.. Chemotherapy-induced transcriptional dynamics.
A) Graphic representation of NACT. Large arrowheads = surgeries, small black arrows = cycles of carboplatin/paclitaxel. B) Principal component (PC) analysis of the transcriptome of 770 genes (14 housekeeping genes not included) in HGSOC tumors pre (blue) and post (red) chemotherapy. C) Volcano plot of differentially regulated genes. P-value calculated with paired t-test with Benjamin-Hochberg multi-comparison correction (Adj. p-value). Yellow dots = Log2 FC>0 and adj. p-value <0.2. Pink dots = Log2 FC<0 and adj. p-value <0.2. D) Heatmap of the 74 differentially expressed genes, generated with Clustergrammer from Nanostring data. Normalized counts are transformed with Z-score method. E) MKI67 expression changes between pre- and post-NACT. F) IL6 expression changes between pre- and post-NACT. G) Transcription factor relationship of 18 genes associated with disease recurrence. Generated via PathwayNet data portal (21). H) Utilizing the gene expression data genetic signature analyses was performed on all twelve samples. Shown are representative images of the genetic signature analysis from two sets of pre- and post-chemotherapy tumors (GTFB974 and GTFB1064). Each spoke on the circular plot indicates a unique genetic signature, such as proliferation, antigen-processing and presentation machinery loss, glycolysis. Genetic signatures are grouped by tumor immune microenvironment and characteristics of the tumor microenvironment. The Tumor Inflammation Score (TIS) is indicated at the center of the circular plot. I) Log2 fold change Forest plot of genetic signatures when grouped pre- and post-chemotherapy. Orange asterisks = p<0.05 and FDR<0.20.
Figure 2.
Figure 2.. Reverse phase protein array of pre- and post-chemotherapy treated HGSOC tumors.
A) Venn diagram indicating the overlap in targets from NanoString and RPPA. B) Scatter plot of log2 fold change (Post/Pre) of the overlapping targets of the RPPA (y-axis) and NanoString (x-axis) from GTFB1064. Pearson correlation calculated. C) Same as B, but with expression data from GTFB1066. D) Transcript counts of CCNB1 for GTFB1064 and GTFB1066. E) RPPA data of Cyclin B1 protein from pre- and post-treated tumors. F) Transcript counts of SGK1 for GTFB1064 and GTFB1066. G) RPPA data of SGK1 protein from pre- and post-treated tumors. H) Transcript counts of IL6 for GTFB1064 and GTFB1066. I) RPPA data of IL-6 protein for pre and post-treated tumors. J) RPPA data of phosphoSTAT1 and phospho-c-Abl. Connecting lines indicate matched tumors. K) RPPA data of phosphorylated receptor tyrosine kinases, EGFR (pY1173), HER3 (pY1289), and IGF1R (pY1135/36).
Figure 3.
Figure 3.. Cytokine profiling of primary patient-derived ascites and transcriptional changes within matched tumors predict tumor recurrence.
A) Ascites was collected from patients with HGSOC and was used for multi-plex ELISA from the indicated cytokines. Red bars = mean. Left y-axis include = IFN-y, IL-10, IL-12p70, IL-13, IL-1b, IL-2, IL-4, and TNF-a. The right y-axis includes IL-6 and IL-8. B) Correlation between the indicated cytokines. Red = 1 or strong correlation. Blue = 0 or weak correlation. (n = 39). Outline boxes indicate Spearman correlation p-value >0.01. C) Correlation between time to disease recurrence and IL-10 concentration. Hazard ratio calculated by stratifying data based on the median IL-10 concentration and using the Mantel-Haenszel test. D) Correlation between time to disease recurrence and IL-6 concentration. Red dots = short time to recurrence with low IL-6 concentrations. Hazard ratio calculated by stratifying data based on the median IL-6 concentration and using the Mantel-Haenszel test. E) Correlation of IL6 and IER3 expression from pre and post-NACT samples. F) IL6 and IER3 expression in 489 HGSOC tumors within TCGA. G) Change in IL6 expression in pre- and post-treated tumors. Connecting lines indicate matching tumors. H) Change in IER3 expression in pre- and post-treated tumors. Connecting lines indicate matching tumors. I) Matched pre- and post-NACT tumors (n=12) from Nanostring analysis were used for multispectral IHC against IER3 and cytokeratin (CK). The H-score for IER3 is graphed for CK positive (CK+), CK negative (CK−), and total cells. J) IER3 and IL6 Z-scores derived from ovarian cancer cell lines (n=50) in the cBio Cancer Cell Line Encyclopedia (CCLE) dataset (Accessed June 2020). A combined Z-score of greater than 2 was set to identify IER3/IL6 high (blue dots) and low (yellow) expressing cell lines. K) Drug sensitivity (area under the curve, AUC) assessed for IER3/IL6 high (blue dots) and low (yellow dots) expressing cell lines. Fisher’s LSD are from two-way ANOVA (no multiple correction). Red line = median AUC for group. L) siRNA mediated IER3 knockdown in OVCAR4 and OVCAR8 cells. IER3 mRNA expression in siControl (siCtrl) and siIER3 cells. Internal control, GAPDH. Statistical test, unpaired t-test. M) siCtrl and siIER3 OVCAR4 and OVCAR8 cells were dosed with cisplatin and imaged over 72 hrs. The growth rate was calculated via linear regression for every conditions and a dose response curve graphed. Statistical test, non-linear regression fit. Error bars, standard deviation. N) IL6 and IER3 transcript counts per million (TPM) of an olaparib sensitive (Sens.) and resistant (Res.) PEO1 cell line (GSE117765). Statistical tests, unpaired t-test (p-value) and adj. p-value, Benjamini-Hochberg.
Figure 4.
Figure 4.. Evaluating associations between IER3 expression and the tumor microenvironment.
A) Representative images of IER3 IHC with associated histology score (H-score). Scale bars, 100 microns. B) IER3 histology score (H-score) for pre- (n= 85) and post-NACT (n=19) and recurrent (n=24) human HGSOC tumors. (p-value, one way ANOVA). C) Representative images of multi-spectral IHC of HGSOC tumors. Scale bars, 100 microns. Based on the median IER3 expression tumors were defined as “Low” (n=80) or “High” (n=39). The percentage of tumor-associated macrophages (D), Tregs (E), CD4+ T cells (F), CD8+ T cells (G), CD8/Granzyme B(Grb)+ T cells (H) was correlated to IER3 expression. Statistical test, unpaired t-test with Welch’s correction. Error bars, SEM. Note: difference in n between panels G and H-L due to missing tissue cores. I) Multispectral analysis of IER3, cytokeratin (CK+), CD19+ B cells, CD8 T cells, CD4 T cell, and CD68+ macrophages (Macro.) IER3 expression in indicated cells from the tumor compartment (CK+) and stromal compartment (J). Models for signal integration (K) and magnitude of signal intensity (L).

References

    1. Siegel RL, Miller KD, and Jemal A. Cancer statistics, 2019. CA Cancer J Clin. 2019;69(1):7–34. - PubMed
    1. Fagotti A, Ferrandina G, Fanfani F, Ercoli A, Lorusso D, Rossi M, et al. A laparoscopy-based score to predict surgical outcome in patients with advanced ovarian carcinoma: a pilot study. Ann Surg Oncol. 2006;13(8):1156–61. - PubMed
    1. Petrillo M, Vizzielli G, Fanfani F, Gallotta V, Cosentino F, Chiantera V, et al. Definition of a dynamic laparoscopic model for the prediction of incomplete cytoreduction in advanced epithelial ovarian cancer: proof of a concept. Gynecol Oncol. 2015;139(1):5–9. - PubMed
    1. Bian C, Yao K, Li L, Yi T, and Zhao X. Primary debulking surgery vs. neoadjuvant chemotherapy followed by interval debulking surgery for patients with advanced ovarian cancer. Arch Gynecol Obstet. 2016;293(1):163–8. - PubMed
    1. May T, Comeau R, Sun P, Kotsopoulos J, Narod SA, Rosen B, et al. A Comparison of Survival Outcomes in Advanced Serous Ovarian Cancer Patients Treated With Primary Debulking Surgery Versus Neoadjuvant Chemotherapy. Int J Gynecol Cancer. 2017;27(4):668–74. - PubMed

Publication types

MeSH terms