. 2020 Oct 9;147(19):dev189449.
doi: 10.1242/dev.189449.

Establishment of a relationship between blastomere geometry and YAP localisation during compaction

Affiliations

Establishment of a relationship between blastomere geometry and YAP localisation during compaction

Christophe Royer et al. Development. .

Abstract

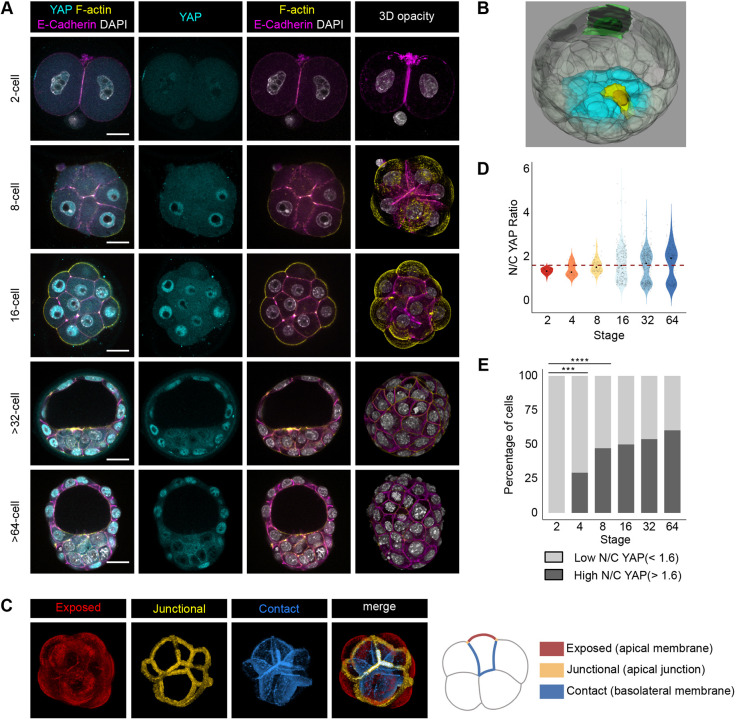
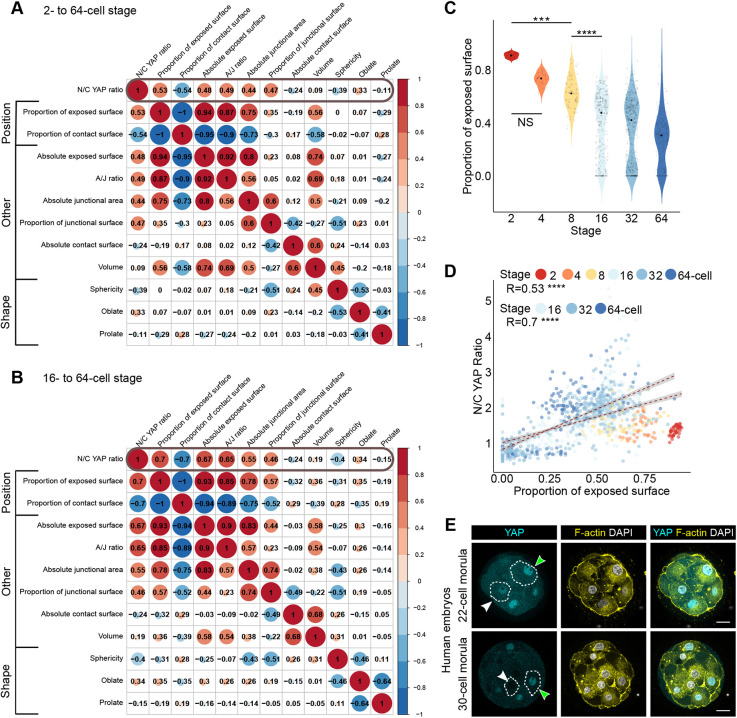
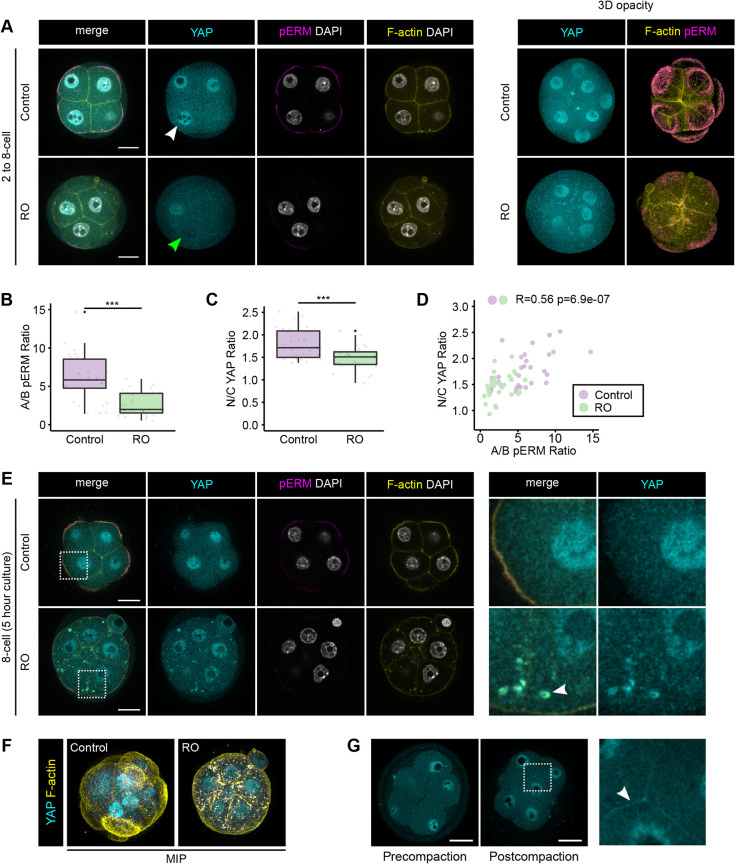
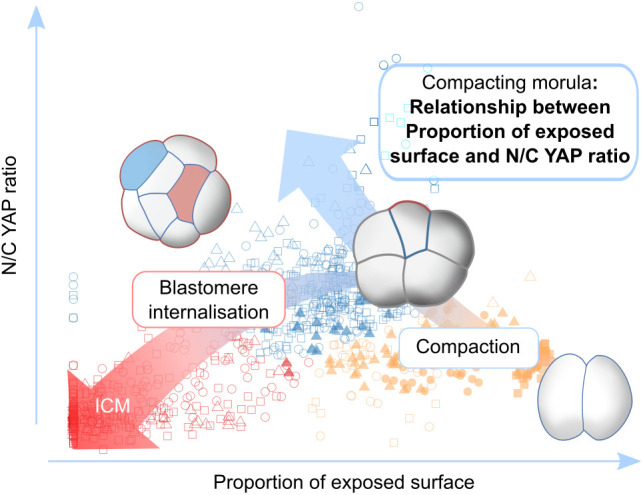
Precise patterning within the three-dimensional context of tissues, organs and embryos implies that cells can sense their relative position. During preimplantation development, outside and inside cells rely on apicobasal polarity and the Hippo pathway to choose their fate. Despite recent findings suggesting that mechanosensing might be central to this process, the relationship between blastomere geometry (i.e. shape and position) and the Hippo pathway effector YAP remains unknown. We used a highly quantitative approach to analyse information on the geometry and YAP localisation of individual blastomeres of mouse and human embryos. We identified the proportion of exposed cell surface area as most closely correlating with the nuclear localisation of YAP. To test this relationship, we developed several hydrogel-based approaches to alter blastomere geometry in cultured embryos. Unbiased clustering analyses of blastomeres from such embryos revealed that this relationship emerged during compaction. Our results therefore pinpoint the time during early embryogenesis when cells acquire the ability to sense changes in geometry and provide a new framework for how cells might integrate signals from different membrane domains to assess their relative position within the embryo.

Keywords: Biocompatible polymers; Compaction; Hippo signalling; Human embryo.


Conflict of interest statement

Competing interestsThe authors declare no competing or financial interests.

Figures

Fig. 1.
Fig. 1.
Analysis of the N/C YAP ratio across preimplantation development using manual segmentation. (A) Immunostaining of preimplantation embryos using antibodies against YAP and E-cadherin. F-actin and nuclei were visualised using Phalloidin and DAPI, respectively. (B) Example of a manually segmented 32-cell blastocyst showing blastomeres (green and yellow cells) exhibiting different shapes. Part of the cells making the trophectoderm are not displayed, in order to be able to see inside the blastocyst cavity. The ICM is highlighted in cyan. (C) Blastomere membranes were segmented to obtain blastomere ‘exposed’, ‘junctional’ and ‘contact’ surfaces corresponding to the apical membrane, apical junction and basolateral membrane, respectively. (D) Representation of the relative amount of YAP in the nucleus and cytoplasm (N/C YAP ratio) of individual blastomeres at the two- (n=20 embryos), four- (n=8 embryos), eight- (n=10 embryos), 16- (n=17 embryos), 32- (n=12 embryos) and 64-cell stage (n=2 embryos). A black dot indicates the median N/C YAP ratio for each developmental stage. (E) Representation of the proportion of blastomeres with low and high N/C YAP ratio across developmental stages. Blastomeres from all stages were classified as exhibiting either a high (>1.6) or a low (<1.6) N/C YAP ratio based on a k-means algorithm to separate them into two populations in an unbiased manner. The threshold is also represented in D by a dashed line. Scale bars: 20 µm. ***P<0.001, ****P<0.0001 (Fisher's exact test).
Fig. 2.
Fig. 2.
The proportion of exposed surface is associated with the proportion of YAP in the nucleus. (A) Correlation matrix between N/C YAP ratio and geometric characteristics of individual blastomeres across preimplantation development. (B) Correlation matrix between N/C YAP ratio and geometric characteristics of individual blastomeres from the 16- to the 64-cell stage. Note how the proportion of exposed surface and its converse, the proportion of contact surface, are correlated the highest with the N/C YAP ratio. In A and B, the value of the correlation coefficient (Spearman) between two variables is indicated and also represented by the size and colour of the circles. (C) Proportion of exposed blastomere surface area across developmental stages. The median proportion of exposed surface area for each developmental stage is represented as a black dot. NS=not significant, **P<0.01, ***P<0.001 (Kruskal–Wallis test followed by Dunn's test). (D) Correlation analysis between the proportion of exposed cell surface area (an indicator of position) and the N/C YAP ratio at the indicated stages. ****P<0.0001 (Spearman). (E) Representative optical sections of human morulae containing the indicated number of cells and immunostained for YAP. White arrowheads indicate cells with either low or no exposed cell surface area and low nuclear YAP, whereas green arrowheads indicate cells with high exposed cell surface area and high nuclear YAP. F-actin and nuclei were visualised using Phalloidin and DAPI, respectively. Scale bars: 20 µm.
Fig. 3.
Fig. 3.
Hierarchical clustering analysis reveals the association between the proportion of exposed surface and the N/C YAP ratio in compacted eight-cell embryos. (A) Images of an eight-cell embryo immunostained for YAP and pERM, illustrating variations in the N/C YAP ratio at the eight-cell stage. F-actin and nuclei were visualised using Phalloidin and DAPI, respectively. White arrowhead indicates a blastomere with lower N/C YAP ratio. Green arrowhead highlights the presence of apical pERM. Bottom right panel shows a three-dimensional (3D) opacity rendering of the corresponding embryo. Scale bars: 20 µm. (B) Hierarchical clustering of blastomeres across preimplantation development into three distinct clusters. Blastomeres with a high N/C YAP ratio and intermediate proportion of exposed cell surface area were classified as belonging to the outside-like cluster. Blastomeres with a low N/C YAP ratio and low exposed cell surface area were classified as belonging to the inside-like cluster. Finally, the remaining blastomeres, exhibiting a high proportion of exposed cell surface area and intermediate N/C YAP ratio were defined as belonging to an ‘undefined cluster’. Dot shape indicates stage, whereas colour indicates the cluster to which each blastomere belongs (Spearman, R=0.78, P<2.2×10⁻¹⁶). Bottom right bar graph represents the distribution of blastomeres across the three clusters for each stage. (C) Analysis of the N/C YAP ratio and the proportion of exposed cell surface area at the eight-cell stage in precompaction, compacting and postcompaction embryos. (D) Bar graphs representing the proportion of blastomeres from precompaction, compacting and postcompaction embryos in the undefined, inside-like and outside-like clusters (top). The proportion of blastomeres from each cluster found in precompaction, compacting and postcompaction embryos is shown at the bottom. (E) Correlation between the proportion of exposed surface and the N/C YAP ratio in undefined (top) (Spearman, R=0.52, P=1.4×10⁻⁴) and inside- and outside-like eight-cell blastomeres (bottom) (Spearman, R=0.71, P=5.3×10⁻⁵).
Fig. 4.
Fig. 4.
Biochemical changes occurring during compaction are required for the nuclear accumulation of YAP in a subset of blastomeres from the two- to eight-cell stage. (A) Representative images of DMSO- and RO-treated embryos grown in vitro from the two- to the eight-cell stage immunostained for YAP and pERM. F-actin and nuclei were visualised using Phalloidin and DAPI, respectively. White arrowhead indicates a nucleus with high levels of YAP, whereas green arrowhead indicates a nucleus with low levels of YAP. Right panel shows three-dimensional opacity renderings of corresponding embryos. Scale bars: 20 µm. (B) Boxplot showing the proportion of pERM at the apical membrane in control (n=4 embryos) and RO-treated (n=4 embryos) embryos. (C) Boxplot showing the proportion of YAP in the nucleus in control and RO-treated embryos. ***P<0.001 (Kruskal–Wallis test). (D) Plot showing the relationship between the proportion of pERM at the apical membrane and N/C YAP ratio in control and RO-treated embryos (Spearman, R=0.56, P=6.9×10⁻⁷). (E) Representative images of embryos cultured for 5 h at the eight-cell stage in the presence of either DMSO or RO and subsequently immunostained for YAP and pERM. F-actin and nuclei were visualised using Phalloidin and DAPI, respectively. Right panel shows magnification of the areas surrounded by dashed outlines. The white arrowhead indicates cytoplasmic puncta of F-actin and YAP. Scale bars: 20 µm. (F) Maximum intensity projections of embryos shown in E. (G) Representative images of pre- and postcompaction eight-cell embryos immunostained for YAP and showing blastomeres with comparable N/C YAP ratios. The panel on the right shows a high-magnification image of the boxed area. The white arrowhead points at YAP localised at cell-cell junctions.
Fig. 5.
Fig. 5.
Manipulation of embryo shape reveals position sensing at the eight-cell stage. (A) Diagram representing the experimental design to obtain cylindrical embryos. Eight-cell embryos were inserted into channels 25 µm in diameter and cultured for 5 h. (B) Representative images of control and cylindrical eight-cell embryos immunostained for YAP and pERM. F-actin and nuclei were visualised using Phalloidin and DAPI, respectively. Scale bars: 20 µm. (C) Diagram representing the experimental design to obtain planar embryos. Eight-cell embryos were covered with a hydrogel sheet and cultured under confinement for 5 h. (D) Representative image of a planar eight-cell embryo immunostained for YAP. F-actin was visualised using Phalloidin. Scale bar: 20 µm. (E) Plot showing the proportion of exposed surface and N/C YAP ratio in control (n=6 embryos) and cylindrical (n=7 embryos) embryos. Marginal density plots for control and cylindrical embryos, on the sides of the graph, show a shift in both the proportion of exposed surface and the N/C YAP ratio in blastomeres from cylindrical embryos. (F) Plot showing the proportion of exposed surface and the N/C YAP ratio in control (n=6 embryos) and planar (n=4 embryos) embryos. Note the absence of changes in the proportion of exposed surface and N/C YAP ratio in the marginal density plots. (G) Representation of the proportion of exposed surface and N/C YAP ratio in blastomeres from control and cylindrical embryos and the different clusters obtained by hierarchical clustering. (H) Bar graph representing the proportion of blastomeres from control or cylindrical embryos in each cluster. (I) Proportion of blastomeres from each cluster in control and cylindrical embryos.
Fig. 6.
Fig. 6.
Summary diagram. A relationship between the proportion of exposed surface and the N/C YAP ratio emerges in blastomeres during compaction. Our results suggest that blastomeres are on a TE trajectory from the the two- to the eight-cell stage. Subsequently, blastomere internalisation drives the emergence of the ICM lineage.

Similar articles

Cited by

References

    1. Anani S., Bhat S., Honma-Yamanaka N., Krawchuk D. and Yamanaka Y. (2014). Initiation of Hippo signaling is linked to polarity rather than to cell position in the pre-implantation mouse embryo. Development 141, 2813-2824. 10.1242/dev.107276 - DOI - PubMed
    1. Aragona M., Panciera T., Manfrin A., Giulitti S., Michielin F., Elvassore N., Dupont S. and Piccolo S. (2013). A mechanical checkpoint controls multicellular growth through YAP/TAZ regulation by actin-processing factors. Cell 154, 1047-1059. 10.1016/j.cell.2013.07.042 - DOI - PubMed
    1. Briscoe J. and Small S. (2015). Morphogen rules: design principles of gradient-mediated embryo patterning. Dev. 142, 3996-4009. 10.1242/dev.129452 - DOI - PMC - PubMed
    1. Cockburn K., Biechele S., Garner J. and Rossant J. (2013). The hippo pathway member Nf2 is required for inner cell mass specification. Curr. Biol. 23, 1195-1201. 10.1016/j.cub.2013.05.044 - DOI - PubMed
    1. Couzens A. L., Knight J. D. R., Kean M. J., Teo G., Weiss A., Dunham W. H., Lin Z.-Y., Bagshaw R. D., Sicheri F., Pawson T. et al. (2013). Protein interaction network of the mammalian hippo pathway reveals mechanisms of kinase-phosphatase interactions. Sci. Signal. 6, rs15-rs15 10.1126/scisignal.2004712 - DOI - PubMed

Publication types

Substances